Visualização normal

Antes de ontemStream principal

How to scan for vulnerabilities with GitHub Security Lab’s open source AI-powered framework

For the last few months, we’ve been using the GitHub Security Lab Taskflow Agent along with a new set of auditing taskflows that specialize in finding web security vulnerabilities. They also turn out to be very successful at finding high-impact vulnerabilities in open source projects. 

As security researchers, we’re used to losing time on possible vulnerabilities that turn out to be unexploitable, but with these new taskflows, we can now spend more of our time on manually verifying the results and sending out reports. Furthermore, the severity of the vulnerabilities that we’re reporting is uniformly high. Many of them are authorization bypasses or information disclosure vulnerabilities that allow one user to login as somebody else or to access the private data of another user.

Using these taskflows, we’ve reported more than 80 vulnerabilities so far. At the time of writing, approximately 20 of them have already been disclosed. And we’re continually updating our advisories page when new vulnerabilities are disclosed. In this blog post, we’ll show a few concrete examples of high-impact vulnerabilities that are found by these taskflows, like accessing personally identifiable information (PII) in shopping carts of ecommerce applications or signing in with any password into a chat application.

We’ll also explain how the taskflows work, so you can learn how to write your own. The security community moves faster when it shares knowledge, which is why we’ve made the framework open source and easy to run on your own project. The more teams using and contributing to it, the faster we collectively eliminate vulnerabilities.

How to run the taskflows on your own project

Want to get started right away? The taskflows are open source and easy to run yourself! Please note: A GitHub Copilot license is required, and the prompts will use premium model requests. (Note that running the taskflows can result in many tool calls, which can easily consume a large amount of quota.)

  1. Go to the seclab-taskflows repository and start a codespace.
  2. Wait a few minutes for the codespace to initialize.
  3. In the terminal, run ./scripts/audit/run_audit.sh myorg/myrepo

It might take an hour or two to finish on a medium-sized repository. When it finishes, it’ll open an SQLite viewer with the results. Open the “audit_results” table and look for rows with a check-mark in the “has_vulnerability” column.

Tip: Due to the non-deterministic nature of LLMs, it is worthwhile to perform multiple runs of these audit taskflows on the same codebase. In certain cases, a second run can lead to entirely different results. In addition to this, you might perform those two runs using different models (e.g., the first using GPT 5.2 and the second using Claude Opus 4.6).

The taskflows also work on private repos, but you’ll need to modify the codespace configuration to do so because it won’t allow access to your private repos by default.

Introduction to taskflows

Taskflows are YAML files that describe a series of tasks that we want to do with an LLM. With them, we can write prompts to complete different tasks and have tasks that depend on each other. The seclab-taskflow-agent framework takes care of running the tasks sequentially and passing the results from one task to the next.

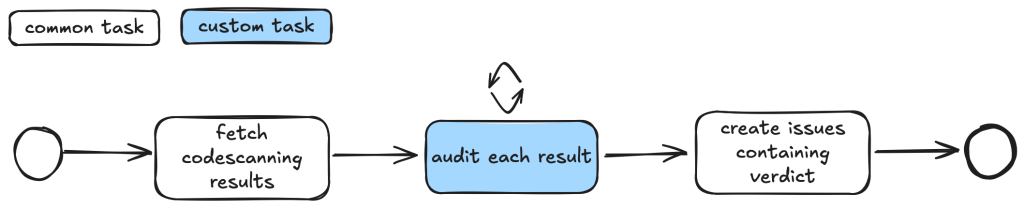
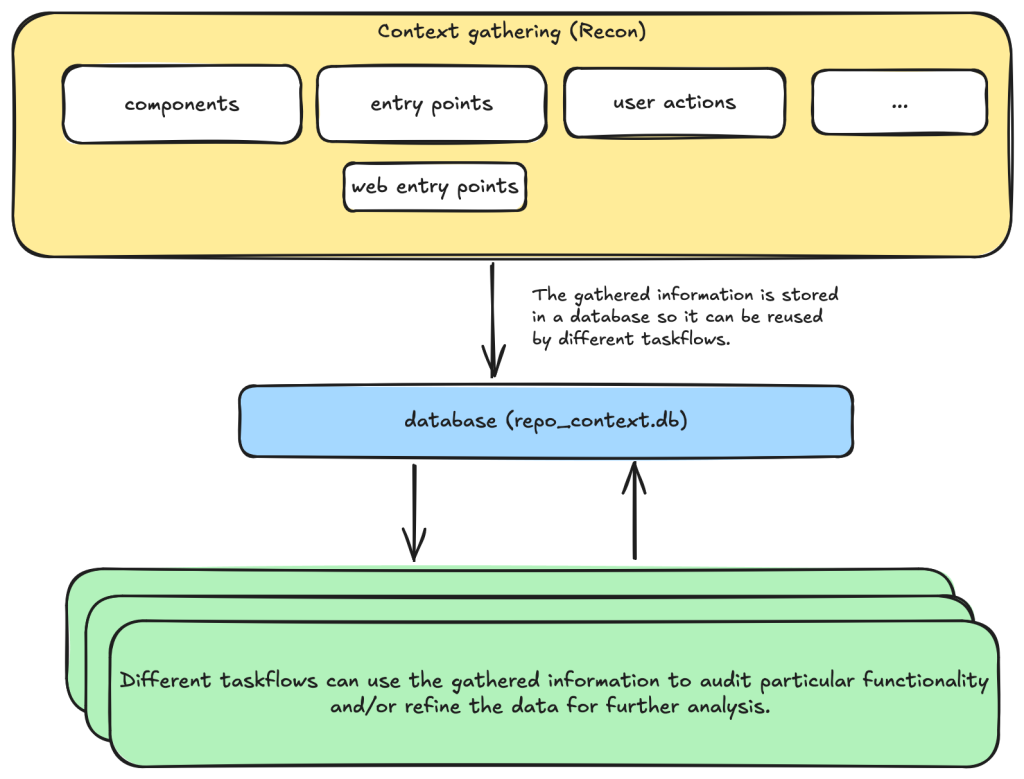
For example, when auditing a repository, we first divide the repository into different components according to their functionalities. Then, for each component, we may want to collect some information such as entry points where it takes untrusted input from, intended privilege, and purposes of the component, etc. These results are then stored in a database to provide the context for subsequent tasks. 

Based on the context data, we can then create different auditing tasks. Currently, we have a task that suggests some generic issues for each component and another task that carefully audits each suggested issue. However, it’s also possible to create other tasks, such as tasks with specific focus on a certain type of issue.

These become a list of tasks we specify in a taskflow file.

Diagram of the auditing taskflows, showing the context gathering taskflow communicating with different auditing taskflows via a database named repo_context.db.

We use tasks instead of one big prompt because LLMs have limited context windows, and complex, multi-step tasks are often not completed properly. For example, some steps can be left out. Even though some LLMs have larger context windows, we find that taskflows are still useful in providing a way for us to control and debug the tasks, as well as for accomplishing bigger and more complex projects.

The seclab-taskflow-agent can also run the same task across many components asynchronously (like a for loop). During audits, we often reuse the same prompt and task for every component, varying only the details. The seclab-taskflow-agent lets us define templated prompts, iterate through components, and substitute component-specific details as it runs.

Taskflows for general security code audits

After using seclab-taskflow-agent to triage CodeQL alerts, we decided we didn’t want to restrict ourselves to specific types of vulnerabilities and started to explore using the framework for more general security auditing. The main challenge in giving LLMs more freedom is the possibility of hallucinations and an increase in false positives. After all, the success with triaging CodeQL alerts was partly due to the fact that we gave the LLM a very strict and well-defined set of instructions and criteria, so the results could be verified at each stage to see if the instructions were followed. 

So our goal here was to find a good way to allow the LLM the freedom to look for different types of vulnerabilities while keeping hallucinations under control.

We’re going to show how we used agent taskflows to discover high-impact vulnerabilities with high true positive rate using just taskflow design and prompt engineering.

General taskflow design

To minimize hallucinations and false positives at the taskflow design level, our taskflow starts with a threat modelling stage, where a repository is divided into different components based on functionalities and various information, such as entry points, and the intended use of each component is collected. This information helps us to determine the security boundary of each component and how much exposure it has to untrusted input. 

The information collected through the threat modelling stage is then used to determine the security boundary of each component and to decide what should be considered a security issue. For example, a command injection in a CLI tool with functionality designed to execute any user input script may be a bug but not a security vulnerability, as an attacker able to inject a command using the CLI tool can already execute any script. 

At the level of prompts, the intended use and security boundary that is discovered is then used in the prompts to provide strict guidelines as to whether an issue found should be considered a vulnerability or not.

You need to take into account of the intention and threat model of the component in component notes to determine if an issue is a valid security issue or if it is an intended functionality. You can fetch entry points, web entry points and user actions to help you determine the intended usage of the component.

Asking an LLM something as vague as looking for any type of vulnerability anywhere in the code base would give poor results with many hallucinated issues. Ideally, we’d like to simulate the triage environment where we have some potential issues as the starting point of analysis and ask the LLM to apply rigorous criteria to determine whether the potential issue is valid or not.

To bootstrap this process, we break the auditing task into two steps. 

  • First, we ask the LLM to go through each component of the repository and suggest types of vulnerabilities that are more likely to appear in the component. 
  • These suggestions are then passed to another task, where they will be audited according to rigorous criteria. 

In this setup, the suggestions from the first step act as some inaccurate vulnerability alerts flagged by an “external tool,” while the second step serves as a triage step. While this may look like a self-validating process—by breaking it down into two steps, each with a fresh context and different prompts—the second step is able to provide an accurate assessment of suggestions.

We’ll now go through these tasks in detail.

Threat modeling stage

When triaging alerts flagged by automatic code scanning tools, we found that a large proportion of false positives is the result of improper threat modeling. Most static analysis tools do not take into account the intended usage and security boundary of the source code and often give results that have no security implications. For example, in a reverse proxy application, many SSRF (server-side request forgery) vulnerabilities flagged by automated tools are likely to fall within the intended use of the application, while some web services used, for example, in continuous integration pipelines are designed to execute arbitrary code and scripts within a sandboxed environment. Remote code execution vulnerabilities in these applications without a sandboxed escape are generally not considered a security risk.

Given these caveats, it pays to first go through the source code to get an understanding of the functionalities and intended purpose of code. We divide this process into the following tasks: 

  • Identify applications: A GitHub repository is an imperfect boundary for auditing: It may be a single component within a larger system or contain multiple components, so it’s worth identifying and auditing each component separately to match distinct security boundaries and keep scope manageable. We do this with the identify_applications taskflow, which asks the LLM to inspect the repository’s source code and documentation and divide it into components by functionality. 
  • Identify entry points: We identify how each entry point is exposed to untrusted inputs to better gauge risk and anticipate likely vulnerabilities. Because “untrusted input” varies significantly between libraries and applications, we provide separate guidelines for each case.
  • Identify web entry points: This is an extra step to gather further information about entry points in the application and append information that is specific to web application entry points such as noting the HTTP method and paths that are required to access a certain endpoint. 
  • Identify user actions: We have the LLM review the code and identify what functionality a user can access under normal operation. This clarifies the user’s baseline privileges, helps assess whether vulnerabilities could enable privilege gains, and informs the component’s security boundary and threat model, with separate instructions depending on whether the component is a library or an application. 

At each of the above steps, information gathered about the repository is stored in a database. This includes components in the repository, their entry points, web entry points, and intended usage. This information is then available for use in the next stage.

Issue suggestion stage

At this stage, we instruct the LLM to suggest some types of vulnerabilities, or a general area of high security risk for each component based on the information about the entry point and intended use of the component gathered from the previous step. In particular, we put emphasis on the intended usage of the component and its risk from untrusted input:

Base your decision on:
- Is this component likely to take untrusted user input? For example, remote web request or IPC, RPC calls?
- What is the intended purpose of this component and its functionality? Does it allow high privileged action?
Is it intended to provide such functionalities for all user? Or is there complex access control logic involved?
- The component itself may also have its own `README.md` (or a subdirectory of it may have a `README.md`). Take a look at those files to help understand the functionality of the component.

We also explicitly instruct the LLM to not suggest issues that are of low severity or are generally considered non-security issues.

However, you should still take care not to include issues that are of low severity or requires unrealistic attack scenario such as misconfiguration or an already compromised system.

In general, we keep this stage relatively free of restrictions and allow the LLM freedom to explore and suggest different types of vulnerabilities and potential security issues. The idea is to have a reasonable set of focus areas and vulnerability types for the actual auditing task to use as a starting point.

One problem we ran into was that the LLM would sometimes start auditing the issues that it suggested, which would defeat the purpose of the brainstorming phase. To prevent this, we instructed the LLM to not audit the issues.

Issue audit stage

This is the final stage of the taskflows. Once we’ve gathered all the information we need about the repository and have suggested some types of vulnerabilities and security risks to focus on, the taskflow goes through each suggested issue and audits them by going through the source code. At this stage, the task starts with fresh context to scrutinize the issues suggested from the previous stage. The suggestions are considered to be unvalidated, and this taskflow is instructed to verify these issues:

The issues suggested have not been properly verified and are only suggested because they are common issues in these types of application. Your task is to audit the source code to check if this type of issues is present.

To avoid the LLM coming up with issues that are non-security related in the context of the component, we once again emphasize that intended usage must be taken into consideration.

You need to take into account of the intention and threat model of the component in component notes to determine if an issue is a valid security issue or if it is an intended functionality.

To avoid the LLM hallucinating issues that are unrealistic, we also instruct it to provide a concrete and realistic attack scenario and to only consider issues that stem from errors in the source code:

Do not consider scenarios where authentication is bypassed via stolen credential etc. We only consider situations that are achievable from within the source code itself.
...
If you believe there is a vulnerability, then you must include a realistic attack scenario, with details of all the file and line included, and also what an attacker can gain by exploiting the vulnerability. Only consider the issue a vulnerability if an attacker can gain privilege by performing an action that is not intended by the component.

To further reduce hallucinations, we also instruct the LLM to provide concrete evidence from the source code, with file path and line information:

Keep a record of the audit notes, be sure to include all relevant file path and line number. Just stating an end point, e.g. `IDOR in user update/delete endpoints (PUT /user/:id)` is not sufficient. I need to have the file and line number.

Finally, we also instruct the LLM that it is possible that there is no vulnerability in the component and that it should not make things up:

Remember, the issues suggested are only speculation and there may not be a vulnerability at all and it is ok to conclude that there is no security issue.

The emphasis of this stage is to provide accurate results while following strict guidelines—and to provide concrete evidence of the findings. With all these strict instructions in place, the LLM indeed rejects many unrealistic and unexploitable suggestions with very few hallucinations. 

The first prototype was designed with hallucination prevention as a priority, which raised a question: Would it become too conservative, rejecting most vulnerability candidates and failing to surface real issues?

The answer is clear after we ran the taskflow on a few repositories.

Three examples of vulnerabilities found by the taskflows

In this section, we’ll show three examples of vulnerabilities that were found by the taskflows and that have already been disclosed. In total, we have found and reported over 80 vulnerabilities so far. We publish all disclosed vulnerabilities on our advisories page.

Privilege escalation in Outline (CVE-2025-64487)

Our information-gathering taskflows are optimized toward web applications, which is why we first pointed our audit taskflows to a collaborative web application called Outline.

Outline is a multi-user collaboration suite with properties we were especially interested in: 

  • Documents have owners and different visibility, with permissions per users and teams.
  • Access rules like that are hard to analyze with a Static Application Security Testing (SAST) tool, since they use custom access mechanisms and existing SAST tools typically don’t know what actions a normal “user” should be able to perform. 
  • Such permission schemes are often also hard to analyze for humans by only reading the source code (if you didn’t create the scheme yourself, that is).
Screenshot showing an opened document in Outline. Outline is a collaborative web application.

And success: Our taskflows found a bug in the authorization logic on the very first run!

The notes in the audit results read like this:

Audit target: Improper membership management authorization in component server (backend API) of outline/outline (component id 2).

Summary conclusion: A real privilege escalation vulnerability exists. The document group membership modification endpoints (documents.add_group, documents.remove_group) authorize with the weaker \"update\" permission instead of the stronger \"manageUsers\" permission that is required for user membership changes. Because \"update\" can be satisfied by having only a ReadWrite membership on the document, a non‑admin document collaborator can grant (or revoke) group memberships – including granting Admin permission – thereby escalating their own privileges (if they are in the added group) and those of other group members. This allows actions (manageUsers, archive, delete, etc.) that were not intended for a mere ReadWrite collaborator.

Reading the TypeScript-based source code and verifying this finding on a test instance revealed that it was exploitable exactly as described. In addition, the described steps to exploit this vulnerability were on point:

Prerequisites:
- Attacker is a normal team member (not admin), not a guest, with direct ReadWrite membership on Document D (or via a group that grants ReadWrite) but NOT Admin.
- Attacker is a member of an existing group G in the same team (they do not need to be an admin of G; group read access is sufficient per group policy).

Steps:
1. Attacker calls POST documents.add_group (server/routes/api/documents/documents.ts lines 1875-1926) with body:
   {
     "id": "<document-D-id>",
     "groupId": "<group-G-id>",
     "permission": "admin"
   }
2. Authorization path:
   - Line 1896: authorize(user, "update", document) succeeds because attacker has ReadWrite membership (document.ts lines 96-99 allow update).
   - Line 1897: authorize(user, "read", group) succeeds for any non-guest same-team user (group.ts lines 27-33).
   No \"manageUsers\" check occurs.
3. Code creates or updates GroupMembership with permission Admin (lines 1899-1919).
4. Because attacker is a member of group G, their effective document permission (via groupMembership) now includes DocumentPermission.Admin.
5. With Admin membership, attacker now satisfies includesMembership(Admin) used in:
   - manageUsers (document.ts lines 123-134) enabling adding/removing arbitrary users via documents.add_user / documents.remove_user (lines 1747-1827, 1830-1872).
   - archive/unarchive/delete (document.ts archive policy lines 241-252; delete lines 198-208) enabling content integrity impact.
   - duplicate, move, other admin-like abilities (e.g., duplicate policy lines 136-153; move lines 155-170) beyond original ReadWrite scope.

Using these instructions, a low-privileged user could add arbitrary groups to a document that the user was only allowed to update (the user not being in the possession of the “manageUsers” permission that was typically required for such changes).

In this sample, the group “Support” was added to the document by the low-privileged user named “gg.”

A screenshot of the share/document permissions functionality in Outline. The group “Support” was added by the “gg@test.test” user without having enough permissions for that action.

The Outline project fixed this and another issue we reported within three days! (Repo advisory)

The shopping cartocalypse (CVE-2025-15033, CVE-2026-25758)

We didn’t realize what systematic issues we’d uncover in the cart logic of ecommerce applications until we pointed our taskflows at the first online shop in our list. In the PHP-based WooCommerce project, the taskflows promptly found a way for normally signed-in shop users to view all guest orders—including personally identifiable information (including names, addresses, and phone numbers). After we reported this, Automattic (the company behind WooCommerce) quickly released an update (CVE-2025-15033) and accompanying blog post.

Intrigued by that vulnerability, we’ve added additional ecommerce applications to our list of applications to be audited by our agent. And sure enough, we found more vulnerabilities. The popular Ruby-based Spree commerce application contained two similar vulnerabilities (CVE-2026-25758 and CVE-2026-25757). The more critical one allowed unauthenticated users to simply enumerate the addresses (and phone numbers) of all guest orders by more or less incrementing a sequential number.

In this screenshot, the attacker “test66” linked their session to an existing address of a guest user, thus being able to view the full address and phone number.

An unauthenticated guest user revealing addresses of other guest users by enumerating through them.

Our bug-hunting spree didn’t stop with Spree. Our taskflows uncovered similar issues in two additional ecommerce applications.

These authorization logic bugs had been undiscovered for years.

Signing in to Rocket.Chat using any password (CVE-2026-28514)

(This is not what passwordless authentication should look like!)

Every so often you can’t believe your eyes. This finding reported by our taskflows in Rocket.Chat was one of those moments.

When your agent comes back with a note like this:

VULNERABILITY: password authentication bypass in account-service allows logging in as any user with a password set.

You might find it hard to believe at first.

When you then continue reading the output:

Root cause:
- ee/apps/account-service/src/lib/utils.ts:60-61: `validatePassword` returns `Promise<boolean>` (bcrypt.compare(...)).
- ee/apps/account-service/src/lib/loginViaUsername.ts:18-21: `const valid = user.services?.password?.bcrypt && validatePassword(password, user.services.password.bcrypt);` but does NOT `await` the Promise; since a Promise is truthy, `if (!valid) return false;` is never triggered when bcrypt hash exists.
- ee/apps/account-service/src/lib/loginViaUsername.ts:23-35: proceeds to mint a new login token and saves it, returning `{ uid, token, hashedToken, tokenExpires }`.

It might make more sense, but you’re still not convinced.

It turns out the suspected finding is in the micro-services based setup of Rocket.Chat. In that particular setup, Rocket.Chat exposes its user account service via its DDP Streamer service.

Rocket.Chat’s microservices deployment Copyright Rocket.Chat.
Rocket.Chat’s microservices deployment Copyright Rocket.Chat. (This architecture diagram is from Rocket.Chat’s documentation.)

Once our Rocket.Chat test setup was working properly, we had to write proof of concept code to exploit this potential vulnerability. The notes of the agent already contained the JSON construct that we could use to connect to the endpoint using Meteor’s DDP protocol.

We connected to the WebSocket endpoint for the DDP streamer service, and yes: It was truly possible to login into the exposed Rocket.Chat DDP service using any password. Once signed in, it was also possible to perform other operations such as connecting to arbitrary chat channels and listening on them for messages sent to those channels.

Here we received the message “HELLO WORLD!!!” while listening on the “General” channel.

The proof of concept code connected to the DDP streamer endpoint received “HELLO WORLD!!!” in the general channel.

The technical details of this issue are interesting (and scary as well). Rocket.Chat, primarily a TypeScript-based web application, uses bcrypt to store local user passwords. The bcrypt.compare function (used to compare a password against its stored hash) returns a Promise—a fact that is reflected in Rocket.Chat’s own validatePassword function, which returns Promise<boolean>:

export const validatePassword = (password: string, bcryptPassword: string): Promise<boolean> =>
    bcrypt.compare(getPassword(password), bcryptPassword);

However, when that function was used, the value of the Promise was not settled (e.g. by adding an await keyword in front of validatePassword):

const valid = user.services?.password?.bcrypt && validatePassword(password, user.services.password.bcrypt);

if (!valid) {
    return false;
}

This led to the result of validatePassword being ANDed with true. Since a returned Promise is always “truthy” speaking in JavaScript terms, the boolean valid subsequently was always true when a user had a bcrypt password set.

Severity aside, it’s fascinating that the LLM was able to pick up this rather subtle bug, follow it through multiple files, and arrive at the correct conclusion.

What we learned

After running the taskflows over 40 repositories—mostly multi-user web applications—the LLM suggested 1,003 issues (potential vulnerabilities). 

After the audit stage, 139 were marked as having vulnerabilities, meaning that the LLM decided they were exploitable After deduplicating the issues—duplicates happen because each repository is run a couple of times on average and the results are aggregated—we end up with 91 vulnerabilities, which we decided to manually inspect before reporting.

  • We rejected 20 (22%) results as FP: False Positives that we couldn’t reproduce manually.
  • We rejected 52 (57%) results as low severity: Issues that have very limited potential impact (e.g., blind SSRF with only a HTTP status code returned, issues that require malicious admin during installation stage, etc.).
  • We kept only 19 (21%) results that we considered vulnerabilities impactful enough to report, all serious vulnerabilities with the majority having a high or critical severity (e.g., vulnerabilities that can be triggered without specific requirements with impact to confidentiality or integrity, such as disclosure of personal data, overwriting of system settings, account takeover, etc.). 

This data was collected using gpt-5.x as the model for code analysis and audit tasks.

Note that we have run the taskflows on more repositories since this data was collected, so this table does not represent all the data we’ve collected and all vulnerabilities we’ve reported.

Issue categoryAllHas vulnerabilityVulnerability rate
IDOR/Access control issue2413815.8%
XSS1311713.0%
CSRF1101715.5%
Authentication issue911516.5%
Security misconfiguration751317.3%
Path traversal611016.4%
SSRF45715.6%
Command injection39512.8%
Remote code execution2414.2%
Business logic issue24625.0%
Template injection2414.2%
File upload handling issues (excludes path traversal)18211.1%
Insecure deserialization1700.0%
Open redirect1600.0%
SQL injection900.0%
Sensitive data exposure800.0%
XXE400.0%
Memory safety300.0%
Others 66710.6%

If we divide the findings into two rough categories—logical issues (IDOR, authentication, security misconfiguration, business logic issues, sensitive data exposure) and technical issues (XSS, CSRF, path traversal, SSRF, command injection, remote code execution, template injection, file upload issues, insecure deserialization, open redirect, SQL injection, XXE, memory safety)—we get 439 logical issues and 501 technical issues. Although more technical issues were suggested, the difference isn’t significant because some broad categories (such as remote code execution and file upload issues) can also involve logical issues depending on the attacker scenario.

There are only three suggested issues that concern memory safety. This isn’t too surprising, given the majority of the repositories tested are written in memory-safe languages. But we also suspect that the current taskflows may not be very efficient in finding memory-safety issues, especially when comparing to other automated tools such as fuzzers. This is an interesting area that can be improved by creating more specific taskflows and making more tools, like fuzzers, available to the LLM.

This data led us to the following observations.

LLMs are particularly good at finding logic bugs

What stands out from the data is the 25% rate of “Business logic issue” and the large amount of IDOR issues. In fact, the total number of IDOR issues flagged as vulnerable is more than the next two categories combined (XSS and CSRF). Overall, we get the impression that the LLM does an excellent job of understanding the code space and following the control flow, while taking into account the access control model and intended usage of the application, which is more or less what we’d expect from LLMs that excel in tasks like code reviews. This also makes it great for finding logic bugs that are difficult to find with traditional tools.

LLMs are good at rejecting low-severity issues and false positives

Curiously, none of the false positives are what we’d consider to be hallucinations. All the reports, including the false positives, have sound evidence backing them up, and we were able to follow through the report to locate the endpoints and apply the suggested payload. Many of the false positives are due to more complex circumstances beyond what is available in the code, such as browser mitigations for XSS issues mentioned above or what we would consider as genuine mistakes that a human auditor is also likely to make. For example, when multiple layers of authentications are in place, the LLM could sometimes miss out some of the checks, resulting in false positives.

We have since tested more repositories with more vulnerabilities reported, but the ratio between vulnerabilities and repositories remains roughly the same.

To demonstrate the extensibility of taskflows and how extra information can be incorporated into the taskflows, we created a new taskflow to run after the audit stage, which incorporates our new-found knowledge to filter out low-severity vulnerabilities. We found that the taskflow can filter out roughly 50% of the low-severity vulnerabilities with a couple of borderline vulnerabilities that we reported also getting marked as low severity. The taskflow and the prompt can be adjusted to fit the user’s own preference, but for us, we’re happy to make it more inclusive so we don’t miss out on anything impactful.

LLMs are good at threat modeling

The LLM performs well in threat modeling in general. During the experiment, we tested it on a number of applications with different threat models, such as desktop applications, multi-tenant web applications, applications that are designed to run code in sandbox environments (code injection by design), and reverse proxy applications (applications where SSRF-like behavior is intended). The taskflow is able to take into account the intended usage of these applications and make sound decisions. The taskflow struggles most with threat modelling of desktop applications, as it is often unclear whether other processes running on the user’s desktop should be considered trusted or not.

We’ve also observed some remarkable reasoning by the LLM that excludes issues with no privilege gains. For example, in one case, the LLM noticed that while there are inconsistencies in access control, the issue does not give the attacker any advantages over a manual copy and paste action:

Security impact assessment:

A user possessing only read access to a document (no update rights) can duplicate it provided they also have updateDocument rights on the destination collection. This allows creation of a new editable copy of content they could already read. This does NOT grant additional access to other documents nor bypass protections on the original; any user with read access could manually copy-paste the content into a new document they are permitted to create (creation generally allowed for non-guest, non-viewer members in ReadWrite collections per createDocument collection policy)

We’ve also seen some more sophisticated techniques that were used in the reasoning. For example, in one application that is running scripts in a sandboxed nodejs environment, the LLM suggested the following technique to escape the sandbox:

In Node’s vm, passing any outer-realm function into a contextified sandbox leaks that function’s outer-realm Function constructor through the `constructor` property. From inside the sandbox:
  const F = console.log.constructor; // outer-realm Function
  const hostProcess = F('return process')(); // host process object
  // Bypass module allowlist via host dynamic import
  const cp = await F('return import("node:child_process")')();
  const out = cp.execSync('id').toString();
  return [{ json: { out } }];

The presence of host functions (console.log, timers, require, RPC methods) is sufficient to obtain the host Function constructor and escape the sandbox. The allowlist in require-resolver is bypassed by constructing host-realm functions and using dynamic import of built-in modules (e.g., node:child_process), which does not go through the sandbox’s custom require.

While the result turns out to be a false positive due to other mitigating factors, it demonstrates the LLM’s technical knowledge.

Get involved!

The taskflows we used to find these vulnerabilities are open source and easy to run on your own project, so we hope you’ll give them a try! We also want to encourage you to write your own taskflows. The results showcased in this blog post are just small examples of what’s possible. There are other types of vulnerabilities to find, and there are other security-related problems, like triaging SAST results or building development setups, which we think taskflows can help with. Let us know what you’re building by starting a discussion on our repo!

The post How to scan for vulnerabilities with GitHub Security Lab’s open source AI-powered framework appeared first on The GitHub Blog.

AI-supported vulnerability triage with the GitHub Security Lab Taskflow Agent

Triaging security alerts is often very repetitive because false positives are caused by patterns that are obvious to a human auditor but difficult to encode as a formal code pattern. But large language models (LLMs) excel at matching the fuzzy patterns that traditional tools struggle with, so we at the GitHub Security Lab have been experimenting with using them to triage alerts. We are using our recently announced GitHub Security Lab Taskflow Agent AI framework to do this and are finding it to be very effective.

💡 Learn more about it and see how to activate the agent in our previous blog post.

In this blog post, we’ll introduce these triage taskflows, showcase results, and  share tips on how you can develop your own—for triage or other security research workflows. 

By using the taskflows described in this post, we quickly triaged a large number of code scanning alerts and discovered many (~30) real-world vulnerabilities since August, many of which have already been fixed and published. When triaging the alerts, the LLMs were only given tools to perform basic file fetching and searching. We have not used any static or dynamic code analysis tools other than to generate alerts from CodeQL.

While this blog post showcases how we used LLM taskflows to triage CodeQL queries, the general process creates automation using LLMs and taskflows. Your process will be a good candidate for this if:

  1. You have a task that involves many repetitive steps, and each one has a clear and well-defined goal.
  2. Some of those steps involve looking for logic or semantics in code that are not easy for conventional programming to identify, but are fairly easy for a human auditor to identify. Trying to identify them often results in many monkey patching heuristics, badly written regexp, etc. (These are potential sweet spots for LLM automation!)

If your project meets those criteria, then you can create taskflows to automate these sweet spots using LLMs, and use MCP servers to perform tasks that are well suited for conventional programming.

Both the seclab-taskflow-agent and seclab-taskflows repos are open source, allowing anyone to develop LLM taskflows to perform similar tasks. At the end of this blog post, we’ll also give some development tips that we’ve found useful.

Introduction to taskflows

Taskflows are YAML files that describe a series of tasks that we want to do with an LLM. In this way, we can write prompts to complete different tasks and have tasks that depend on each other. The seclab-taskflow-agent framework takes care of running the tasks one after another and passing the results from one task to the next.

For example, when auditing CodeQL alert results, we first want to fetch the code scanning results. Then, for each result, we may have a list of tasks that we need to check. For example, we may want to check if an alert can be reached by an untrusted attacker and whether there are authentication checks in place. These become a list of tasks we specify in a taskflow file.

Simplified depiction of taskflow with three tasks in order: fetch code scanning results, audit each result, create issues containing verdict.

We use tasks instead of one big prompt because LLMs have limited context windows, and complex, multi-step tasks often are not completed properly. Some steps are frequently left out, so having a taskflow to organize the task avoids these problems. Even with LLMs that have larger context windows, we find that taskflows are useful to provide a way for us to control and debug the task, as well as to accomplish bigger and more complex tasks.

The seclab-taskflow-agent can also perform a batch “for loop”-style task asynchronously. When we audit alerts, we often want to apply the same prompts and tasks to every alert, but with different alert details. The seclab-taskflow-agent allows us to create templated prompts to iterate through the alerts and replace the details specific to each alert when running the task.

Triaging taskflows from a code scanning alert to a report

The GitHub Security Lab periodically runs a set of CodeQL queries against a selected set of open source repositories. The process of triaging these alerts is usually fairly repetitive, and for some alerts, the causes of false positives are usually fairly similar and can be spotted easily. 

For example, when triaging alerts for GitHub Actions, false positives often result from some checks that have been put in place to make sure that only repo maintainers can trigger a vulnerable workflow, or that the vulnerable workflow is disabled in the configuration. These access control checks come in many different forms without an easily identifiable code pattern to match and are thus very difficult for a static analyzer like CodeQL to detect. However, a human auditor with general knowledge of code semantics can often identify them easily, so we expect an LLM to be able to identify these access control checks and remove false positives.

Over the course of a couple of months, we’ve tested our taskflows with a few CodeQL rules using mostly Claude Sonnet 3.5. We have identified a number of real, exploitable vulnerabilities. The taskflows do not perform an “end-to-end” analysis, but rather produce a bug report with all the details and conclusions so that we can quickly verify the results. We did not instruct the LLM to validate the results by creating an exploit nor provide any runtime environment for it to test its conclusion. The results, however, remain fairly accurate even without an automated validation step and we were able to remove false positives in the CodeQL queries quickly.

The rules are chosen based on our own experience of triaging these types of alerts and whether the list of tasks can be formulated into clearly defined instructions for LLMs to consume. 

General taskflow design

Taskflows generally consist of tasks that are divided into a few different stages. In the first stage, the tasks collect various bits of information relevant to the alert. This information is then passed to an auditing stage, where the LLM looks for common causes of false positives from our own experience of triaging alerts. After the auditing stage, a bug report is generated using the information gathered. In the actual taskflows, the information gathering and audit stage are sometimes combined into a single task, or they may be separate tasks, depending on how complex the task is.

To ensure that the generated report has sufficient information for a human auditor to make a decision, an extra step checks that the report has the correct formatting and contains the correct information. After that, a GitHub Issue is created, ready to be reviewed. 

Creating a GitHub Issue not only makes it easy for us to review the results, but also provides a way to extend the analysis. After reviewing and checking the issues, we often find that there are causes for false positives that we missed during the auditing process. Also, if the agent determines that the alert is valid, but the human reviewer disagrees and finds that it’s a false positive for a reason that was unknown to the agent so far, the human reviewer can document this as an alert dismissal reason or issue comment. When the agent analyzes similar cases in the future, it will be aware of all the past analysis stored in those issues and alert dismissal reasons, incorporate this new intelligence in its knowledge base, and be more effective at detecting false positives.

Information collection

During this stage, we instruct the LLM (examples are provided in the Triage examples section below) to collect relevant information about the alert, which takes into account the threat model and human knowledge of the alert in general. For example, in the case of GitHub Actions alerts, it will look at what permissions are set in the GitHub workflow file, what are the events that trigger the GitHub workflow, whether the workflow is disabled, etc. These generally involve independent tasks that follow simple, well-defined instructions to ensure the information collected is consistent. For example, checking whether a GitHub workflow is disabled involves making a GitHub API call via an MCP server.

To ensure that the information collected is accurate and to reduce hallucination, we instruct the LLM to include precise references to the source code that includes both file and line number to back up the information it collected:

You should include the line number where the untrusted code is invoked, as well as the untrusted code or package manager that is invoked in the notes.

Each task then stores the information it collected in audit notes, which are kind of a running commentary of an alert. Once the task is completed, the notes are serialized to a database which the next task can then append their notes to when it is done. 

Two tasks in order displaying which notes are added to the general notes in each step. With the step trigger analysis the notes added are triggers, permissions and secrets among others. The second task “audit injection point” potentially adds notes such as sanitizers and to the notes.

In general, each of the information gathering tasks is independent of each other and does not need to read each other’s notes. This helps each task to focus on its own scope without being distracted by previously collected information.

The end result is a “bag of information” in the form of notes associated with an alert that is then passed to the auditing tasks.

Audit issue

At this stage, the LLM goes through the information gathered and performs a list of specific checks to reject alert results that turned out to be false positives. For example, when triaging a GitHub Actions alert, we may have collected information about the events that trigger the vulnerable workflow. In the audit stage, we’ll check if these events can be triggered by an attacker or if they run in a privileged context. After this stage, a lot of the false positives that are obvious to a human auditor will be removed.

Decision-making and report generation

For alerts that have made it through the auditing stage, the next step is to create a bug report using the information gathered, as well as the reasoning for the decision at the audit stage. Again, in our prompt, we are being very precise about the format of the report and what information we need. In particular, we want it to be concise but also include information that makes it easy for us to verify the results, with precise code references and code blocks.

The report generated uses the information gathered from the notes in previous stages and only looks at the source code to fetch code snippets that are needed in the report. No further analysis is done at this stage. Again, the very strict and precise nature of the tasks reduces the amount of hallucination.

Report validation and issue creation

After the report is written, we instruct the LLM to check the report to ensure that all the relevant information is contained in the report, as well as the consistency of the information:

Check that the report contains all the necessary information:
- This criteria only applies if the workflow containing the alert is a reusable action AND has no high privileged trigger. 
You should check it with the relevant tools in the gh_actions toolbox.
If that's not the case, ignore this criteria.
In this case, check that the report contains a section that lists the vulnerable action users. 
If there isn't any vulnerable action users and there is no high privileged trigger, then mark the alert as invalid and using the alert_id and repo, then remove the memcache entry with the key {{ RESULT_key }}.

Missing or inconsistent information often indicates hallucinations or other causes of false positives (for example, not being able to track down an attacker controlled input). In either case, we dismiss the report.

If the report contains all the information and is consistent, then we open a GitHub Issue to track the alert.

Issue review and repo-specific knowledge

The GitHub Issue created in the previous step contains all the information needed to verify the issue, with code snippets and references to lines and files. This provides a kind of “checkpoint” and a summary of the information that we have, so that we can easily extend the analysis.

In fact, after creating the issue, we often find that there are repo-specific permission checks or sanitizers that render the issue a false positive. We are able to incorporate these problems by creating taskflows that review these issues with repo-specific knowledge added in the prompts. One approach that we’ve experimented with is to collect dismissal reasons for alerts in a repo and instruct the LLM to take into account these dismissal reasons and review the GitHub issue. This allows us to remove false positives due to reasons specific to a repo. 

Image showing LLM output that dismisses an alert.

In this case, the LLM is able to identify the alert as false positive after taking into account a custom check-run permission check that was recorded in the alert dismissal reasons.

Triage examples and results

In this section we’ll give some examples of what these taskflows look like in practice. In particular, we’ll show taskflows for triaging some GitHub actions and JavaScript alerts.

GitHub Actions alerts

The specific actions alerts that we triaged are checkout of untrusted code in a privileged context and code injection

The triaging of these queries shares a lot of similarities. For example, both involve checking the workflow triggering events, permissions of the vulnerable workflow, and tracking workflow callers. In fact, the main differences involve local analysis of specific details of the vulnerabilities. For code injection, this involves whether the injected code has been sanitized, how the expression is evaluated and whether the input is truly arbitrary (for example, pull request ID is unlikely to cause code injection issue). For untrusted checkout, this involves whether there is a valid code execution point after the checkout.

Since many elements in these taskflows are the same, we’ll use the code injection triage taskflow as an example. Note that because these taskflows have a lot in common, we made heavy use of reusable features in the seclab-taskflow-agent, such as prompts and reusable tasks.

When manually triaging GitHub Actions alerts for these rules, we commonly run into false positives because of:

  1. Vulnerable workflow doesn’t run in a privileged context. This is determined by the events that trigger the vulnerable workflow. For example, a workflow triggered by the pull_request_target runs in a privileged context, while a workflow triggered by the pull_request event does not. This can usually be determined by simply looking at the workflow file.
  2. Vulnerable workflow disabled explicitly in the repo. This can be checked easily by checking the workflow settings in the repo.
  3. Vulnerable workflow explicitly restricts permissions and does not use any secrets. In which case, there is little privilege to gain.
  4. Vulnerability specific issues, such as invalid user input or sanitizer in the case of code injection and the absence of a valid code execution point in the case of untrusted checkout.
  5. Vulnerable workflow is a reusable workflow but not reachable from any workflow that runs in privileged context.

Very often, triaging these alerts involves many simple but tedious checks like the ones listed above, and an alert can be determined to be a false positive very quickly by one of the above criteria. We therefore model our triage taskflows based on these criteria. 

So, our action-triage taskflows consist of the following tasks during information gathering and the auditing stage:

  • Workflow trigger analysis: This stage performs both information gathering and auditing. It first collects events that trigger the vulnerable workflow, as well as permission and secrets that are used in the vulnerable workflow. It also checks whether the vulnerable workflow is disabled in the repo. All information is local to the vulnerable workflow itself. This information is stored in running notes which are then serialized to a database entry. As the task is simple and involves only looking at the vulnerable workflow, preliminary auditing based on the workflow trigger is also performed to remove some obvious false positives. 
  • Code injection point analysis: This is another task that only analyzes the vulnerable workflow and combines information gathering and audit in a single task. This task collects information about the location of the code injection point, and the user input that is injected. It also performs local auditing to check whether a user input is a valid injection risk and whether it has a sanitizer
  • Workflow user analysis: This performs a simple caller analysis that looks for the caller of the vulnerable workflow. As it can potentially retrieve and analyze a large number of files, this step is divided into two main tasks that perform information gathering and auditing separately. In the information gathering task, callers of the vulnerable workflow are retrieved and their trigger events, permissions, use of secrets are recorded in the notes. This information is then used in the auditing task to determine whether the vulnerable workflow is reachable by an attacker.

Each of these tasks is applied to the alert and at each step, false positives are filtered out according to the criteria in the task.

After the information gathering and audit stage, our notes will generally include information such as the events that trigger the vulnerable workflow, permissions and secrets involved, and (in case of a reusable workflow) other workflows that use the vulnerable workflow as well as their trigger events, permissions, and secrets. This information will form the basis for the bug report. As a sanity check to ensure that the information collected so far is complete and consistent, the review_report task is used to check for missing or inconsistent information before a report is created. 

After that, the create_report task is used to create a bug report which will form the basis of a GitHub Issue. Before creating an issue, we double check that the report contains the necessary information and conforms to the format that we required. Missing information or inconsistencies are likely the results of some failed steps or hallucinations and we reject those cases.

The following diagram illustrates the main components of the triage_actions_code_injection taskflow:

Seven tasks of a taskflow connected in order with arrows: fetch alerts, trigger analysis, injection point analysis, workflow user analysis, review notes, create bug report and review bug report. All tasks but fetch alerts symbolize how they either iterate over alerts or alert notes.

We then create GitHub Issues using the create_issue_actions taskflow. As mentioned before, the GitHub Issues created contain sufficient information and code references to verify the vulnerability quickly, as well as serving as a summary for the analysis so far, allowing us to continue further analysis using the issue. The following shows an example of an issue that is created:

Image showing an issue created by the LLM.

In particular, we can use GitHub Issues and alert dismissal reasons as a means to incorporate repo-specific security measures and to further the analysis. To do so, we use the review_actions_injection_issues taskflow to first collect alert dismissal reasons from the repo. These dismissal reasons are then checked against the alert stated in the GitHub Issue. In this case, we simply use the issue as the starting point and instruct the LLM to audit the issue and check whether any of the alert dismissal reasons applies to the current issue. Since the issue contains all the relevant information and code references for the alert, the LLM is able to use the issue and the alert dismissal reasons to further the analysis and discover more false positives. The following shows an alert that is rejected based on the dismissal reasons:

Image showing LLM output of reasons to reject an alert after taking into account of the dismissal reasons.

The following diagram illustrates the main components of the issue creation and review taskflows:

Five tasks separated in two swim lanes: the first swim lane named “create action issues” depicts tasks that are used for the issue creation taskflow starting with dismissing false positives and continuing with the tasks for issue creation for true and false positives. The second swim lane is titled “review action issues” and contains the tasks “collect alert dismissal reasons” and “review issues based on dismissal reasons.

JavaScript alerts

Similarly to triaging action alerts, we also triaged code scanning alerts for the JavaScript/TypeScript languages to a lesser extent. In the JavaScript world, we triaged code scanning alerts for the client-side cross-site-scripting CodeQL rule. (js/xss)

The client-side cross-site scripting alerts have more variety with regards to their sources, sinks, and data flows when compared to the GitHub Actions alerts.

The prompts for analyzing those XSS vulnerabilities are focused on helping the person responsible for triage make an educated decision, not making the decision for them. This is done by highlighting the aspects that seem to make a given alert exploitable by an attacker and, more importantly, what likely prevents the exploitation of a given potential issue. Other than that, the taskflows follow a similar scheme as described in the GitHub Actions alerts section.

While triaging XSS alerts manually, we’ve often identified false positives due to these reasons:

  • Custom or unrecognized sanitization functions (e.g. using regex) that the SAST-tool cannot verify.
  • Reported sources that are likely unreachable in practice (e.g., would require an attacker to send a message directly from the webserver).
  • Untrusted data flowing into potentially dangerous sinks, whose output then is only used in an non-exploitable way.
  • The SAST-tool not knowing the full context where the given untrusted data ends up.

Based on these false positives, the prompts in the relevant taskflow or even in the active personality were extended and adjusted. If you encounter certain false positives in a project, auditing it makes sense to extend the prompt so that false positives are correctly marked (and also if alerts for certain sources/sinks are not considered a vulnerability).

In the end, after executing the taskflows triage_js_ts_client_side_xss and create_issues_js_ts, the alert would result in GitHub issues such as:

A screenshot of a GitHub Issue titled 'Code scanning alert #72 triage report for js/xss,' showing two lists with reasons that make an alert and exploitable vulnerability or not.

While this is a sample for an alert worthy of following up (which turned out to be a true positive, being exploitable by using a javascript: URL), alerts that the taskflow agent decided were false positive get their issue labelled with “FP” (for false positive):

A screenshot of a GitHub Issue titled 'Code scanning alert #1694 triage report for js/xss.' While it would show factors that make an alert exploitable it shows none, because the taskflow identified none. However, the issue shows a list of 7 items describing why the vulnerability is not exploitable.

Taskflows development tips

In this section we share some of our experiences when working on these taskflows, and what we think are useful in the development of taskflows. We hope that these will help others create their own taskflows.

Use of database to store intermediate state

While developing a taskflow with multiple tasks, we sometimes encounter problems in tasks that run at a later stage. These can be simple software problems, such as API call failures, MCP server bugs, prompt-related problems, token problems, or quota problems.

By keeping tasks small and storing results of each task in a database, we avoided rerunning lengthy tasks when failure happens. When a task in a taskflow fails, we simply rerun the taskflow from the failed task and reuse the results from earlier tasks that are stored in the database. Apart from saving us time when a task failed, it also helped us to isolate effects of each task and tweak each task using the database created from the previous task as a starting point.

Breaking down complex tasks into smaller tasks

When we were developing the triage taskflows, the models that we used did not handle large context and complex tasks very well. When trying to perform complex and multiple tasks within the same context, we often ran into problems such as tasks being skipped or instructions not being followed.

To counter that, we divided tasks into smaller, independent tasks. Each started with a fresh new context. This helped reduce the context window size and alleviated many of the problems that we had.

One particular example is the use of templated repeat_prompt tasks, which loop over a list of tasks and start a new context for each of them. By doing this, instead of going through a list in the same prompt, we ensured that every single task was performed, while the context of each task was kept to a minimum.

A task named “audit results” which exemplifies the “repeat prompt” feature. It depicts that by containing three boxes of the same size called 'audit result #1,' 'audit result #2,' and 'audit result n,' while between the #2 and the n box an ellipsis is displayed.

An added benefit is that we are able to tweak and debug the taskflows with more granularity. By having small tasks and storing results of each task in a database, we can easily separate out part of a taskflow and run it separately. 

Delegate to MCP server whenever possible

Initially, when checking and gathering information, such as workflow triggers, from the source code, we simply incorporated instructions in prompts because we thought the LLM should be able to gather the information from the source code. While this worked most of the time, we also noticed some inconsistencies due to the non-deterministic nature of the LLM. For example, the LLM sometimes would only record a subset of the events that trigger the workflow, or it would sometimes make inconsistent conclusions about whether the trigger runs the workflow in a privileged context or not.

Since these information and checks can easily be performed programmatically, we ended up creating tools in the MCP servers to gather the information and perform these checks. This led to a much more consistent outcome.

By moving most of the tasks that can easily be done programmatically to MCP server tools while leaving the more complex logical reasoning tasks, such as finding permission checks for the LLM, we were able to leverage the power of LLM while keeping the results consistent.

Reusable taskflow to apply tweaks across taskflows

As we were developing the triage taskflows, we realized that many tasks can be shared between different triage taskflows. To make sure that tweaks in one taskflow can be applied to the rest and to reduce the amount of copy and paste, we needed to have some ways to refactor the taskflows and extract reusable components.

We added features like reusable tasks and prompts. Using these features allowed us to reuse and apply changes consistently across different taskflows.

Configuring models across taskflows

As LLMs are constantly developing and new versions are released frequently, it soon became apparent that we need a way to update model version numbers across taskflows. So, we added the model configuration feature that allows us to change models across taskflows, which is useful when the model version needs updating or we just want to experiment and rerun the taskflows with a different model.

Closing

In this post we’ve shown how we created taskflows for the seclab-taskflow-agent to triage code scanning alerts. 

By breaking down the triage into precise and specific tasks, we were able to automate many of the more repetitive tasks using LLM. By setting out clear and precise criteria in the prompts and asking for precise answers from the LLM to include code references, the LLM was able to perform the tasks as instructed while keeping the amount of hallucination to a minimum. This allows us to leverage the power of LLM to triage alerts and reduces the amount of false positives greatly without the need to validate the alert dynamically.

As a result, we were able to discover ~30 real world vulnerabilities from CodeQL alerts after running the triaging taskflows.

The discussed taskflows are published in our repo and we’re looking forward to seeing what you’re going to build using them! More recently, we’ve also done some further experiments in the area of AI assisted code auditing and vulnerability hunting, so stay tuned for what’s to come!


Disclaimers: 

  1. When we use these taskflows to report vulnerabilities, our researchers review carefully all generated output before sending the report. We strongly recommend you do the same. 
  2. Note that running the taskflows can result in many tool calls, which can easily consume a large amount of quota
  3. The taskflows may create GitHub Issues. Please be considerate and seek the repo owner’s consent before running them on somebody else’s repo.

The post AI-supported vulnerability triage with the GitHub Security Lab Taskflow Agent appeared first on The GitHub Blog.

  • ✇GitHub Security Lab Archives - The GitHub Blog
  • Bypassing MTE with CVE-2025-0072 Man Yue Mo
    Memory Tagging Extension (MTE) is an advanced memory safety feature that is intended to make memory corruption vulnerabilities almost impossible to exploit. But no mitigation is ever completely airtight—especially in kernel code that manipulates memory at a low level. Last year, I wrote about CVE-2023-6241, a vulnerability in ARM’s Mali GPU driver, which enabled an untrusted Android app to bypass MTE and gain arbitrary kernel code execution. In this post, I’ll walk through CVE-2025-0072: a n
     

Bypassing MTE with CVE-2025-0072

Memory Tagging Extension (MTE) is an advanced memory safety feature that is intended to make memory corruption vulnerabilities almost impossible to exploit. But no mitigation is ever completely airtight—especially in kernel code that manipulates memory at a low level.

Last year, I wrote about CVE-2023-6241, a vulnerability in ARM’s Mali GPU driver, which enabled an untrusted Android app to bypass MTE and gain arbitrary kernel code execution. In this post, I’ll walk through CVE-2025-0072: a newly patched vulnerability that I also found in ARM’s Mali GPU driver. Like the previous one, it enables a malicious Android app to bypass MTE and gain arbitrary kernel code execution.

I reported the issue to Arm on December 12, 2024. It was fixed in Mali driver version r54p0, released publicly on May 2, 2025, and included in Android’s May 2025 security update. The vulnerability affects devices with newer Arm Mali GPUs that use the Command Stream Frontend (CSF) architecture, such as Google’s Pixel 7, 8, and 9 series. I developed and tested the exploit on a Pixel 8 with kernel MTE enabled, and I believe it should work on the 7 and 9 as well with minor modifications.

What follows is a deep dive into how CSF queues work, the steps I used to exploit this bug, and how it ultimately bypasses MTE protections to achieve kernel code execution.

How CSF queues work—and how they become dangerous

Arm Mali GPUs with the CSF feature communicate with userland applications through command queues, implemented in the driver as kbase_queue objects. The queues are created by using the KBASE_IOCTL_CS_QUEUE_REGISTER ioctl. To use the kbase_queue that is created, it first has to be bound to a kbase_queue_group, which is created with the KBASE_IOCTL_CS_QUEUE_GROUP_CREATE ioctl. A kbase_queue can be bound to a kbase_queue_group with the KBASE_IOCTL_CS_QUEUE_BIND ioctl. When binding a kbase_queue to a kbase_queue_group, a handle is created from get_user_pages_mmap_handle and returned to the user application.

int kbase_csf_queue_bind(struct kbase_context *kctx, union kbase_ioctl_cs_queue_bind *bind)
{
            ...
	group = find_queue_group(kctx, bind->in.group_handle);
	queue = find_queue(kctx, bind->in.buffer_gpu_addr);
            …
	ret = get_user_pages_mmap_handle(kctx, queue);
	if (ret)
		goto out;
	bind->out.mmap_handle = queue->handle;
	group->bound_queues[bind->in.csi_index] = queue;
	queue->group = group;
	queue->group_priority = group->priority;
	queue->csi_index = (s8)bind->in.csi_index;
	queue->bind_state = KBASE_CSF_QUEUE_BIND_IN_PROGRESS;

out:
	rt_mutex_unlock(&kctx->csf.lock);

	return ret;
}

In addition, mutual references are stored between the kbase_queue_group and the queue. Note that when the call finishes, queue->bind_state is set to KBASE_CSF_QUEUE_BIND_IN_PROGRESS, indicating that the binding is not completed. To complete the binding, the user application must call mmap with the handle returned from the ioctl as the file offset. This mmap call is handled by kbase_csf_cpu_mmap_user_io_pages, which allocates GPU memory via kbase_csf_alloc_command_stream_user_pages and maps it to user space.

int kbase_csf_alloc_command_stream_user_pages(struct kbase_context *kctx, struct kbase_queue *queue)
{
	struct kbase_device *kbdev = kctx->kbdev;
	int ret;

	lockdep_assert_held(&kctx->csf.lock);

	ret = kbase_mem_pool_alloc_pages(&kctx->mem_pools.small[KBASE_MEM_GROUP_CSF_IO],
					 KBASEP_NUM_CS_USER_IO_PAGES, queue->phys, false,                 //<------ 1.
					 kctx->task);
  ...
	ret = kernel_map_user_io_pages(kctx, queue);
  ...
	get_queue(queue);
	queue->bind_state = KBASE_CSF_QUEUE_BOUND;
	mutex_unlock(&kbdev->csf.reg_lock);

	return 0;
  ...
}

In 1. in the above snippet, kbase_mem_pool_alloc_pages is called to allocate memory pages from the GPU memory pool, whose addresses are then stored in the queue->phys field. These pages are then mapped to user space and the bind_state of the queue is set to KBASE_CSF_QUEUE_BOUND. These pages are only freed when the mmapped area is unmapped from the user space. In that case, kbase_csf_free_command_stream_user_pages is called to free the pages via kbase_mem_pool_free_pages.

void kbase_csf_free_command_stream_user_pages(struct kbase_context *kctx, struct kbase_queue *queue)
{
	kernel_unmap_user_io_pages(kctx, queue);

	kbase_mem_pool_free_pages(&kctx->mem_pools.small[KBASE_MEM_GROUP_CSF_IO],
				  KBASEP_NUM_CS_USER_IO_PAGES, queue->phys, true, false);
  ...
}

This frees the pages stored in queue->phys, and because this only happens when the pages are unmapped from user space, it prevents the pages from being accessed after they are freed.

An exploit idea

The interesting part begins when we ask: what happens if we can modify queue->phys after mapping them into user space. For example, if I can trigger kbase_csf_alloc_command_user_pages again to overwrite new pages to queue->phys, and map them to user space and then unmap the previously mapped region, kbase_csf_free_command_stream_user_pages will be called to free the pages in queue->phys. However, because queue->phys is now overwritten by the newly allocated pages, I ended up in a situation where I free the new pages while unmapping an old region:

A diagram demonstrating how to free the new pages while unmapping an old region.

In the above figure, the right columns are mappings in the user space, green rectangles are mapped, while gray ones are unmapped. The left column are backing pages stored in queue->phys. The new queue->phys are pages that are currently stored in queue->phys, while old queue->phys are pages that are stored previously but are replaced by the new ones. Green indicates that the pages are alive, while red indicates that they are freed. After overwriting queue->phys and unmapping the old region, the new queue->phys are freed instead, while still mapped to the new user region. This means that user space will have access to the freed new queue->phys pages. This then gives me a page use-after-free vulnerability.

The vulnerability

So let’s take a look at how to achieve this situation. The first obvious thing to try is to see if I can bind a kbase_queue multiple times using the KBASE_IOCTL_CS_QUEUE_BIND ioctl. This, however, is not possible because the queue->group field is checked before binding:

int kbase_csf_queue_bind(struct kbase_context *kctx, union kbase_ioctl_cs_queue_bind *bind)
{
  ...
	if (queue->group || group->bound_queues[bind->in.csi_index])
		goto out;
  ...
}

After a kbase_queue is bound, its queue->group is set to the kbase_queue_group that it binds to, which prevents the kbase_queue from binding again. Moreover, once a kbase_queue is bound, it cannot be unbound via any ioctl. It can be terminated with KBASE_IOCTL_CS_QUEUE_TERMINATE, but that will also delete the kbase_queue. So if rebinding from the queue is not possible, what about trying to unbind from a kbase_queue_group? For example, what happens if a kbase_queue_group gets terminated with the KBASE_IOCTL_CS_QUEUE_GROUP_TERMINATE ioctl? When a kbase_queue_group terminates, as part of the clean up process, it calls kbase_csf_term_descheduled_queue_group to unbind queues that it bound to:

void kbase_csf_term_descheduled_queue_group(struct kbase_queue_group *group)
{
  ...
	for (i = 0; i < max_streams; i++) {
		struct kbase_queue *queue = group->bound_queues[i];

		/* The group is already being evicted from the scheduler */
		if (queue)
			unbind_stopped_queue(kctx, queue);
	}
  ...
}

This then resets the queue->group field of the kbase_queue that gets unbound:

static void unbind_stopped_queue(struct kbase_context *kctx, struct kbase_queue *queue)
{
  ...
	if (queue->bind_state != KBASE_CSF_QUEUE_UNBOUND) {
    ...
		queue->group->bound_queues[queue->csi_index] = NULL;
		queue->group = NULL;
    ...
		queue->bind_state = KBASE_CSF_QUEUE_UNBOUND;
	}
}

In particular, this now allows the kbase_queue to bind to another kbase_queue_group. This means I can now create a page use-after-free with the following steps:

  1. Create a kbase_queue and a kbase_queue_group, and then bind the kbase_queue to the kbase_queue_group.
  2. Create GPU memory pages for the user io pages in the kbase_queue and map them to user space using a mmap call. These pages are then stored in the queue->phys field of the kbase_queue.
  3. Terminate the kbase_queue_group, which also unbinds the kbase_queue.
  4. Create another kbase_queue_group and bind the kbase_queue to this new group.
  5. Create new GPU memory pages for the user io pages in this kbase_queue and map them to user space. These pages now overwrite the existing pages in queue->phys.
  6. Unmap the user space memory that was mapped in step 2. This then frees the pages in queue->phys and removes the user space mapping created in step 2. However, the pages that are freed are now the memory pages created and mapped in step 5, which are still mapped to user space.

This, in particular, means that the pages that are freed in step 6 of the above can still be accessed from the user application. By using a technique that I used previously, I can reuse these freed pages as page table global directories (PGD) of the Mali GPU.

To recap, let’s take a look at how the backing pages of a kbase_va_region are allocated. When allocating pages for the backing store of a kbase_va_region, the kbase_mem_pool_alloc_pages function is used:

int kbase_mem_pool_alloc_pages(struct kbase_mem_pool *pool, size_t nr_4k_pages,
    struct tagged_addr *pages, bool partial_allowed)
{
    ...
  /* Get pages from this pool */
  while (nr_from_pool--) {
    p = kbase_mem_pool_remove_locked(pool);     //<------- 1.
        ...
  }
    ...
  if (i != nr_4k_pages && pool->next_pool) {
    /* Allocate via next pool */
    err = kbase_mem_pool_alloc_pages(pool->next_pool,      //<----- 2.
        nr_4k_pages - i, pages + i, partial_allowed);
        ...
  } else {
    /* Get any remaining pages from kernel */
    while (i != nr_4k_pages) {
      p = kbase_mem_alloc_page(pool);     //<------- 3.
            ...
        }
        ...
  }
    ...
}

The input argument kbase_mem_pool is a memory pool managed by the kbase_context object associated with the driver file that is used to allocate the GPU memory. As the comments suggest, the allocation is actually done in tiers. First the pages will be allocated from the current kbase_mem_pool using kbase_mem_pool_remove_locked (1 in the above). If there is not enough capacity in the current kbase_mem_pool to meet the request, then pool->next_pool, is used to allocate the pages (2 in the above). If even pool->next_pool does not have the capacity, then kbase_mem_alloc_page is used to allocate pages directly from the kernel via the buddy allocator (the page allocator in the kernel).

When freeing a page, the same happens in the opposite direction: kbase_mem_pool_free_pages first tries to return the pages to the kbase_mem_pool of the current kbase_context, if the memory pool is full, it’ll try to return the remaining pages to pool->next_pool. If the next pool is also full, then the remaining pages are returned to the kernel by freeing them via the buddy allocator.

As noted in my post “Corrupting memory without memory corruption”, pool->next_pool is a memory pool managed by the Mali driver and shared by all the kbase_context. It is also used for allocating page table global directories (PGD) used by GPU contexts. In particular, this means that by carefully arranging the memory pools, it is possible to cause a freed backing page in a kbase_va_region to be reused as a PGD of a GPU context. (Read the details of how to achieve this.)

Once the freed page is reused as a PGD of a GPU context, the user space mapping can be used to rewrite the PGD from the GPU. This then allows any kernel memory, including kernel code, to be mapped to the GPU, which allows me to rewrite kernel code and hence execute arbitrary kernel code. It also allows me to read and write arbitrary kernel data, so I can easily rewrite credentials of my process to gain root, as well as to disable SELinux.

See the exploit for Pixel 8 with some setup notes.

How does this bypass MTE?

Before wrapping up, let’s look at why this exploit manages to bypass Memory Tagging Extension (MTE)—despite protections that should have made this type of attack impossible.

The Memory Tagging Extension (MTE) is a security feature on newer Arm processors that uses hardware implementations to check for memory corruptions.

The Arm64 architecture uses 64 bit pointers to access memory, while most applications use a much smaller address space (for example, 39, 48, or 52 bits). The highest bits in a 64 bit pointer are actually unused. The main idea of memory tagging is to use these higher bits in an address to store a “tag” that can then be used to check against the other tag stored in the memory block associated with the address.

When a linear overflow happens and a pointer is used to dereference an adjacent memory block, the tag on the pointer is likely to be different from the tag in the adjacent memory block. By checking these tags at dereference time, such discrepancy, and hence the corrupted dereference can be detected. For use-after-free type memory corruptions, as long as the tag in a memory block is cleared every time it is freed and a new tag reassigned when it is allocated, dereferencing an already freed and reclaimed object will also lead to a discrepancy between pointer tag and the tag in memory, which allows use-after-free to be detected.

A diagram demonstrating how, by checking the tags on the pointer and the adjacent memory blocks at dereference time, the corrupted dereference can be detected.
Image from Memory Tagging Extension: Enhancing memory safety through architecture published by Arm

The memory tagging extension is an instruction set introduced in the v8.5a version of the ARM architecture, which accelerates the process of tagging and checking of memory with the hardware. This makes it feasible to use memory tagging in practical applications. On architectures where hardware accelerated instructions are available, software support in the memory allocator is still needed to invoke the memory tagging instructions. In the linux kernel, the SLUB allocator, used for allocating kernel objects, and the buddy allocator, used for allocating memory pages, have support for memory tagging.

Readers who are interested in more details can, for example, consult this article and the whitepaper released by Arm.

As I mentioned in the introduction, this exploit is capable of bypassing MTE. However, unlike a previous vulnerability that I reported, where a freed memory page is accessed via the GPU, this bug accesses the freed memory page via user space mapping. Since page allocation and dereferencing is protected by MTE, it is perhaps somewhat surprising that this bug manages to bypass MTE. Initially, I thought this was because the memory page that is involved in the vulnerability is managed by kbase_mem_pool, which is a custom memory pool used by the Mali GPU driver. In the exploit, the freed memory page that is reused as the PGD is simply returned to the memory pool managed by kbase_mem_pool, and then allocated again from the memory pool. So the page was never truly freed by the buddy allocator and therefore not protected by MTE. While this is true, I decided to also try freeing the page properly and return it to the buddy allocator. To my surprise, MTE did not trigger even when the page is accessed after it is freed by the buddy allocator. After some experiments and source code reading, it appears that page mappings created by mgm_vmf_insert_pfn_prot in kbase_csf_user_io_pages_vm_fault, which are used for accessing the memory page after it is freed, ultimately uses insert_pfn to create the mapping, which inserts the page frame into the user space page table. I am not totally sure, but it seems that because the page frames are inserted directly into the user space page table, accessing those pages from user space does not require kernel level dereferencing and therefore does not trigger MTE.

Conclusion

In this post I’ve shown how CVE-2025-0072 can be used to gain arbitrary kernel code execution on a Pixel 8 with kernel MTE enabled. Unlike a previous vulnerability that I reported, which bypasses MTE by accessing freed memory from the GPU, this vulnerability accesses freed memory via user space memory mapping inserted by the driver. This shows that MTE can also be bypassed when freed memory pages are accessed via memory mappings in user space, which is a much more common scenario than the previous vulnerability.

The post Bypassing MTE with CVE-2025-0072 appeared first on The GitHub Blog.

❌
❌