In the past week, the global cyber threat landscape has once again demonstrated how rapidly attackers are evolving shifting from isolated intrusions to coordinated, multi-stage campaigns targeting identities, supply chains, and service providers. From large-scale identity data exposure to sophisticated token abuse and ransomware-driven disruptions, these incidents highlight a critical reality: attackers are increasingly exploiting
The post Global Cyber Threat Brief: Identity Breaches, Supply Ch
In the past week, the global cyber threat landscape has once again demonstrated how rapidly attackers are evolving shifting from isolated intrusions to coordinated, multi-stage campaigns targeting identities, supply chains, and service providers. From large-scale identity data exposure to sophisticated token abuse and ransomware-driven disruptions, these incidents highlight a critical reality: attackers are increasingly exploiting
In today’s cyber threat landscape, attacks are no longer always loud or immediate. Many of the most damaging incidents begin quietly hidden within normal network activity, disguised as legitimate traffic, and evolving over time into full-scale compromises. Modern security requires more than just detection; it requires context, behavioral intelligence, and early intervention. This article highlights
The post Invisible Threats Within: Detecting Botnet Activity and Data Exfiltration Before It’s To
In today’s cyber threat landscape, attacks are no longer always loud or immediate. Many of the most damaging incidents begin quietly hidden within normal network activity, disguised as legitimate traffic, and evolving over time into full-scale compromises. Modern security requires more than just detection; it requires context, behavioral intelligence, and early intervention. This article highlights
The Problem: Achieving Threat Detections at Scale
At SOC Prime, we have spent over a decade making detection engineering easier for organizations of every size. Each year, as threats multiply and environments grow more complex, the traditional approach puts SOC Managers in an impossible position — responsible for coverage they cannot achieve with the tools and team they have. DetectFlow offers a path to deploying detections at scale without the engineering overhead. Here is what it solves:
Y
At SOC Prime, we have spent over a decade making detection engineering easier for organizations of every size. Each year, as threats multiply and environments grow more complex, the traditional approach puts SOC Managers in an impossible position — responsible for coverage they cannot achieve with the tools and team they have. DetectFlow offers a path to deploying detections at scale without the engineering overhead. Here is what it solves:
Your team is drowning in noise, not finding threats: False positives overwhelm analysts and real signals get missed. Alert fatigue isn’t a people problem, it’s a systems problem
Your detection coverage has hard limits you can’t engineer around: Running under 512 rules means your team has blind spots across the MITRE ATT&CK matrix that no amount of headcount can close
By the time your team sees a threat, the attacker has already moved: Batch processing creates detection delays measured in minutes to hours, turning a containable incident into a breach
Your SIEM budget is consumed by data you never needed: Forced ingestion of raw logs at terabyte scale drives storage costs that are impossible to justify to leadership
DetectFlow Applied: Cut Costs and add Speed
DetectFlow fundamentally changes the economics and speed of threat detection. Rather than ingesting raw chaos and sorting it out later, DetectFlow:
compresses terabytes of raw log data into gigabytes of clean, labeled events (instantly, before anything touches your SIEM).
detection happens in-flight, at wire speed, applying 50,000+ in real time and driving mean time to detect down to 0.005–0.01 seconds
the entire data pipeline is governed and filtered before ingestion, so your SIEM only receives normalized, tagged, and pre-validated events resulting in dramatic optimization of your SIEM spend: you’re paying to store and analyze signal, not noise.
The Endgame: Attack Chains That Tell the Full Story
Where DetectFlow truly separates itself is in how it surfaces what matters. Instead of handing analysts thousands of disjointed, low-context alerts to manually correlate, DetectFlow:
collapses that noise into a prioritized queue of high-probability Attack Chains, complete with AI-generated executive summaries that condense gigabytes of adversary activity into a clear brief.
Threat inference happens in real time, automatically correlating activity across different vectors and hostnames without requiring any manual investigation.
The output isn’t a list of alerts: it’s a decision. Any analyst, regardless of experience level, can immediately understand the full scope of a breach and move directly to remediation.
To learn more about DetectFlow head to our overview page.
FAQ
How does DetectFlow reduce SIEM costs?
DetectFlow sits upstream of your SIEM, processing raw event streams before they are ever ingested. It compresses terabytes of raw log data down to roughly 7% of the original volume, filtering out the noise and passing only normalized, threat-tagged events into your SIEM. The result is that your SIEM licensing and storage costs are calculated against signal, not raw volume. For organizations ingesting at scale, that shift alone can be the difference between a sustainable security budget and one that is impossible to defend to a CFO.
What is MTTD and how does DetectFlow improve it?
MTTD (Mean Time to Detect) is the measure of how long it takes your team to identify an active threat after it begins. Traditional SIEM architectures rely on batch processing, which means detection queries run on a delay, often 15 minutes or more after an event occurs. DetectFlow applies detection rules in real time, directly against the live data stream, reducing MTTD to between 0.005 and 0.01 seconds. In practical terms, that is the difference between catching an attacker in the first move and discovering a breach after lateral movement has already occurred.
Why can’t we just add more detection rules to our SIEM?
Most enterprise SIEMs have a hard operational ceiling on how many rules can run simultaneously. Microsoft Sentinel, for example, caps at 512. Beyond the rule limit, every additional rule adds query overhead, slows detection, and increases costs. DetectFlow runs detection at the pipeline layer using Apache Flink, where it can apply tens of thousands of Sigma rules simultaneously without those constraints. That is what allows your team to close MITRE ATT&CK coverage gaps that are simply not addressable inside a SIEM architecture.
Does DetectFlow replace our existing SIEM?
No. DetectFlow integrates with your existing SIEM, it does not replace it. It sits in the Kafka pipeline layer before ingestion, and your SIEM receives cleaner, pre-enriched, threat-tagged events through the same connectors it already uses. Your analysts continue working in familiar dashboards. The change they notice is better data quality, fewer false positives, and faster investigations, not a new tool to learn.
What does “Attack Chains” mean and why does it matter for my team?
Attack Chains is how DetectFlow surfaces correlated threats rather than individual alerts. Instead of passing thousands of isolated events to your analysts for manual investigation, DetectFlow uses AI to collapse related activity across different vectors and hostnames into a single prioritized queue, with a three-sentence executive summary of what the adversary is doing. For a SOC Manager, that means your team is triaging a coherent story about an attack in progress, not a pile of disconnected signals that require hours of investigation before the picture becomes clear.
When More Tools Create More Problems For years, organizations have approached cybersecurity with a simple mindset-add more tools to strengthen defenses. Firewalls, endpoint solutions, intrusion detection systems, and monitoring platforms have all been layered together to create what appears to be a comprehensive security posture. Yet, despite this growing investment, security outcomes have not improved
The post Why Traditional Security Tools Fail-and How Unified AI Platforms Solve the Problem a
When More Tools Create More Problems For years, organizations have approached cybersecurity with a simple mindset-add more tools to strengthen defenses. Firewalls, endpoint solutions, intrusion detection systems, and monitoring platforms have all been layered together to create what appears to be a comprehensive security posture. Yet, despite this growing investment, security outcomes have not improved
63% of SIEM alerts go uninvestigated every day. Learn the five structural root causes of alert fatigue and how autonomous investigation covers 100% of alerts in under 2 minutes — without replacing your SIEM.
The post SIEM Alert Fatigue Has Five Root Causes. Tuning Fixes Zero of Them. appeared first on D3 Security.
The post SIEM Alert Fatigue Has Five Root Causes. Tuning Fixes Zero of Them. appeared first on Security Boulevard.
63% of SIEM alerts go uninvestigated every day. Learn the five structural root causes of alert fatigue and how autonomous investigation covers 100% of alerts in under 2 minutes — without replacing your SIEM.
Discover 10 practical ChatGPT prompts SOC analysts can use to speed up triage, analyze threats, improve documentation, and enhance incident response workflows.
The post 10 ChatGPT AI Prompts L1 SOC Analysts Can Use in Their Daily Work appeared first on TechRepublic.
Discover 10 practical ChatGPT prompts SOC analysts can use to speed up triage, analyze threats, improve documentation, and enhance incident response workflows.
Analysts take 56 min per alert. 40% of alerts go uninvestigated. The problem isn't SIEM — it's the investigation layer that was never built.
The post Your SIEM Isn’t Broken. Your Investigation Layer Is Missing. appeared first on D3 Security.
The post Your SIEM Isn’t Broken. Your Investigation Layer Is Missing. appeared first on Security Boulevard.
With 52% of U.S. employers adopting hybrid models, traditional perimeters are failing. Discover how to build a robust hybrid work security architecture using Secure SD-WAN, SASE, Zero Trust Network Access (ZTNA), and automated threat detection (SIEM/SOAR) to protect a dispersed workforce in 2026.
The post Security Architecture for Hybrid Work: Enterprise Guide appeared first on Security Boulevard.
With 52% of U.S. employers adopting hybrid models, traditional perimeters are failing. Discover how to build a robust hybrid work security architecture using Secure SD-WAN, SASE, Zero Trust Network Access (ZTNA), and automated threat detection (SIEM/SOAR) to protect a dispersed workforce in 2026.
AI is transforming the SOC, but without explainability analysts can’t trust it. Why transparency is becoming a critical security control.
The post AI in the SOC: Why Explainability is the New Security Control appeared first on Security Boulevard.
In the world of cybersecurity, a single data point is rarely the whole story. Modern attackers don’t just knock on the front door; they probe your APIs, flood your network with "noise" to distract your team, and attempt to slide through applications and servers using stolen credentials.To stop these multi-vector attacks, you need the full picture. By using Cloudflare Log Explorer to conduct security forensics, you get 360-degree visibility through the integration of 14 new datasets, covering the
In the world of cybersecurity, a single data point is rarely the whole story. Modern attackers don’t just knock on the front door; they probe your APIs, flood your network with "noise" to distract your team, and attempt to slide through applications and servers using stolen credentials.
To stop these multi-vector attacks, you need the full picture. By using Cloudflare Log Explorer to conduct security forensics, you get 360-degree visibility through the integration of 14 new datasets, covering the full surface of Cloudflare’s Application Services and Cloudflare One product portfolios. By correlating telemetry from application-layer HTTP requests, network-layer DDoS and Firewall logs, and Zero Trust Access events, security analysts can significantly reduce Mean Time to Detect (MTTD) and effectively unmask sophisticated, multi-layered attacks.
Read on to learn more about how Log Explorer gives security teams the ultimate landscape for rapid, deep-dive forensics.
The flight recorder for your entire stack
The contemporary digital landscape requires deep, correlated telemetry to defend against adversaries using multiple attack vectors. Raw logs serve as the "flight recorder" for an application, capturing every single interaction, attack attempt, and performance bottleneck. And because Cloudflare sits at the edge, between your users and your servers, all of these events are logged before the requests even reach your infrastructure.
Cloudflare Log Explorer centralizes these logs into a unified interface for rapid investigation.
Log Types Supported
Zone-Scoped Logs
Focus: Website traffic, security events, and edge performance.
HTTP Requests
As the most comprehensive dataset, it serves as the "primary record" of all application-layer traffic, enabling the reconstruction of session activity, exploit attempts, and bot patterns.
Firewall Events
Provides critical evidence of blocked or challenged threats, allowing analysts to identify the specific WAF rules, IP reputations, or custom filters that intercepted an attack.
DNS Logs
Identify cache poisoning attempts, domain hijacking, and infrastructure-level reconnaissance by tracking every query resolved at the authoritative edge.
NEL (Network Error Logging) Reports
Distinguish between a coordinated Layer 7 DDoS attack and legitimate network connectivity issues by tracking client-side browser errors.
Spectrum Events
For non-web applications, these logs provide visibility into L4 traffic (TCP/UDP), helping to identify anomalies or brute-force attacks against protocols like SSH, RDP, or custom gaming traffic.
Page Shield
Track and audit unauthorized changes to your site's client-side environment such as JavaScript, outbound connections.
Zaraz Events
Examine how third-party tools and trackers are interacting with user data, which is vital for auditing privacy compliance and detecting unauthorized script behaviors.
Account-Scoped Logs
Focus: Internal security, Zero Trust, administrative changes, and network activity.
Access Requests
Tracks identity-based authentication events to determine which users accessed specific internal applications and whether those attempts were authorized.
Audit Logs
Provides a trail of configuration changes within the Cloudflare dashboard to identify unauthorized administrative actions or modifications.
CASB Findings
Identifies security misconfigurations and data risks within SaaS applications (like Google Drive or Microsoft 365) to prevent unauthorized data exposure.
Magic Transit / IPSec Logs
Helps network engineers perform network-level (L3) monitoring such as reviewing tunnel health and view BGP routing changes.
Browser Isolation Logs
Tracks user actions inside an isolated browser session (e.g., copy-paste, print, or file uploads) to prevent data leaks on untrusted sites
Device Posture Results
Details the security health and compliance status of devices connecting to your network, helping to identify compromised or non-compliant endpoints.
DEX Application Tests
Monitors application performance from the user's perspective, which can help distinguish between a security-related outage and a standard performance degradation.
DEX Device State Events
Provides telemetry on the physical state of user devices, useful for correlating hardware or OS-level anomalies with potential security incidents.
DNS Firewall Logs
Tracks DNS queries filtered through the DNS Firewall to identify communication with known malicious domains or command-and-control (C2) servers.
Email Security Alerts
Logs malicious email activity and phishing attempts detected at the gateway to trace the origin of email-based entry vectors.
Gateway DNS
Monitors every DNS query made by users on your network to identify shadow IT, malware callbacks, or domain-generation algorithms (DGAs).
Gateway HTTP
Provides full visibility into encrypted and unencrypted web traffic to detect hidden payloads, malicious file downloads, or unauthorized SaaS usage.
Gateway Network
Tracks L3/L4 network traffic (non-HTTP) to identify unauthorized port usage, protocol anomalies, or lateral movement within the network.
IPSec Logs
Monitors the status and traffic of encrypted site-to-site tunnels to ensure the integrity and availability of secure network connections.
Magic IDS Detections
Surfaces matches against intrusion detection signatures to alert investigators to known exploit patterns or malware behavior traversing the network.
Network Analytics Logs
Provides high-level visibility into packet-level data to identify volumetric DDoS attacks or unusual traffic spikes targeting specific infrastructure.
Sinkhole HTTP Logs
Captures traffic directed to "sinkholed" IP addresses to confirm which internal devices are attempting to communicate with known botnet infrastructure.
WARP Config Changes
Tracks modifications to the WARP client settings on end-user devices to ensure that security agents haven't been tampered with or disabled.
WARP Toggle Changes
Specifically logs when users enable or disable their secure connectivity, helping to identify periods where a device may have been unprotected.
Zero Trust Network Session Logs
Logs the duration and status of authenticated user sessions to map out the complete lifecycle of a user's access within the protected perimeter.
Log Explorer can identify malicious activity at every stage
Get granular application layer visibility with HTTP Requests, Firewall Events, and DNS logs to see exactly how traffic is hitting your public-facing properties.Track internal movement with Access Requests, Gateway logs, and Audit logs. If a credential is compromised, you’ll see where they went. Use Magic IDS and Network Analytics logs to spot volumetric attacks and "East-West" lateral movement within your private network.
Identify the reconnaissance
Attackers use scanners and other tools to look for entry points, hidden directories, or software vulnerabilities. To identify this, using Log Explorer, you can query http_requests for any EdgeResponseStatus codes of 401, 403, or 404 coming from a single IP, or requests to sensitive paths (e.g. /.env, /.git, /wp-admin).
Additionally, magic_ids_detections logs can also be used to identify scanning at the network layer. These logs provide packet-level visibility into threats targeting your network. Unlike standard HTTP logs, these logs focus on signature-based detections at the network and transport layers (IP, TCP, UDP). Query to discover cases where a single SourceIP is triggering multiple unique detections across a wide range of DestinationPort values in a short timeframe. Magic IDS signatures can specifically flag activities like Nmap scans or SYN stealth scans.
Check for diversions
While the attacker is conducting reconnaissance, they may attempt to disguise this with a simultaneous network flood. Pivot to network_analytics_logs to see if a volumetric attack is being used as a smokescreen.
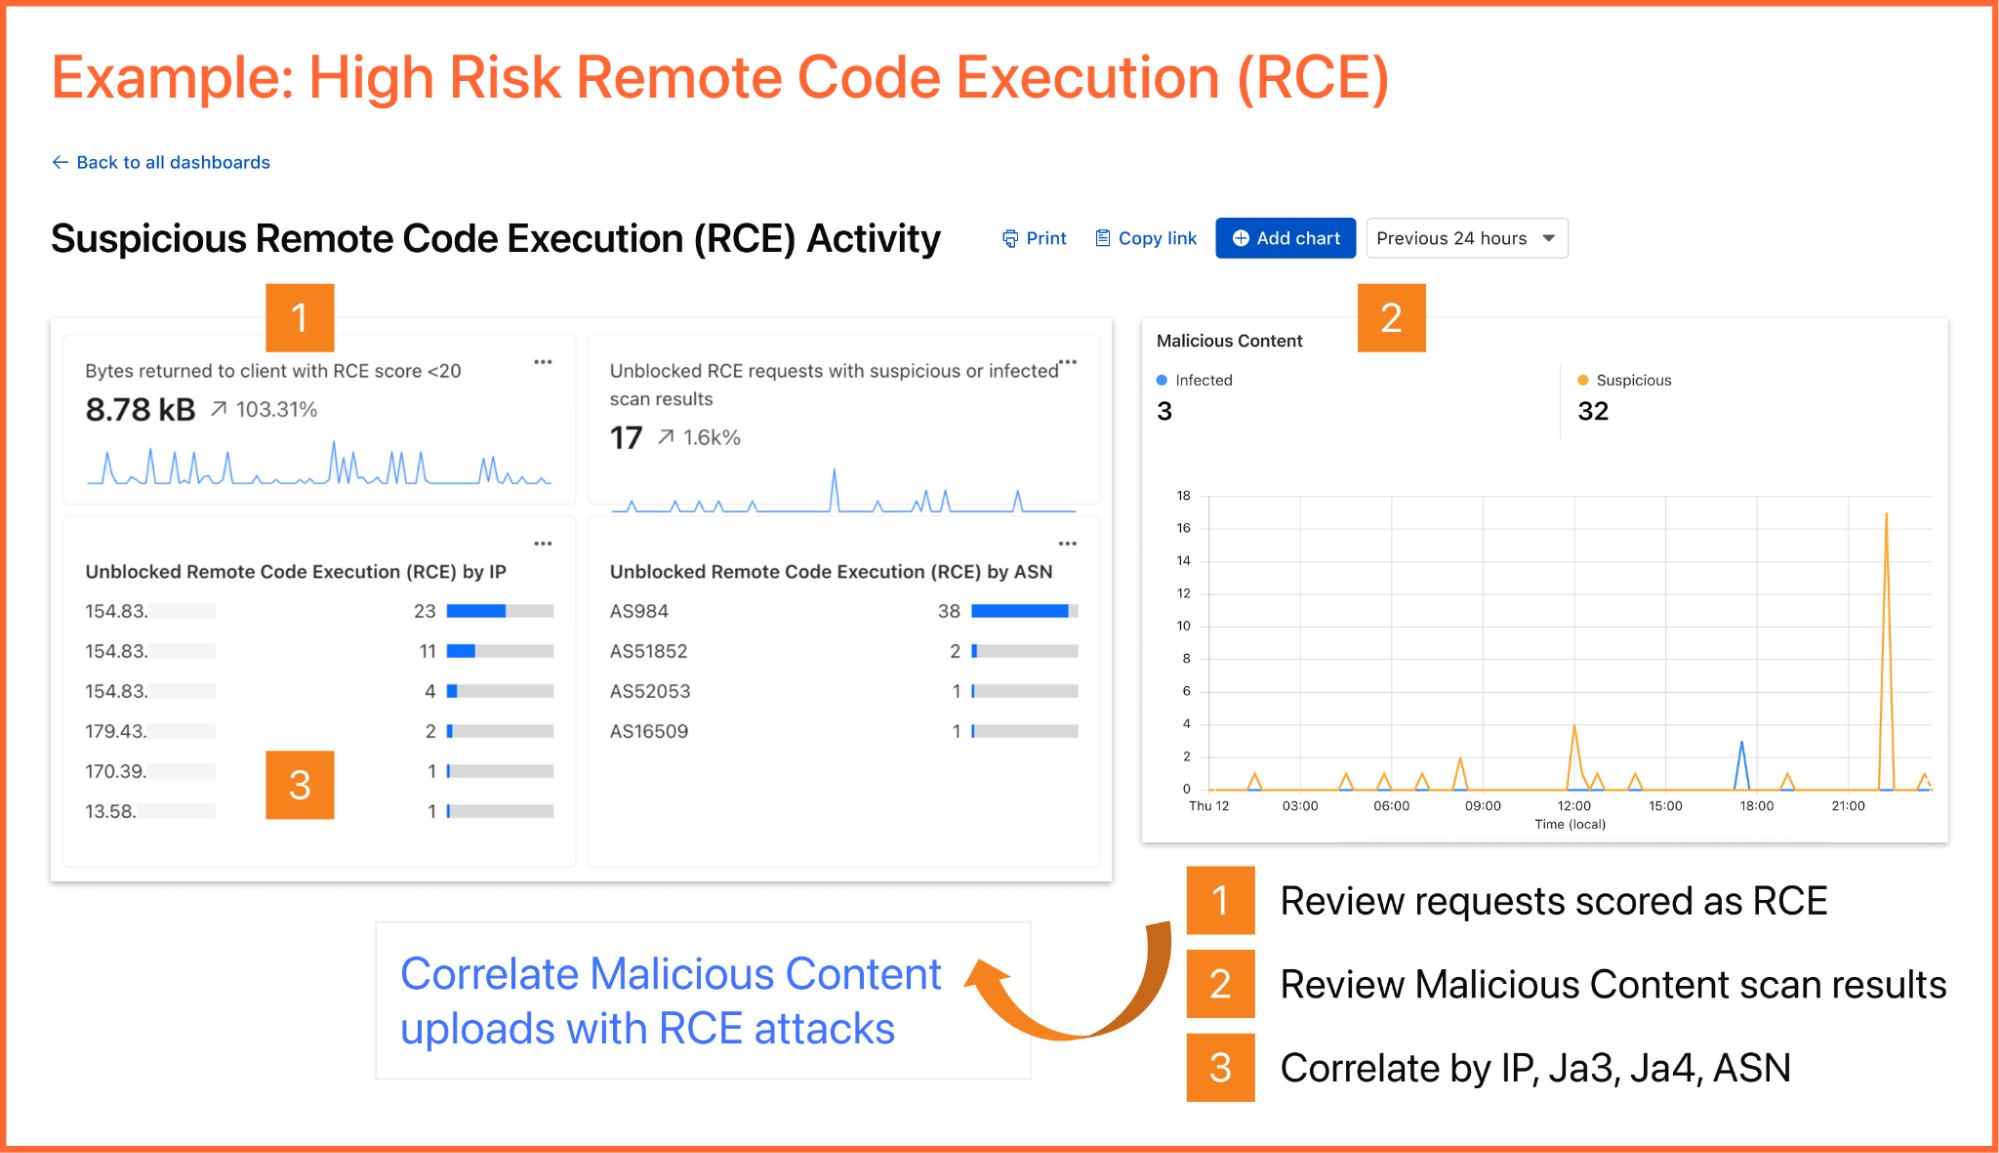
Identify the approach
Once attackers identify a potential vulnerability, they begin to craft their weapon. The attacker sends malicious payloads (e.g. SQL injection or large/corrupt file uploads) to confirm the vulnerability. Review http_requests and/or fw_events to identify any Cloudflare detection tools that have triggered. Cloudflare logs security signals in these datasets to easily identify requests with malicious payloads using fields such as WAFAttackScore, WAFSQLiAttackScore, FraudAttack, ContentScanJobResults, and several more. Review our documentation to get a full understanding of these fields. The fw_events logs can be used to determine whether these requests made it past Cloudflare’s defenses by examining the action, source, and ruleID fields. Cloudflare’s managed rules by default blocks many of these payloads by default. Review Application Security Overview to know if your application is protected.
Showing the Managed rules Insight that displays on Security Overview if the current zone does not have Managed Rules enabled
Audit the identity
Did that suspicious IP manage to log in? Use the ClientIP to search access_requests. If you see a "Decision: Allow" for a sensitive internal app, you know you have a compromised account.
Stop the leak (data exfiltration)
Attackers sometimes use DNS tunneling to bypass firewalls by encoding sensitive data (like passwords or SSH keys) into DNS queries. Instead of a normal request like google.com, the logs will show long, encoded strings. Look for an unusually high volume of queries for unique, long, and high-entropy subdomains by examining the fields: QueryName: Look for strings like h3ldo293js92.example.com, QueryType: Often uses TXT, CNAME, or NULL records to carry the payload, and ClientIP: Identify if a single internal host is generating thousands of these unique requests.
Additionally, attackers may attempt to leak sensitive data by hiding it within non-standard protocols or by using common protocols (like DNS or ICMP) in unusual ways to bypass standard firewalls. Discover this by querying the magic_ids_detections logs to look for signatures that flag protocol anomalies, such as "ICMP tunneling" or "DNS tunneling" detections in the SignatureMessage.
Whether you are investigating a zero-day vulnerability or tracking a sophisticated botnet, the data you need is now at your fingertips.
Correlate across datasets
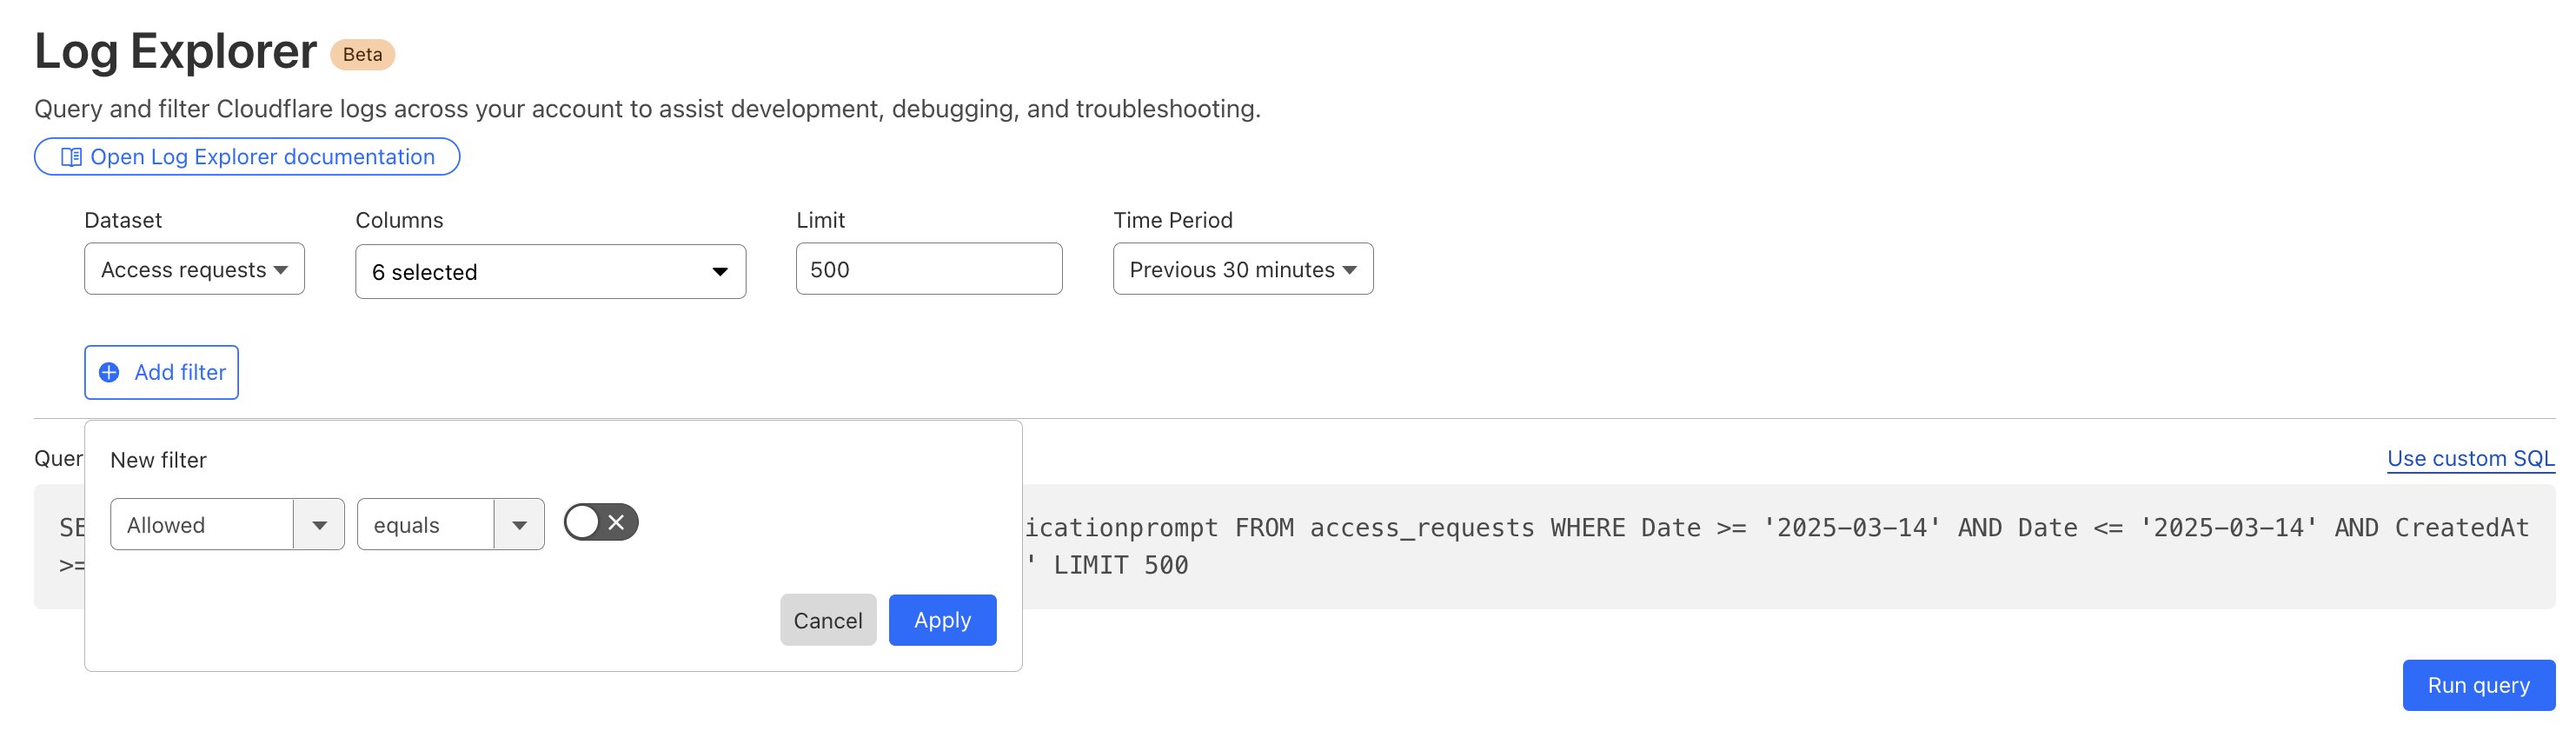
Investigate malicious activity across multiple datasets by pivoting between multiple concurrent searches. With Log Explorer, you can now work with multiple queries simultaneously with the new Tabs feature. Switch between tabs to query different datasets or Pivot and adjust queries using filtering via your query results.
When you correlate data across multiple Cloudflare log sources, you can detect sophisticated multi-stage attacks that appear benign when viewed in isolation. This cross-dataset analysis allows you to see the full attack chain from reconnaissance to exfiltration.
Session hijacking (token theft)
Scenario: A user authenticates via Cloudflare Access, but their subsequent HTTP_request traffic looks like a bot.
Step 1: Identify high-risk sessions in http_requests.
SELECT RayID, ClientIP, ClientRequestUserAgent, BotScore
FROM http_requests
WHERE date = '2026-02-22'
  AND BotScore < 20
LIMIT 100
Step 2: Copy the RayID and search access_requests to see which user account is associated with that suspicious bot activity.
SELECT Email, IPAddress, Allowed
FROM access_requests
WHERE date = '2026-02-22'
  AND RayID = 'INSERT_RAY_ID_HERE'
Post-phishing C2 beaconing
Scenario: An employee clicked a link in a phishing email which resulted in compromising their workstation. This workstation sends a DNS query for a known malicious domain, then immediately triggers an IDS alert.
Step 1: Find phishing attacks by examining email_security_alerts for violations.
SELECT Timestamp, Threatcategories, To, Alertreason
FROM email_security_alerts
WHERE date = '2026-02-22'
  AND Threatcategories LIKE 'phishing'
Step 2: Use Access logs to correlate the user’s email (To) to their IP Address.
SELECT Email, IPAddress
FROM access_requests
WHERE date = '2026-02-22'
Step 3: Find internal IPs querying a specific malicious domain in gateway_dns logs.
SELECT SrcIP, QueryName, DstIP,
FROM gateway_dns
WHERE date = '2026-02-22'
  AND SrcIP = 'INSERT_IP_FROM_PREVIOUS_QUERY'
  AND QueryName LIKE '%malicious_domain_name%'
Lateral movement (Access → network probing)
Scenario: A user logs in via Zero Trust and then tries to scan the internal network.
Step 1: Find successful logins from unexpected locations in access_requests.
SELECT IPAddress, Email, Country
FROM access_requests
WHERE date = '2026-02-22'
  AND Allowed = true
  AND Country != 'US' -- Replace with your HQ country
Step 2: Check if that IPAddress is triggering network-level signatures in magic_ids_detections.
SELECT SignatureMessage, DestinationIP, Protocol
FROM magic_ids_detections
WHERE date = '2026-02-22'
  AND SourceIP = 'INSERT_IP_ADDRESS_HERE'
Opening doors for more data
From the beginning, Log Explorer was designed with extensibility in mind. Every dataset schema is defined using JSON Schema, a widely-adopted standard for describing the structure and types of JSON data. This design decision has enabled us to easily expand beyond HTTP Requests and Firewall Events to the full breadth of Cloudflare's telemetry. The same schema-driven approach that powered our initial datasets scaled naturally to accommodate Zero Trust logs, network analytics, email security alerts, and everything in between.
More importantly, this standardization opens the door to ingesting data beyond Cloudflare's native telemetry. Because our ingestion pipeline is schema-driven rather than hard-coded, we're positioned to accept any structured data that can be expressed in JSON format. For security teams managing hybrid environments, this means Log Explorer could eventually serve as a single pane of glass, correlating Cloudflare's edge telemetry with logs from third-party sources, all queryable through the same SQL interface. While today's release focuses on completing coverage of Cloudflare's product portfolio, the architectural groundwork is laid for a future where customers can bring their own data sources with custom schemas.
To investigate a multi-vector attack effectively, timing is everything. A delay of even a few minutes in the log availability can be the difference between proactive defense and reactive damage control.
That is why we have optimized our ingestion for better speed and resilience. By increasing concurrency in one part of our ingestion path, we have eliminated bottlenecks that could cause “noisy neighbor” issues, ensuring that one client’s data surge doesn’t slow down another’s visibility. This architectural work has reduced our P99 ingestion latency by approximately 55%, and our P50 by 25%, cutting the time it takes for an event at the edge to become available for your SQL queries.
Grafana chart displaying the drop in ingest latency after architectural upgrades
Follow along for more updates
We're just getting started. We're actively working on even more powerful features to further enhance your experience with Log Explorer, including the ability to run these detection queries on a custom defined schedule.
Design mockup of upcoming Log Explorer Scheduled Queries feature
To get access to Log Explorer, you can purchase self-serve directly from the dash or for contract customers, reach out for a consultation or contact your account manager. Additionally, you can read more in our Developer Documentation.
Security teams are no longer short on data. They are drowning in it. Cloud control plane logs, endpoint telemetry, identity events, SaaS audit trails, application logs, and network signals keep expanding, while the SOC is still expected to deliver faster detection and cleaner investigations. That is why SIEM vs log management is not just a tooling debate. It is a telemetry strategy question about what to retain as evidence, what to analyze for real-time detection, and where to do the heavy lift
Security teams are no longer short on data. They are drowning in it. Cloud control plane logs, endpoint telemetry, identity events, SaaS audit trails, application logs, and network signals keep expanding, while the SOC is still expected to deliver faster detection and cleaner investigations. That is why SIEM vs log management is not just a tooling debate. It is a telemetry strategy question about what to retain as evidence, what to analyze for real-time detection, and where to do the heavy lifting.
Observability programs accelerate the flood. More telemetry can mean better visibility, but only if the SOC can trust it, normalize it, enrich it, and query it fast enough to keep pace with active threats. At scale, the cost and operational burden show up quickly across both SIEM and log management. PwC highlights how rising data volumes and cost models can push teams to limit ingestion and create blind spots, while alert overload and performance constraints make it harder to separate real threats from noise. Speed is also unforgiving. Verizon reports the median time for users to fall for phishing is less than 60 seconds, while breach lifecycles remain measured in months.
That is why many SOCs are adopting asecurity data pipeline mindset. It means processing telemetry before it lands in your tools, so you control what gets stored, what gets indexed, and what gets analyzed. Solutions likeSOC Prime’s DetectFlow add even more value by turning a data pipeline into a detection pipeline through in-flight normalization and enrichment, running thousands of Sigma rules on streaming data, and supporting value-based routing. Low-signal noise can stay in lower-cost log storage for retention, search, and forensics, while only enriched, detection-tagged events flow into the SIEM for triage and response. The outcome is lower SIEM ingestion and alert noise costs without sacrificing investigation history.
SIEM vs Log Management: Definitions
Before comparing tools, it helps to align on what each category is designed to do, because overlapping feature checklists can hide fundamentally different objectives.
Gartnerdefines SIEM around a customer need to analyze event data in real time for early detection and to collect, store, investigate, and report on log data for detection, investigation, and incident response. In other words, SIEM is a security-focused system of record that expects heterogeneous data, correlates it, and supports security operations workflows.
Log management has a different center of gravity. NISTdescribes log management as the process and infrastructure for generating, transmitting, storing, analyzing, and disposing of log data, supported by planning and operational practices that keep logging consistent and reliable. In fact, log management is how you keep the raw evidence searchable and retained at scale, while SIEM is where you operationalize security analytics and response.
The practical difference shows up when you ask two questions:
What is the unit of value? For log management, it is searchable records and operational visibility. For SIEM, it’s detection fidelity and incident context.
Where does analytics happen? In log management, analytics often supports exploration and troubleshooting. In SIEM, analytics is built for threat detection, alerting, triage, and case management
What Is a Log Management System?
A log management system is the operational backbone for ingesting and organizing logs, so teams can search, retain, and use them to understand what happened.
Log management is often the first place teams see the economics of telemetry. Many organizations don’t need to run expensive correlation on every log line. Instead, they store more data cheaply and retrieve it quickly when an incident demands it. That’s why log management is frequently paired with data routing and filtering approaches that reduce noise before it reaches higher-cost analytics layers.
For security teams, log management becomes truly valuable when it produces high-integrity, well-structured telemetry that downstream detections can rely on, without forcing the SIEM to act as a catch-all storage sink.
What Is a SIEM?
A SIEM stands for Security Information and Event Management. It is designed to centralize security-relevant telemetry and turn it into detections, investigations, and reports. Normally, SIEM is described as supporting threat detection, compliance, and incident management through the collection and analysis of security events, both near real-time and historical, across a broad scope of log and contextual data sources.
But SIEMs face structural pressures as telemetry grows. Common pain points in traditional SIEM approaches include skyrocketing data volumes and cost, alert overload, and scalability and performance constraints when searching and correlating large datasets in real time. Those pressures matter because defenders already operate on unfavorable timelines. IBM’s Cost of a Data Breachreport shows breach lifecycles still commonly span months, which makes efficient investigation and reliable telemetry critical.
So while SIEM remains central for security analytics and response, many teams now treat it as the destination for curated, detection-ready data, not the place where all telemetry must land first.
SIEM vs Log Management: Main Features
A useful way to compare SIEM and log management is to map them to the security data lifecycle: collect, transform, store, analyze, and respond. Log management does most of the work in collect through store, with fast search to support investigations. SIEM concentrates on analyzing through response, where correlation, enrichment, alerting, and case management are expected to work under pressure.
Log management features typically cluster around collect, transform, store, and search:
Ingestion at scale: agents, syslog, API pulls, cloud-native integrations
Parsing and field extraction: schema mapping, pipeline transforms, enrichment for searchability
Retention and storage controls: tiering, compression, cost governance, access policies
Search and exploration: fast queries for troubleshooting and forensic hunting
SIEM features concentrate on analyzing and responding:
Security analytics and correlation: rules, detections, behavioral patterns, cross-source joins
Context and enrichment: identity, asset inventory, threat intel, entity resolution
Case management: investigations, evidence tracking, compliance reporting
In other words, log management optimizes for retention and retrieval, and SIEM optimizes for detection and action. Yet, traditional SIEM approaches strain when the platform becomes both the telemetry lake and the correlation engine, especially under rising ingestion costs and alert noise. That is why many teams treat log management as the evidence layer, SIEM as the decision layer, and a pipeline layer as the control plane that shapes what flows into each.
Benefits of Using Log Management and SIEMs
Log management and SIEM are most effective when they’re treated as complementary layers in a single security data strategy.
Log management delivers depth and durability. It helps teams retain more raw evidence, troubleshoot operational issues that look like security incidents, and preserve the grounds needed for later forensics. This becomes essential when threat hypotheses emerge after the fact (for example, learning a new indicator days later and needing to search back in time).
SIEM delivers security outcomes: detection, prioritization, and incident workflows. A well-tuned SIEM program can reduce “needle-in-a-haystack” work by correlating events across identities, endpoints, networks, and cloud control planes.
The best security programs get three benefits from combining both:
Cost control: store more, analyze less expensively by default, and route high-value data to SIEM.
Better investigations: keep deep history in log platforms while SIEM tracks detections and cases.
Higher signal quality: normalize and enrich logs so detections fire on consistent fields rather than brittle strings.
How SOC Prime Can Improve the Work of SIEM & Log Management
SOC Prime brings the SIEM and log management story together as a single end-to-end workflow.
You start withAttack Detective to audit your SOC and map gaps to MITRE ATT&CK, so you know which telemetry and techniques you are missing. Then,Threat Detection Marketplace becomes the sourcing layer where you pull context-enriched detections aligned to those gaps and the latest TTPs.Uncoder AI acts as a detection-engineering booster, making the content operational and portable to any native formats your SIEM, EDR, or Data Lake actually runs, while also helping refine and optimize the logic so it performs at scale.
DetectFlow is the final layer that turns a data pipeline into a detection pipeline and enables full detection orchestration. Running tens of thousands of Sigma rules on live Kafka streams with sub-second MTTD using Apache Flink, DetectFlow tags and enriches events in flight before they reach your security stack and routes outcomes by value. This removes the need for SIEM min-maxing around rule limits and performance tradeoffs, because detection scale shifts to the stream layer, where it grows with your infrastructure, not vendor caps. For SIEM, it delivers cleaner, enriched, detection-tagged signals for triage and response. For log management, it preserves deep retention while making searches and investigations faster through normalized fields and attached detection context.
Dan Petrillo, VP of Product at BlueVoyant
As artificial intelligence (AI) becomes more deeply embedded in security operations, a divide has emerged in how its role is defined. Some argue the security operations centre (SOC) should be fully autonomous, with AI replacing human analysts. Others believe that augmentation is the right path, using AI to support and extend existing teams.
Augmentation probably reflects how SOCs operate in practice. It helps analysts triage alerts, investigate inc
As artificial intelligence (AI) becomes more deeply embedded in security operations, a divide has emerged in how its role is defined. Some argue the security operations centre (SOC) should be fully autonomous, with AI replacing human analysts. Others believe that augmentation is the right path, using AI to support and extend existing teams.
Augmentation probably reflects how SOCs operate in practice. It helps analysts triage alerts, investigate incidents faster, and it brings better context into their work, while still ensuring humans are accountable for decisions.
Complete autonomy assumes a level of reliable, end-to-end decision-making that can operate without continuous human oversight. That’s a high bar. In real SOC environments, the technology, data quality, and operational constraints rarely support that assumption. Detection pipelines are noisy, context is fragmented across tools, and threat signals often require human judgment to interpret correctly. Even the most advanced automation struggles with edge cases, ambiguous alerts, and the dynamic nature of attacker behaviour.
Why an Autonomous SOC Falls Short
Delving deeper and examining why AI cannot fully replace SOC analysts; in short, it comes down to the oversimplification of the complexities inherent in what security operations involve. Investigation is only one part of a functioning SOC. Organisations also depend on experienced practitioners to interpret ambiguous signals, manage escalation, and communicate risk to senior leadership. When incidents become business issues, that same expertise is required to apply judgement, coordinate stakeholders, and produce reporting that stands up to scrutiny.
When something goes wrong, such as a logging failure, a broken parser following a third-party firewall update, or months of missing telemetry, automated systems cannot resolve the issue alone. Human expertise is needed to understand context, reconstruct events, and guide remediation.
Governance is another constraint. The cost of false negatives remains unacceptably high, and security leaders are unlikely to deploy solutions that act without clear oversight. Even where AI can execute parts of a workflow, organisations still require process controls, quality checks, and human validation for complex or unfamiliar scenarios. A fully autonomous model cannot reliably make the right judgement call in every situation, particularly when decisions carry real business impact.
Accuracy risks also remain. AI systems can make mistakes, draw incorrect conclusions, or miss important signals if left unchecked. Human oversight therefore remains essential to spot errors early and prevent them from turning into operational problems.
Ultimately, fully autonomous SOC models ask organisations to trade human judgement and accountability for AI that is still maturing. That trade-off is impractical in an environment where consequences are measured in real-world disruption.
Why AI in the SOC Is Still Essential
However, none of the above suggests that AI does not have a place in the SOC. When implemented with purpose it delivers measurable improvements in the areas where teams are under the most pressure.
AI can take onrepetitive, high-volume tasks such as alert triage and enrichment, allowing analysts to focus on more complex investigations, decision-making, and response. Deployed effectively, AI in the SOC is essential to reclaiming human time from low value activity, enabling teams to apply expertise where it has the greatest operational payoff.
Some of the most significant benefits of integrating AI agents into human-led SOC teams include:
Workload reduction: AI can handle repetitive, high-volume tasks such as alert triage, dynamic enrichment, and report generation, reducing analyst fatigue and operational backlog.
Process consistency: AI helps standardise workflows across varying skill levels, smoothing differences in tool syntax and operating procedures so teams perform more consistently.
Improved alert quality: By incorporating external threat intelligence, control telemetry, and asset context, AI can reduce false positives and support more accurate prioritisation.
Faster decision-making: Attack timelines, path mapping, and context-rich summaries enable analysts to assess scope, impact, and containment options more quickly.
Knowledge retention: AI working alongside human analysts captures operational insights over time, mitigating the impact of staff churn and preserving institutional knowledge. It can also identify patterns that may be missed by individuals and recommend rules or remediations accordingly.
Always on: AI doesn’t need breaks, get tired, fall ill, take holidays, or turn up late. It becomes a consistently reliable coworker for stretched teams working under pressure.
Where Augmentation Delivers the Most Value
AI delivers the greatest value when applied to SOC activities that are slow, manual, or prone to inconsistency, while keeping humans accountable for decisions and execution.
Augmentation should be introduced first in areas where AI can speed up analysis, surface insight, and support judgement, without removing human oversight. Below are a few areas where you might consider using AI to augment your team:
Alert triage: False-positive reduction, dynamic enrichment, and contextual prioritisation using threat intelligence, asset criticality, and exposure data.
Augmented investigations: Natural language querying, attack path and timeline visualisation, and suggested queries that speed root-cause analysis.
Incident and case summarisation: Automated executive- and GRC-ready reporting that consolidates findings with clear, decision-ready context.
Hypothesis generation: Continuous pattern and behaviour analysis to surface new detections, investigative approaches, and remediation opportunities for human approval.
Operational oversight: AI that learns expected procedures and flags process deviations, bottlenecks, or underperformance for leadership attention.
Response recommendations: Context-aware guidance and playbook generation, with optional integration-driven execution remaining under human control.
What This Means for Security Teams
Security teams manage millions of investigations every year, even after automating many routine cases. While automation can streamline these routine tasks, full autonomy remains unrealistic. The most critical stages of an investigation still rely on human judgement, context and accountability.
AI will continue to enhance the speed, scale and consistency of security operations, but the SOC of the future will remain human led, with AI augmenting, not replacing, analysts. Organisations that adopt AI in targeted, outcome driven ways will scale more effectively, reduce risk and preserve institutional knowledge. As threats evolve, AI augmented SOC teams will not only keep pace but stay ahead of adversaries.
Um número significativo dos incidentes modernos tem início com o comprometimento de contas. Como os agentes de acesso inicial se tornaram uma indústria criminosa plenamente estabelecida, ficou muito mais fácil para invasores organizarem ataques à infraestrutura das empresas simplesmente comprando conjuntos de logins e senhas de funcionários. A ampla adoção de diferentes métodos de acesso remoto tornou essa tarefa ainda mais simples. Ao mesmo tempo, as fases iniciais desses ataques se assemelham
Um número significativo dos incidentes modernos tem início com o comprometimento de contas. Como os agentes de acesso inicial se tornaram uma indústria criminosa plenamente estabelecida, ficou muito mais fácil para invasores organizarem ataques à infraestrutura das empresas simplesmente comprando conjuntos de logins e senhas de funcionários. A ampla adoção de diferentes métodos de acesso remoto tornou essa tarefa ainda mais simples. Ao mesmo tempo, as fases iniciais desses ataques se assemelham com frequência a ações perfeitamente legítimas de colaboradores e permanecem indetectáveis pelos mecanismos tradicionais de segurança por longos períodos.
Confiar apenas nas medidas de proteção da conta e nas políticas de senha não é uma opção. Sempre existe a possibilidade de que invasores obtenham credenciais de funcionários por meio de ataques de phishing, malware do tipo infostealer ou, simplesmente, pela falta de cuidado de usuários que reutilizam a mesma senha em contas profissionais e pessoais e não dão muita atenção a vazamentos ocorridos em serviços de terceiros.
Assim, a detecção de ataques à infraestrutura de uma empresa exige ferramentas que identifiquem não apenas assinaturas isoladas de ameaças, mas também mecanismos de análise comportamental que reconheçam desvios do comportamento normal de usuários e processos do sistema.
Uso de IA no SIEM para detectar comprometimento de contas
Como mencionamos na postagem anterior, para detectar ataques envolvendo comprometimento de contas, o SIEM da Kaspersky Unified Monitoring and Analysis Platform foi equipado com regras UEBA para identificar anomalias em autenticação, atividades de rede e execução de processos em estações de trabalho e servidores Windows. Na atualização mais recente, seguimos desenvolvendo o sistema nessa mesma direção, incorporando abordagens baseadas em IA.
O sistema cria um modelo do comportamento normal dos usuários durante a autenticação e passa a monitorar desvios em relação aos cenários habituais, como horários de login atípicos, cadeias de eventos incomuns e tentativas de acesso anômalas. Essa abordagem permite que SIEM identifique tanto tentativas de autenticação com credenciais roubadas quanto o uso de contas já comprometidas, inclusive em cenários complexos que antes poderiam passar despercebidos.
Em vez de buscar indicadores isolados, o sistema analisa desvios em relação a padrões normais. Isso possibilita a detecção mais precoce de ataques complexos, reduz o número de falsos positivos e diminui significativamente a carga operacional das equipes de SOC.
Anteriormente, ao utilizar regras UEBA para detectar anomalias, era necessário criar diversas regras responsáveis por executar etapas preliminares e gerar listas adicionais nas quais os dados intermediários eram armazenados. Agora, na nova versão do SIEM, com um correlacionador atualizado, é possível detectar o sequestro de contas por meio de uma única regra especializada.
Outras atualizações na Kaspersky Unified Monitoring and Analysis Platform
Quanto mais complexa é a infraestrutura e maior o volume de eventos, mais críticos se tornam os requisitos de desempenho da plataforma, a flexibilidade no gerenciamento de acessos e a facilidade de operação no dia a dia. Um sistema SIEM moderno deve não apenas detectar ameaças com precisão, mas também permanecer resiliente, sem precisar de atualizações constantes de hardware ou de reestruturação de processos. Por isso, na versão 4.2, demos mais um passo para tornar a plataforma mais prática e adaptável. As atualizações impactam a arquitetura, os mecanismos de detecção e a experiência do usuário.
Inclusão de funções flexíveis e controle de acesso granular
Uma das principais inovações da nova versão do SIEM é o modelo flexível de funções. Agora, os clientes podem criar funções personalizadas para diferentes usuários do sistema, duplicar funções existentes e configurar conjuntos específicos de permissões de acordo com as atividades de cada especialista. Isso permite uma diferenciação mais precisa de responsabilidades entre analistas de SOC, administradores e gestores, reduz o risco de concessão excessiva de privilégios e reflete de forma mais fiel os processos internos da empresa nas configurações do SIEM.
Novo correlacionador e, como resultado, maior estabilidade da plataforma
Na versão 4.2, introduzimos uma versão beta de um novo mecanismo de correlação (2.0). Ela processa eventos com maior velocidade e exige menos recursos de hardware. Para os clientes, isso se traduz em:
operação estável mesmo sob cargas elevadas;
capacidade de processar grandes volumes de dados sem a necessidade de expansão imediata da infraestrutura;
desempenho mais previsível.
Cobertura de TTPs de acordo com a matriz MITRE ATT&CK
Também seguimos ampliando sistematicamente a cobertura da matriz de técnicas, táticas e procedimentos MITRE ATT&CK: atualmente, o Kaspersky SIEM cobre mais de 60% de toda a matriz. As regras de detecção são atualizadas regularmente e acompanhadas de recomendações de resposta. Isso ajuda os clientes a entenderem quais cenários de ataque já estão sob controle e a planejarem a evolução das suas defesas com base em um modelo amplamente aceito pelo setor.
Outras melhorias
A versão 4.2 também introduz a possibilidade de realizar backup e restauração de eventos, além da exportação de dados para arquivos seguros com controle de integridade, algo especialmente importante para investigações, auditorias e conformidade regulatória. Consultas em segundo plano foram implementadas para facilitar o trabalho dos analistas. Agora, pesquisas complexas e que consomem muitos recursos podem ser executadas em segundo plano sem impactar tarefas prioritárias. Isso acelera a análise de grandes volumes de dados.
Continuamos atualizando regularmente o Kaspersky SIEM, expandindo suas capacidades de detecção, aprimorando a arquitetura e incorporando funcionalidades de IA para que a plataforma atenda cada vez melhor às condições reais enfrentadas pelas equipes de segurança da informação. O objetivo é não apenas responder a incidentes, mas também ajudar a construir um modelo de proteção sustentável para o futuro. Acompanhe as atualizações sobre o sistema SIEM, a Kaspersky Unified Monitoring and Analysis Platform, na página oficial do produto.
A SIEM is a complex system offering broad and flexible threat detection capabilities. Due to its complexity, its effectiveness heavily depends on how it is configured and what data sources are connected to it. A one-time SIEM setup during implementation is not enough: both the organization’s infrastructure and attackers’ techniques evolve over time. To operate effectively, the SIEM system must reflect the current state of affairs.
We provide customers with services to assess SIEM effectiveness,
A SIEM is a complex system offering broad and flexible threat detection capabilities. Due to its complexity, its effectiveness heavily depends on how it is configured and what data sources are connected to it. A one-time SIEM setup during implementation is not enough: both the organization’s infrastructure and attackers’ techniques evolve over time. To operate effectively, the SIEM system must reflect the current state of affairs.
We provide customers with services to assess SIEM effectiveness, helping to identify issues and offering options for system optimization. In this article, we examine typical SIEM operational pitfalls and how to address them. For each case, we also include methods for independent verification.
This material is based on an assessment of Kaspersky SIEM effectiveness; therefore, all specific examples, commands, and field names are taken from that solution. However, the assessment methodology, issues we identified, and ways to enhance system effectiveness can easily be extrapolated to any other SIEM.
Methodology for assessing SIEM effectiveness
The primary audience for the effectiveness assessment report comprises the SIEM support and operation teams within an organization. The main goal is to analyze how well the usage of SIEM aligns with its objectives. Consequently, the scope of checks can vary depending on the stated goals. A standard assessment is conducted across the following areas:
Composition and scope of connected data sources
Coverage of data sources
Data flows from existing sources
Correctness of data normalization
Detection logic operability
Detection logic accuracy
Detection logic coverage
Use of contextual data
SIEM technical integration into SOC processes
SOC analysts’ handling of alerts in the SIEM
Forwarding of alerts, security event data, and incident information to other systems
Deployment architecture and documentation
At the same time, these areas are examined not only in isolation but also in terms of their potential influence on one another. Here are a couple of examples illustrating this interdependence:
Issues with detection logic due to incorrect data normalization. A correlation rule with the condition deviceCustomString1 not contains <string> triggers a large number of alerts. The detection logic itself is correct: the specific event and the specific field it targets should not generate a large volume of data matching the condition. Our review revealed the issue was in the data ingested by the SIEM, where incorrect encoding caused the string targeted by the rule to be transformed into a different one. Consequently, all events matched the condition and generated alerts.
When analyzing coverage for a specific source type, we discovered that the SIEM was only monitoring 5% of all such sources deployed in the infrastructure. However, extending that coverage would increase system load and storage requirements. Therefore, besides connecting additional sources, it would be necessary to scale resources for specific modules (storage, collectors, or the correlator).
The effectiveness assessment consists of several stages:
Collect and analyze documentation, if available. This allows assessing SIEM objectives, implementation settings (ideally, the deployment settings at the time of the assessment), associated processes, and so on.
Interview system engineers, analysts, and administrators. This allows assessing current tasks and the most pressing issues, as well as determining exactly how the SIEM is being operated. Interviews are typically broken down into two phases: an introductory interview, conducted at project start to gather general information, and a follow-up interview, conducted mid-project to discuss questions arising from the analysis of previously collected data.
Gather information within the SIEM and then analyze it. This is the most extensive part of the assessment, during which Kaspersky experts are granted read-only access to the system or a part of it to collect factual data on its configuration, detection logic, data flows, and so on.
The assessment produces a list of recommendations. Some of these can be implemented almost immediately, while others require more comprehensive changes driven by process optimization or a transition to a more structured approach to system use.
Issues arising from SIEM operations
The problems we identify during a SIEM effectiveness assessment can be divided into three groups:
Performance issues, meaning operational errors in various system components. These problems are typically resolved by technical support, but to prevent them, it is worth periodically checking system health status.
Efficiency issues – when the system functions normally but seemingly adds little value or is not used to its full potential. This is usually due to the customer using the system capabilities in a limited way, incorrectly, or not as intended by the developer.
Detection issues – when the SIEM is operational and continuously evolving according to defined processes and approaches, but alerts are mostly false positives, and the system misses incidents. For the most part, these problems are related to the approach taken in developing detection logic.
Key observations from the assessment
Event source inventory
When building the inventory of event sources for a SIEM, we follow the principle of layered monitoring: the system should have information about all detectable stages of an attack. This principle enables the detection of attacks even if individual malicious actions have gone unnoticed, and allows for retrospective reconstruction of the full attack chain, starting from the attackers’ point of entry.
Problem: During effectiveness assessments, we frequently find that the inventory of connected source types is not updated when the infrastructure changes. In some cases, it has not been updated since the initial SIEM deployment, which limits incident detection capabilities. Consequently, certain types of sources remain completely invisible to the system.
We have also encountered non-standard cases of incomplete source inventory. For example, an infrastructure contains hosts running both Windows and Linux, but monitoring is configured for only one family of operating systems.
How to detect: To identify the problems described above, determine the list of source types connected to the SIEM and compare it against what actually exists in the infrastructure. Identifying the presence of specific systems in the infrastructure requires an audit. However, this task is one of the most critical for many areas of cybersecurity, and we recommend running it on a periodic basis.
We have compiled a reference sheet of system types commonly found in most organizations. Depending on the organization type, infrastructure, and threat model, we may rearrange priorities. However, a good starting point is as follows:
High Priority – sources associated with:
Remote access provision
External services accessible from the internet
External perimeter
Endpoint operating systems
Information security tools
Medium Priority – sources associated with:
Remote access management within the perimeter
Internal network communication
Infrastructure availability
Virtualization and cloud solutions
Low Priority – sources associated with:
Business applications
Internal IT services
Applications used by various specialized teams (HR, Development, PR, IT, and so on)
Monitoring data flow from sources
Regardless of how good the detection logic is, it cannot function without telemetry from the data sources.
Problem: The SIEM core is not receiving events from specific sources or collectors. Based on all assessments conducted, the average proportion of collectors that are configured with sources but are not transmitting events is 38%. Correlation rules may exist for these sources, but they will, of course, never trigger. It is also important to remember that a single collector can serve hundreds of sources (such as workstations), so the loss of data flow from even one collector can mean losing monitoring visibility for a significant portion of the infrastructure.
How to detect: The process of locating sources that are not transmitting data can be broken down into two components.
Checking collector health. Find the status of collectors (see the support website for the steps to do this in Kaspersky SIEM) and identify those with a status of Offline, Stopped, Disabled, and so on.
Checking the event flow. In Kaspersky SIEM, this can be done by gathering statistics using the following query (counting the number of events received from each collector over a specific time period):
SELECT count(ID), CollectorID, CollectorName FROM `events` GROUP BY CollectorID, CollectorName ORDER BY count(ID)
It is essential to specify an optimal time range for collecting these statistics. Too large a range can increase the load on the SIEM, while too small a range may provide inaccurate information for a one-time check – especially for sources that transmit telemetry relatively infrequently, say, once a week. Therefore, it is advisable to choose a smaller time window, such as 2–4 days, but run several queries for different periods in the past.
Additionally, for a more comprehensive approach, it is recommended to use built-in functionality or custom logic implemented via correlation rules and lists to monitor event flow. This will help automate the process of detecting problems with sources.
Event source coverage
Problem: The system is not receiving events from all sources of a particular type that exist in the infrastructure. For example, the company uses workstations and servers running Windows. During SIEM deployment, workstations are immediately connected for monitoring, while the server segment is postponed for one reason or another. As a result, the SIEM receives events from Windows systems, the flow is normalized, and correlation rules work, but an incident in the unmonitored server segment would go unnoticed.
How to detect: Below are query variations that can be used to search for unconnected sources.
SELECT count(distinct, DeviceAddress), DeviceVendor, DeviceProduct FROM events GROUP BY DeviceVendor, DeviceProduct ORDER BY count(ID)
SELECT count(distinct, DeviceHostName), DeviceVendor, DeviceProduct FROM events GROUP BY DeviceVendor, DeviceProduct ORDER BY count(ID)
We have split the query into two variations because, depending on the source and the DNS integration settings, some events may contain either a DeviceAddress or DeviceHostName field.
These queries will help determine the number of unique data sources sending logs of a specific type. This count must be compared against the actual number of sources of that type, obtained from the system owners.
Retaining raw data
Raw data can be useful for developing custom normalizers or for storing events not used in correlation that might be needed during incident investigation. However, careless use of this setting can cause significantly more harm than good.
Problem: Enabling the Keep raw event option effectively doubles the event size in the database, as it stores two copies: the original and the normalized version. This is particularly critical for high-volume collectors receiving events from sources like NetFlow, DNS, firewalls, and others. It is worth noting that this option is typically used for testing a normalizer but is often forgotten and left enabled after its configuration is complete.
How to detect: This option is applied at the normalizer level. Therefore, it is necessary to review all active normalizers and determine whether retaining raw data is required for their operation.
Normalization
As with the absence of events from sources, normalization issues lead to detection logic failing, as this logic relies on finding specific information in a specific event field.
Problem: Several issues related to normalization can be identified:
The event flow is not being normalized at all.
Events are only partially normalized – this is particularly relevant for custom, non-out-of-the-box normalizers.
The normalizer being used only parses headers, such as syslog_headers, placing the entire event body into a single field, this field most often being Message.
An outdated default normalizer is being used.
How to detect: Identifying normalization issues is more challenging than spotting source problems due to the high volume of telemetry and variety of parsers. Here are several approaches to narrowing the search:
First, check which normalizers supplied with the SIEM the organization uses and whether their versions are up to date. In our assessments, we frequently encounter auditd events being normalized by the outdated normalizer, Linux audit and iptables syslog v2 for Kaspersky SIEM. The new normalizer completely reworks and optimizes the normalization schema for events from this source.
Execute the query:
SELECT count(ID), DeviceProduct, DeviceVendor, CollectorName FROM `events` GROUP BY DeviceProduct, DeviceVendor, CollectorName ORDER BY count(ID)
This query gathers statistics on events from each collector, broken down by the DeviceVendor and DeviceProduct fields. While these fields are not mandatory, they are present in almost any normalization schema. Therefore, their complete absence or empty values may indicate normalization issues. We recommend including these fields when developing custom normalizers.
To simplify the identification of normalization problems when developing custom normalizers, you can implement the following mechanism. For each successfully normalized event, add a Name field, populated from a constant or the event itself. For a final catch-all normalizer that processes all unparsed events, set the constant value: Name = unparsed event. This will later allow you to identify non-normalized events through a simple search on this field.
Detection logic coverage
Collected events alone are, in most cases, only useful for investigating an incident that has already been identified. For a SIEM to operate to its full potential, it requires detection logic to be developed to uncover probable security incidents.
Problem: The mean correlation rule coverage of sources, determined across all our assessments, is 43%. While this figure is only a ballpark figure – as different source types provide different information – to calculate it, we defined “coverage” as the presence of at least one correlation rule for a source. This means that for more than half of the connected sources, the SIEM is not actively detecting. Meanwhile, effort and SIEM resources are spent on connecting, maintaining, and configuring these sources. In some cases, this is formally justified, for instance, if logs are only needed for regulatory compliance. However, this is an exception rather than the rule.
We do not recommend solving this problem by simply not connecting sources to the SIEM. On the contrary, sources should be connected, but this should be done concurrently with the development of corresponding detection logic. Otherwise, it can be forgotten or postponed indefinitely, while the source pointlessly consumes system resources.
How to detect: This brings us back to auditing, a process that can be greatly aided by creating and maintaining a register of developed detection logic. Given that not every detection logic rule explicitly states the source type from which it expects telemetry, its description should be added to this register during the development phase.
If descriptions of the correlation rules are not available, you can refer to the following:
The name of the detection logic. With a standardized approach to naming correlation rules, the name can indicate the associated source or at least provide a brief description of what it detects.
The use of fields within the rules, such as DeviceVendor, DeviceProduct (another argument for including these fields in the normalizer), Name, DeviceAction, DeviceEventCategory, DeviceEventClassID, and others. These can help identify the actual source.
Excessive alerts generated by the detection logic
One criterion for correlation rules effectiveness is a low false positive rate.
Problem: Detection logic generates an abnormally high number of alerts that are physically impossible to process, regardless of the size of the SOC team.
How to detect: First and foremost, detection logic should be tested during development and refined to achieve an acceptable false positive rate. However, even a well-tuned correlation rule can start producing excessive alerts due to changes in the event flow or connected infrastructure. To identify these rules, we recommend periodically running the following query:
SELECT count(ID), Name FROM `events` WHERE Type = 3 GROUP BY Name ORDER BY count(ID)
In Kaspersky SIEM, a value of 3 in the Type field indicates a correlation event.
Subsequently, for each identified rule with an anomalous alert count, verify the correctness of the logic it uses and the integrity of the event stream on which it triggered.
Depending on the issue you identify, the solution may involve modifying the detection logic, adding exceptions (for example, it is often the case that 99% of the spam originates from just 1–5 specific objects, such as an IP address, a command parameter, or a URL), or adjusting event collection and normalization.
Lack of integration with indicators of compromise
SIEM integrations with other systems are generally a critical part of both event processing and alert enrichment. In at least one specific case, their presence directly impacts detection performance: integration with technical Threat Intelligence data or IoCs (indicators of compromise).
A SIEM allows conveniently checking objects against various reputation databases or blocklists. Furthermore, there are numerous sources of this data that are ready to integrate natively with a SIEM or require minimal effort to incorporate.
Problem: There is no integration with TI data.
How to detect: Generally, IoCs are integrated into a SIEM at the system configuration level during deployment or subsequent optimization. The use of TI within a SIEM can be implemented at various levels:
At the data source level. Some sources, such as NGFWs, add this information to events involving relevant objects.
At the SIEM native functionality level. For example, Kaspersky SIEM integrates with CyberTrace indicators, which add object reputation information at the moment of processing an event from a source.
At the detection logic level. Information about IoCs is stored in various active lists, and correlation rules match objects against these to enrich the event.
Furthermore, TI data does not appear in a SIEM out of thin air. It is either provided by external suppliers (commercially or in an open format) or is part of the built-in functionality of the security tools in use. For instance, various NGFW systems can additionally check the reputation of external IP addresses or domains that users are accessing. Therefore, the first step is to determine whether you are receiving information about indicators of compromise and in what form (whether external providers’ feeds have been integrated and/or the deployed security tools have this capability). It is worth noting that receiving TI data only at the security tool level does not always cover all types of IoCs.
If data is being received in some form, the next step is to verify that the SIEM is utilizing it. For TI-related events coming from security tools, the SIEM needs a correlation rule developed to generate alerts. Thus, checking integration in this case involves determining the capabilities of the security tools, searching for the corresponding events in the SIEM, and identifying whether there is detection logic associated with these events. If events from the security tools are absent, the source audit configuration should be assessed to see if the telemetry type in question is being forwarded to the SIEM at all. If normalization is the issue, you should assess parsing accuracy and reconfigure the normalizer.
If TI data comes from external providers, determine how it is processed within the organization. Is there a centralized system for aggregating and managing threat data (such as CyberTrace), or is the information stored in, say, CSV files?
In the former case (there is a threat data aggregation and management system) you must check if it is integrated with the SIEM. For Kaspersky SIEM and CyberTrace, this integration is handled through the SIEM interface. Following this, SIEM event flows are directed to the threat data aggregation and management system, where matches are identified and alerts are generated, and then both are sent back to the SIEM. Therefore, checking the integration involves ensuring that all collectors receiving events that may contain IoCs are forwarding those events to the threat data aggregation and management system. We also recommend checking if the SIEM has a correlation rule that generates an alert based on matching detected objects with IoCs.
In the latter case (threat information is stored in files), you must confirm that the SIEM has a collector and normalizer configured to load this data into the system as events. Also, verify that logic is configured for storing this data within the SIEM for use in correlation. This is typically done with the help of lists that contain the obtained IoCs. Finally, check if a correlation rule exists that compares the event flow against these IoC lists.
As the examples illustrate, integration with TI in standard scenarios ultimately boils down to developing a final correlation rule that triggers an alert upon detecting a match with known IoCs. Given the variety of integration methods, creating and providing a universal out-of-the-box rule is difficult. Therefore, in most cases, to ensure IoCs are connected to the SIEM, you need to determine if the company has developed that rule (the existence of the rule) and if it has been correctly configured. If no correlation rule exists in the system, we recommend creating one based on the TI integration methods implemented in your infrastructure. If a rule does exist, its functionality must be verified: if there are no alerts from it, analyze its trigger conditions against the event data visible in the SIEM and adjust it accordingly.
The SIEM is not kept up to date
For a SIEM to run effectively, it must contain current data about the infrastructure it monitors and the threats it’s meant to detect. Both elements change over time: new systems and software, users, security policies, and processes are introduced into the infrastructure, while attackers develop new techniques and tools. It is safe to assume that a perfectly configured and deployed SIEM system will no longer be able to fully see the altered infrastructure or the new threats after five years of running without additional configuration. Therefore, practically all components – event collection, detection, additional integrations for contextual information, and exclusions – must be maintained and kept up to date.
Furthermore, it is important to acknowledge that it is impossible to cover 100% of all threats. Continuous research into attacks, development of detection methods, and configuration of corresponding rules are a necessity. The SOC itself also evolves. As it reaches certain maturity levels, new growth opportunities open up for the team, requiring the utilization of new capabilities.
Problem: The SIEM has not evolved since its initial deployment.
How to detect: Compare the original statement of work or other deployment documentation against the current state of the system. If there have been no changes, or only minimal ones, it is highly likely that your SIEM has areas for growth and optimization. Any infrastructure is dynamic and requires continuous adaptation.
Other issues with SIEM implementation and operation
In this article, we have outlined the primary problems we identify during SIEM effectiveness assessments, but this list is not exhaustive. We also frequently encounter:
Mismatch between license capacity and actual SIEM load. The problem is almost always the absence of events from sources, rather than an incorrect initial assessment of the organization’s needs.
Lack of user rights management within the system (for example, every user is assigned the administrator role).
Poor organization of customizable SIEM resources (rules, normalizers, filters, and so on). Examples include chaotic naming conventions, non-optimal grouping, and obsolete or test content intermixed with active content. We have encountered confusing resource names like [dev] test_Add user to admin group_final2.
Use of out-of-the-box resources without adaptation to the organization’s infrastructure. To maximize a SIEM’s value, it is essential at a minimum to populate exception lists and specify infrastructure parameters: lists of administrators and critical services and hosts.
Disabled native integrations with external systems, such as LDAP, DNS, and GeoIP.
Generally, most issues with SIEM effectiveness stem from the natural degradation (accumulation of errors) of the processes implemented within the system. Therefore, in most cases, maintaining effectiveness involves structuring these processes, monitoring the quality of SIEM engagement at all stages (source onboarding, correlation rule development, normalization, and so on), and conducting regular reviews of all system components and resources.
Conclusion
A SIEM is a powerful tool for monitoring and detecting threats, capable of identifying attacks at various stages across nearly any point in an organization’s infrastructure. However, if improperly configured and operated, it can become ineffective or even useless while still consuming significant resources. Therefore, it is crucial to periodically audit the SIEM’s components, settings, detection rules, and data sources.
If a SOC is overloaded or otherwise unable to independently identify operational issues with its SIEM, we offer Kaspersky SIEM platform users a service to assess its operation. Following the assessment, we provide a list of recommendations to address the issues we identify. That being said, it is important to clarify that these are not strict, prescriptive instructions, but rather highlight areas that warrant attention and analysis to improve the product’s performance, enhance threat detection accuracy, and enable more efficient SIEM utilization.
We are thrilled to announce the General Availability of Cloudflare Log Explorer, a powerful new product designed to bring observability and forensics capabilities directly into your Cloudflare dashboard. Built on the foundation of Cloudflare's vast global network, Log Explorer leverages the unique position of our platform to provide a comprehensive and contextualized view of your environment.Security teams and developers use Cloudflare to detect and mitigate threats in real-time and to optimize
We are thrilled to announce the General Availability of Cloudflare Log Explorer, a powerful new product designed to bring observability and forensics capabilities directly into your Cloudflare dashboard. Built on the foundation of Cloudflare's vast global network, Log Explorer leverages the unique position of our platform to provide a comprehensive and contextualized view of your environment.
Security teams and developers use Cloudflare to detect and mitigate threats in real-time and to optimize application performance. Over the years, users have asked for additional telemetry with full context to investigate security incidents or troubleshoot application performance issues without having to forward data to third party log analytics and Security Information and Event Management (SIEM) tools. Besides avoidable costs, forwarding data externally comes with other drawbacks such as: complex setups, delayed access to crucial data, and a frustrating lack of context that complicates quick mitigation.
Log Explorer has been previewed by several hundred customers over the last year, and they attest to its benefits:
“Having WAF logs (firewall events) instantly available in Log Explorer with full context — no waiting, no external tools — has completely changed how we manage our firewall rules. I can spot an issue, adjust the rule with a single click, and immediately see the effect. It’s made tuning for false positives faster, cheaper, and far more effective.”
“While we use Logpush to ingest Cloudflare logs into our SIEM, when our development team needs to analyze logs, it can be more effective to utilize Log Explorer. SIEMs make it difficult for development teams to write their own queries and manipulate the console to see the logs they need. Cloudflare's Log Explorer, on the other hand, makes it much easier for dev teams to look at logs and directly search for the information they need.”
With Log Explorer, customers have access to Cloudflare logs with all the context available within the Cloudflare platform. Compared to external tools, customers benefit from:
Reduced cost and complexity: Drastically reduce the expense and operational overhead associated with forwarding, storing, and analyzing terabytes of log data in external tools.
Faster detection and triage: Access Cloudflare-native logs directly, eliminating cumbersome data pipelines and the ingest lags that delay critical security insights.
Accelerated investigations with full context: Investigate incidents with Cloudflare's unparalleled contextual data, accelerating your analysis and understanding of "What exactly happened?" and "How did it happen?"
Minimal recovery time: Seamlessly transition from investigation to action with direct mitigation capabilities via the Cloudflare platform.
Log Explorer is available as an add-on product for customers on our self serve or Enterprise plans. Read on to learn how each of the capabilities of Log Explorer can help you detect and diagnose issues more quickly.
Monitor security and performance issues with custom dashboards
Custom dashboards allow you to define the specific metrics you need in order to monitor unusual or unexpected activity in your environment.
Getting started is easy, with the ability to create a chart using natural language. A natural language interface is integrated into the chart create/edit experience, enabling you to describe in your own words the chart you want to create. Similar to the AI Assistant we announced during Security Week 2024, the prompt translates your language to the appropriate chart configuration, which can then be added to a new or existing custom dashboard.
As an example, you can create a dashboard for monitoring for the presence of Remote Code Execution (RCE) attacks happening in your environment. An RCE attack is where an attacker is able to compromise a machine in your environment and execute commands. The good news is that RCE is a detection available in Cloudflare WAF. In the dashboard example below, you can not only watch for RCE attacks, but also correlate them with other security events such as malicious content uploads, source IP addresses, and JA3/JA4 fingerprints. Such a scenario could mean one or more machines in your environment are compromised and being used to spread malware — surely, a very high risk incident!
A reliability engineer might want to create a dashboard for monitoring errors. They could use the natural language prompt to enter a query like “Compare HTTP status code ranges over time.” The AI model then decides the most appropriate visualization and constructs their chart configuration.
While you can create custom dashboards from scratch, you could also use an expert-curated dashboard template to jumpstart your security and performance monitoring.
Available templates include:
Bot monitoring: Identify automated traffic accessing your website
API Security: Monitor the data transfer and exceptions of API endpoints within your application
API Performance: See timing data for API endpoints in your application, along with error rates
Account Takeover: View login attempts, usage of leaked credentials, and identify account takeover attacks
Performance Monitoring: Identify slow hosts and paths on your origin server, and view time to first byte (TTFB) metrics over time
Security Monitoring: monitor attack distribution across top hosts and paths, correlate DDoS traffic with origin Response time to understand the impact of DDoS attacks.
Investigate and troubleshoot issues with Log Search
Continuing with the example from the prior section, after successfully diagnosing that some machines were compromised through the RCE issue, analysts can pivot over to Log Search in order to investigate whether the attacker was able to access and compromise other internal systems. To do that, the analyst could search logs from Zero Trust services, using context, such as compromised IP addresses from the custom dashboard, shown in the screenshot below:
Log Search is a streamlined experience including data type-aware search filters, or the ability to switch to a custom SQL interface for more powerful queries. Log searches are also available via a public API.
Save time and collaborate with saved queries
Queries built in Log Search can now be saved for repeated use and are accessible to other Log Explorer users in your account. This makes it easier than ever to investigate issues together.
Monitor proactively with Custom Alerting (coming soon)
With custom alerting, you can configure custom alert policies in order to proactively monitor the indicators that are important to your business.
Starting from Log Search, define and test your query. From here you can opt to save and configure a schedule interval and alerting policy. The query will run automatically on the schedule you define.
Tracking error rate for a custom hostname
If you want to monitor the error rate for a particular host, you can use this Log Search query to calculate the error rate per time interval:
SELECT SUBSTRING(EdgeStartTimeStamp, 1, 14) || '00:00' AS time_interval,
       COUNT() AS total_requests,
       COUNT(CASE WHEN EdgeResponseStatus >= 500 THEN 1 ELSE NULL END) AS error_requests,
       COUNT(CASE WHEN EdgeResponseStatus >= 500 THEN 1 ELSE NULL END) * 100.0 / COUNT() AS error_rate_percentage
 FROM http_requests
WHERE EdgeStartTimestamp >= '2025-06-09T20:56:58Z'
  AND EdgeStartTimestamp <= '2025-06-10T21:26:58Z'
  AND ClientRequestHost = 'customhostname.com'
GROUP BY time_interval
ORDER BY time_interval ASC;
Running the above query returns the following results. You can see the overall error rate percentage in the far right column of the query results.
Proactively detect malware
We can identify malware in the environment by monitoring logs from Cloudflare Secure Web Gateway. As an example, Katz Stealer is malware-as-a-service designed for stealing credentials. We can monitor DNS queries and HTTP requests from users within the company in order to identify any machines that may be infected with Katz Stealer malware.
And with custom alerts, you can configure an alert policy so that you can be notified via webhook or PagerDuty.
Maintain audit & compliance with flexible retention (coming soon)
With flexible retention, you can set the precise length of time you want to store your logs, allowing you to meet specific compliance and audit requirements with ease. Other providers require archiving or hot and cold storage, making it difficult to query older logs. Log Explorer is built on top of our R2 storage tier, so historical logs can be queried as easily as current logs.
How we built Log Explorer to run at Cloudflare scale
With Log Explorer, we have built a scalable log storage platform on top of Cloudflare R2 that lets you efficiently search your Cloudflare logs using familiar SQL queries. In this section, we’ll look into how we did this and how we solved some technical challenges along the way.
Log Explorer consists of three components: ingestors, compactors, and queriers. Ingestors are responsible for writing logs from Cloudflare’s data pipeline to R2. Compactors optimize storage files, so they can be queried more efficiently. Queriers execute SQL queries from users by fetching, transforming, and aggregating matching logs from R2.
During ingestion, Log Explorer writes each batch of log records to a Parquet file in R2. Apache Parquet is an open-source columnar storage file format, and it was an obvious choice for us: it’s optimized for efficient data storage and retrieval, such as by embedding metadata like the minimum and maximum values of each column across the file which enables the queriers to quickly locate the data needed to serve the query.
Log Explorer stores logs on a per-customer level, just like Cloudflare D1, so that your data isn't mixed with that of other customers. In Q3 2025, per-customer logs will allow you the flexibility to create your own retention policies and decide in which regions you want to store your data.
But how does Log Explorer find those Parquet files when you query your logs? Log Explorer leverages the Delta Lake open table format to provide a database table abstraction atop R2 object storage. A table in Delta Lake pairs data files in Parquet format with a transaction log. The transaction log registers every addition, removal, or modification of a data file for the table – it’s stored right next to the data files in R2.
Given a SQL query for a particular log dataset such as HTTP Requests or Gateway DNS, Log Explorer first has to load the transaction log of the corresponding Delta table from R2. Transaction logs are checkpointed periodically to avoid having to read the entire table history every time a user queries their logs.
Besides listing Parquet files for a table, the transaction log also includes per-column min/max statistics for each Parquet file. This has the benefit that Log Explorer only needs to fetch files from R2 that can possibly satisfy a user query. Finally, queriers use the min/max statistics embedded in each Parquet file to decide which row groups to fetch from the file.
Log Explorer processes SQL queries using Apache DataFusion, a fast, extensible query engine written in Rust, and delta-rs, a community-driven Rust implementation of the Delta Lake protocol. While standing on the shoulders of giants, our team had to solve some unique problems to provide log search at Cloudflare scale.
Log Explorer ingests logs from across Cloudflare’s vast global network, spanning more than 330 cities in over 125 countries. If Log Explorer were to write logs from our servers straight to R2, its storage would quickly fragment into a myriad of small files, rendering log queries prohibitively expensive.
Log Explorer’s strategy to avoid this fragmentation is threefold. First, it leverages Cloudflare’s data pipeline, which collects and batches logs from the edge, ultimately buffering each stream of logs in an internal system named Buftee. Second, log batches ingested from Buftee aren’t immediately committed to the transaction log; rather, Log Explorer stages commits for multiple batches in an intermediate area and “squashes” these commits before they’re written to the transaction log. Third, once log batches have been committed, a process called compaction merges them into larger files in the background.
While the open-source implementation of Delta Lake provides compaction out of the box, we soon encountered an issue when using it for our workloads. Stock compaction merges data files to a desired target size S by sorting the files in reverse order of their size and greedily filling bins of size S with them. By merging logs irrespective of their timestamps, this process distributed ingested batches randomly across merged files, destroying data locality. Despite compaction, a user querying for a specific time frame would still end up fetching hundreds or thousands of files from R2.
For this reason, we wrote a custom compaction algorithm that merges ingested batches in order of their minimum log timestamp, leveraging the min/max statistics mentioned previously. This algorithm reduced the number of overlaps between merged files by two orders of magnitude. As a result, we saw a significant improvement in query performance, with some large queries that had previously taken over a minute completing in just a few seconds.
Follow along for more updates
We're just getting started! We're actively working on even more powerful features to further enhance your experience with Log Explorer. Subscribe to the blog and keep an eye out for more updates in our Change Log to our observability and forensics offering soon.
In 2024, we announced Log Explorer, giving customers the ability to store and query their HTTP and security event logs natively within the Cloudflare network. Today, we are excited to announce that Log Explorer now supports logs from our Zero Trust product suite. In addition, customers can create custom dashboards to monitor suspicious or unusual activity.Every day, Cloudflare detects and protects customers against billions of threats, including DDoS attacks, bots, web application exploits, and
In 2024, we announced Log Explorer, giving customers the ability to store and query their HTTP and security event logs natively within the Cloudflare network. Today, we are excited to announce that Log Explorer now supports logs from our Zero Trust product suite. In addition, customers can create custom dashboards to monitor suspicious or unusual activity.
Every day, Cloudflare detects and protects customers against billions of threats, including DDoS attacks, bots, web application exploits, and more. SOC analysts, who are charged with keeping their companies safe from the growing spectre of Internet threats, may want to investigate these threats to gain additional insights on attacker behavior and protect against future attacks. Log Explorer, by collecting logs from various Cloudflare products, provides a single starting point for investigations. As a result, analysts can avoid forwarding logs to other tools, maximizing productivity and minimizing costs. Further, analysts can monitor signals specific to their organizations using custom dashboards.
Zero Trust dataset support in Log Explorer
Log Explorer stores your Cloudflare logs for a 30-day retention period so that you can analyze them natively and in a single interface, within the Cloudflare Dashboard. Cloudflare log data is diverse, reflecting the breadth of capabilities available. For example, HTTP requests contain information about the client such as their IP address, request method, autonomous system (ASN), request paths, and TLS versions used. Additionally, Cloudflare’s Application Security WAF Detections enrich these HTTP request logs with additional context, such as the WAF attack score, to identify threats.
Today we are announcing that seven additional Cloudflare product datasets are now available in Log Explorer. These seven datasets are the logs generated from our Zero Trust product suite, and include logs from Access, Gateway DNS, Gateway HTTP, Gateway Network, CASB, Zero
By reviewing Access logs and HTTP request logs, we can reveal attempts to access resources or systems without proper permissions, including brute force password attacks, indicating potential security breaches or malicious activity.
Below, we filter Access Logs on the Allowed field, to see activity related to unauthorized access.
By then reviewing the HTTP logs for the requests identified in the previous query, we can assess if bot networks are the source of unauthorized activity.
With this information, you can craft targeted Custom Rules to block the offending traffic.
Detecting malware
Cloudflare's Web Gateway can track which websites users are accessing, allowing administrators to identify and block access to malicious or inappropriate sites. These logs can be used to detect if a user’s machine or account is compromised by malware attacks. When reviewing logs, this may become apparent when we look for records that show a rapid succession of attempts to browse known malicious sites, such as hostnames that have long strings of seemingly random characters that hide their true destination. In this example, we can query logs looking for requests to a spoofed YouTube URL.
Monitoring what matters using custom dashboards
Security monitoring is not one size fits all. For instance, companies in the retail or financial industries worry about fraud, while every company is concerned about data exfiltration, of information like trade secrets. And any form of personally identifiable information (PII) is a target for data breaches or ransomware attacks.
While log exploration helps you react to threats, our new custom dashboards allow you to define the specific metrics you need in order to monitor threats you are concerned about.
Getting started is easy, with the ability to create a chart using natural language. A natural language interface is integrated into the chart create/edit experience, enabling you to describe in your own words the chart you want to create. Similar to the AI Assistant we announced during Security Week 2024, the prompt translates your language to the appropriate chart configuration, which can then be added to a new or existing custom dashboard.
Use a prompt: Enter a query like “Compare status code ranges over time”. The AI model decides the most appropriate visualization and constructs your chart configuration.
Customize your chart: Select the chart elements manually, including the chart type, title, dataset to query, metrics, and filters. This option gives you full control over your chart’s structure.
Video shows entering a natural language description of desired metric “compare status code ranges over time”, preview chart shown is a time series grouped by error code ranges, selects “add chart” to save to dashboard.
For more help getting started, we have some pre-built templates that you can use for monitoring specific uses. Available templates currently include:
Bot monitoring: Identify automated traffic accessing your website
API Security: Monitor the data transfer and exceptions of API endpoints within your application
API Performance: See timing data for API endpoints in your application, along with error rates
Account Takeover: View login attempts, usage of leaked credentials, and identify account takeover attacks
Performance Monitoring: Identify slow hosts and paths on your origin server, and view time to first byte (TTFB) metrics over time
Templates provide a good starting point, and once you create your dashboard, you can add or remove individual charts using the same natural language chart creator.
Video shows editing chart from an existing dashboard and moving individual charts via drag and drop.
Example use cases
Custom dashboards can be used to monitor for suspicious activity, or to keep an eye on performance and errors for your domains. Let’s explore some examples of suspicious activity that we can monitor using custom dashboards.
Take, for example, our use case from above: investigating unauthorized access. With custom dashboards, you can create a dashboard using the Account takeover template to monitor for suspicious login activity related to your domain.
As another example, spikes in requests or errors are common indicators that something is wrong, and they can sometimes be signals of suspicious activity. With the Performance Monitoring template, you can view origin response time and time to first byte metrics as well as monitor for common errors. For example, in this chart, the spikes in 404 errors could be an indication of an unauthorized scan of your endpoints.
Seamlessly integrated into the Cloudflare platform
When using custom dashboards, if you observe a traffic pattern or spike in errors that you would like to further investigate, you can click the button to “View in Security Analytics” in order to drill down further into the data and craft custom WAF rules to mitigate the threat.
These tools, seamlessly integrated into the Cloudflare platform, will enable users to discover, investigate, and mitigate threats all in one place, reducing time to resolution and overall cost of ownership by eliminating the need to forward logs to third party security analysis tools. And because it is a native part of Cloudflare, you can immediately use the data from your investigation to craft targeted rules that will block these threats.
What’s next
Stay tuned as we continue to develop more capabilities in the areas of observability and forensics, with additional features including:
Custom alerts: create alerts based on specific metrics or anomalies
Scheduled query detections: craft log queries and run them on a schedule to detect malicious activity
More integration: further streamlining the journey between detect, investigate, and mitigate across the full Cloudflare platform.
How to get it
Current Log Explorer beta users get immediate access to the new custom dashboards feature. Pricing will be made available to everyone during Q2 2025. Between now and then, these features continue to be available at no cost.
Let us know if you are interested in joining our Beta program by completing this form, and a member of our team will contact you.