Visualização de leitura

Websites with an undefined trust level: avoiding the trap

Executive summary

  • A suspicious website is a web resource that cannot be definitively classified as phishing, but whose activities are unsafe. Such sites manipulate users, tricking them into voluntarily transferring money for non-existent services, signing up for hidden subscriptions, or disclosing personal data through carefully crafted terms of service. These include fake online stores, dubious crypto exchanges, investment platforms, and services with paid subscriptions.
  • Kaspersky has introduced a new web filtering category, “Sites with an undefined trust level,” into its security products (Kaspersky Premium, Android and iOS apps, etc.). The system analyzes the domain name and age, IP address reputation, DNS configuration, HTTP security headers, and SSL certificate to automatically detect suspicious resources.
  • According to Kaspersky data for January 2026, the most widespread global threat is fake browser extensions that mimic security products — they were detected in 9 out of 10 regions analyzed worldwide. Such extensions intercept browser data, track user activity, hijack search queries, and inject ads.
  • Kaspersky’s regional statistics reveal the specific nature of these threats: in Africa, over 90% of the top 10 suspicious websites are online trading scam platforms; in Latin America, fake betting services predominate; in Russia, fake binary options brokers and “educational platforms” with fraudulent subscriptions lead the way; in CIS countries — crypto scams and bots for inflating engagement.
  • Key indicators of a suspicious website to check: a strange domain name with numbers or random characters, cheap top-level domains (.xyz, .top, .shop), a recently registered domain (less than 6 months old according to WHOIS data), unrealistic promises (“100% guaranteed income,” “up to 300% profit”), lack of company contact information, and payments only via cryptocurrency or irreversible bank transfers.

Introduction

The online landscape is filled with various traps lying in wait for users. One such threat involves websites that can’t be strictly classified as phishing, yet whose activities are inherently unsafe. These sites often operate on the fringes of the law, even if they aren’t directly violating it. Sometimes they use a cleverly crafted Terms of Service document as a loophole. These agreements might include clauses such as no-refund policies or forced automatic subscription renewals.

Fake online stores, dubious financial platforms, and various online services that mimic legitimate business operations are all categorized as suspicious. Unlike actual phishing sites, which aim to steal sensitive data like banking credentials or passwords, these suspicious sites represent a far more cunning trap. Their goal is manipulation: tricking the victim into willingly paying for non-existent goods and services or signing them up for a subscription that’s nearly impossible to cancel. Beyond financial gain, these sketchy websites may also hunt for personal data to sell later on the dark web.

Our solutions categorize them as having an “undefined trust level”. This article explains what these sites look like, how to identify them, and what you can do to stay safe.

The dangers of shady websites

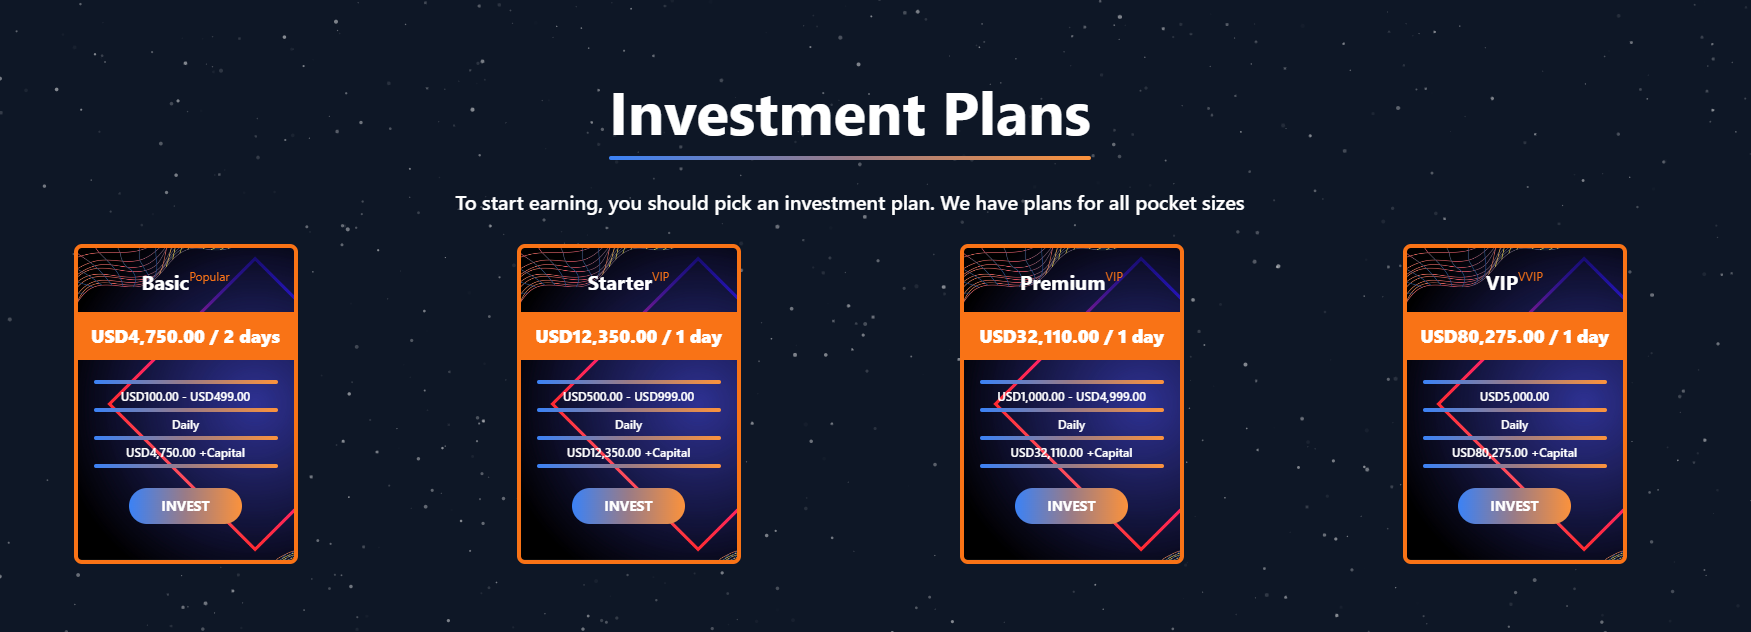
One of the biggest risks associated with making a purchase from an untrusted website that seems to be an online store is the financial loss and falling victim to fraud. Fake shops will entice you with attractive deals to get you hooked. After you pay, you may never receive what you paid for, or you may receive some cheap piece of unusable junk instead of the item you ordered. Investment or “guaranteed income” programs are another type of classic scam — they promise rapid returns, and once they take your deposits, they disappear without a trace.

Visiting or buying from untrusted suspicious websites can expose you to various risks that go beyond a single bad purchase. Fraudulent websites often collect your personal information even if you do not end up making a purchase. By completing a form or signing up for a “free offer”, you may be providing the scammer with access to your information.

Personal data collection can happen in a fairly straightforward and obvious way — for instance, through a standard order delivery form. In this scenario, attackers end up with sensitive information like the user’s full name, shipping and billing addresses, phone number, email address, and, of course, payment details. As we’ve previously discussed, fraudsters sell this kind of information, and there’re countless ways it can be used down the line. For example, this data might be leveraged for spam campaigns or more serious threats like stalking or targeted attacks.

Common types of suspicious sites

Let’s take a closer look at the different types of shady sites out there and how interacting with them can lead to financial loss, data leaks, the unauthorized use of personal information, and other consequences.

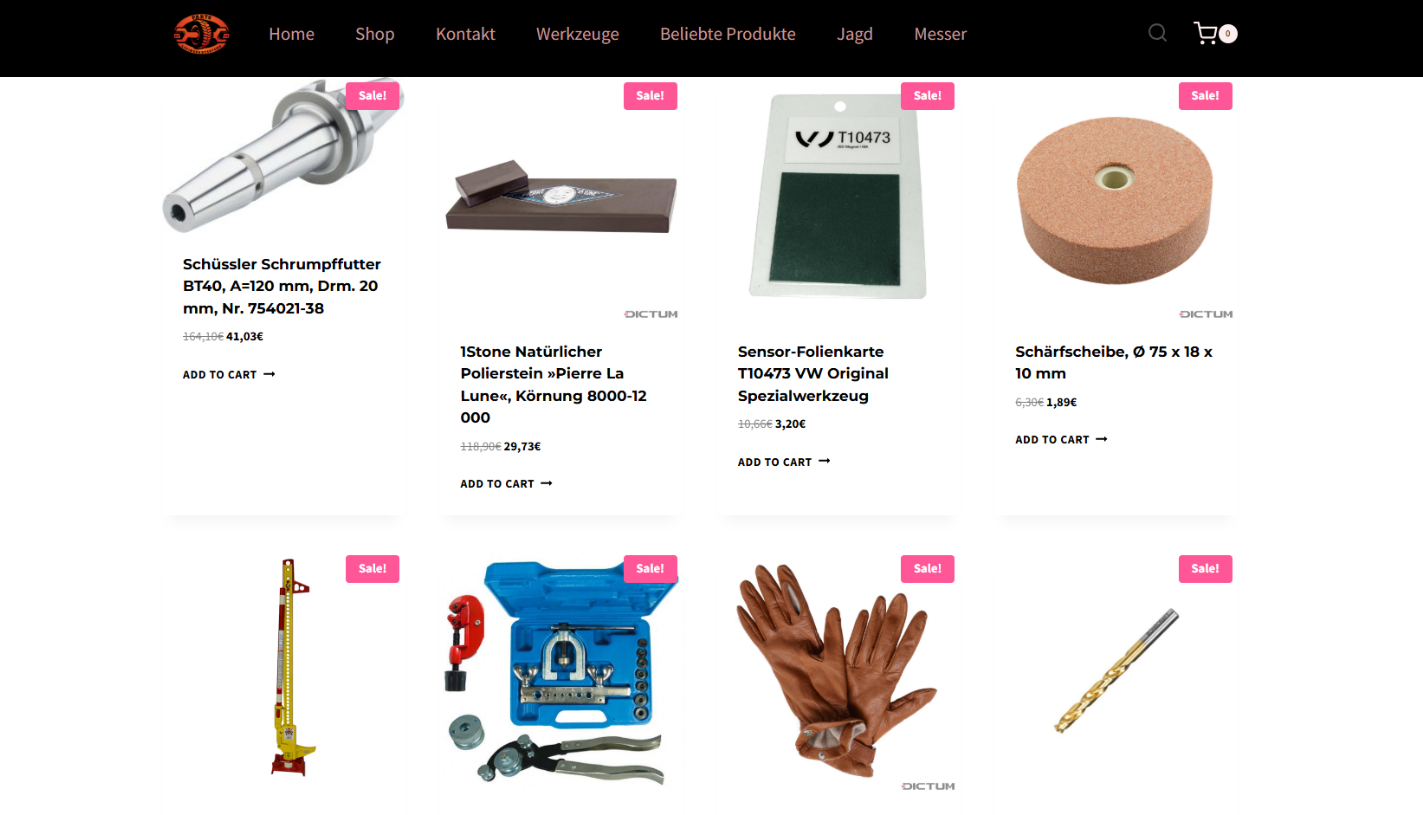
It’s worth noting that rogue websites can masquerade as legitimate ones in almost any industry. The first type of fraudulent site we’ll look at is fake online stores. These can appear as clones of real brand websites or as standalone stores. Usually, the scam follows one of two paths: the buyer either receives a counterfeit or poor-quality product, or they receive nothing at all. These sites lure victims in with suspiciously low prices and “exclusive” deals. Often, users are subjected to psychological pressure: the time to make a purchase decision is purposefully limited, provoking the victim, as with any other scam, into making an impulse purchase.

Another common type of shady site includes online exchanges and trading platforms. These primarily target cryptocurrency, as the lack of legislative regulation for digital currency in certain countries makes them a magnet for fraudsters. These suspicious sites often lure victims with supposedly favorable exchange rates or other enticing gimmicks. If the user attempts to exchange cryptocurrency, their tokens are gone for good. Beyond simple exchanges, rogue sites offer investment services and even display a fake balance growth to appear credible. However, withdrawing funds is impossible; when the victim tries to cash out, they’re prompted to pay some fee or fictional tax.

Subscription traps are also worth noting, offering everything from psychological tests to online video streaming platforms. The hallmark of these sites is that they deliberately withhold critical information, such as recurring charges, or hide the fact it even exists. Typically, the scheme works like this: a user is offered a subscription for a nominal fee, like $1. While that seems attractive, the next charge – perhaps only a week later – might be as much as $50. This information is intentionally obscured, buried in fine print or tucked away in the Terms of Service where it’s harder to find. Legitimate services always clearly disclose subscription terms and provide an easy way to cancel before a trial period ends. Scam services, on the other hand, do everything possible to distract the user from the actual terms of use and subscription.

Shady sites can also masquerade as providers of mediation services, such as legal or real estate assistance. In reality, the service is either never delivered or provided in a stripped-down, incomplete form. For example, a user might be prompted to pay for a service that’s normally provided for free. The danger here lies not only in losing money for non-existent services but also in the significant risk of exposing personal data, such as ID details, taxpayer identification numbers, social security numbers, or driver’s license information. Once in the hands of attackers, this data can become a tool for executing further scams or targeted attacks.

On the whole, suspicious sites are fairly difficult to distinguish from legitimate, trustworthy services. Masquerading as a legitimate business is the primary goal of these sites, and the fraudulent schemes they employ are not always obvious. Nevertheless, there are protective measures as well as certain indicators that can help you suspect a site is unsafe for purchases or financial transactions.

How to identify suspicious or fraudulent websites

Despite the increasingly convincing attempts to create fake shops, the majority of them still lack the quality of real online stores, and there are many signs that may give them away. Some of these signs can be caught by the eye while others require a bit of technical investigation. By combining visual inspection, technical checks, and trusted online tools, you can protect yourself from financial loss or data theft.

Visual and manual clues

You don’t need to be a cybersecurity expert to catch many red flags just by observing the site’s domain, visuals, language and behavior. For instance, scam sites often have strange or randomly generated names, filled with numbers, underscores, hyphens, or meaningless words, like best-shop43.com. In addition, such vague top-level domains as .xyz, .top, or .shop are also frequently used in scams because they’re cheap and easy to register.

Furthermore, most fake stores sites look unprofessional, with poor visuals, pixelated images, mismatched fonts, or copied templates. Many fraudulent websites borrow layouts or logos from other brands or free templates, which makes them appear generic and sketchy.

Another major giveaway lies in the content itself. Be aware of persuasive language, unrealistic promises, or emotional triggers such as No KYC, Risk-free returns, 100% guaranteed income, Up to 300% profit, or Passive income with zero effort. Unrealistic deals are another red flag. If the products are listed at extremely low prices, continuous countdown timers, and “limited time only” messages that are often used to pressure you into making a quick purchase, it’s a clear tell of a fraudulent website.

Legitimate businesses always provide verifiable contact details, such as a physical address, company name, and customer support. On the contrary, scam sites hide this information. You may also notice the non-functioning pages, broken or suspicious links leading to unrelated external sites which indicate poor maintenance or malicious intent.

Another important signal is the website’s social media presence. Legitimate online businesses usually maintain at least one active social media account to promote their products and communicate with customers. In most cases, these businesses have long-established social media accounts with harmonized posting history and engagement from real users, consistency between the brand website and social media profiles (same name, logo, and links). The links to social media profiles from the website are usually direct. In contrast, fraudulent or deceptive websites often lack any meaningful social media presence or display signs of superficial or artificial activity. This may include missing social media accounts altogether, social media icons that lead to non-existent, inactive, or unrelated pages, or recently created profiles with very few posts and minimal user engagement. In some cases, comment sections are disabled or dominated by spam and automated content, suggesting an attempt to avoid public interaction rather than engage with customers.

Lastly, the payment options offered by the site can also tell a lot about its legitimacy. Be extremely cautious if a website only accepts cryptocurrency, wire transfers, or third-party P2P payments. These payment methods are irreversible and are preferred by scammers. Legitimate e-commerce platforms typically offer secure and reversible payment options, such as credit cards or trusted payment gateways that include buyer protection policies.

However, the absence or existence of any of these factors alone does not necessarily indicate malicious intent. It should be evaluated in combination with technical, linguistic, and behavioral indicators, rather than treated as a standalone signal of legitimacy.

Technical indicators to check

Looking into technical signs can reveal whether a website is trustworthy or potentially fraudulent.

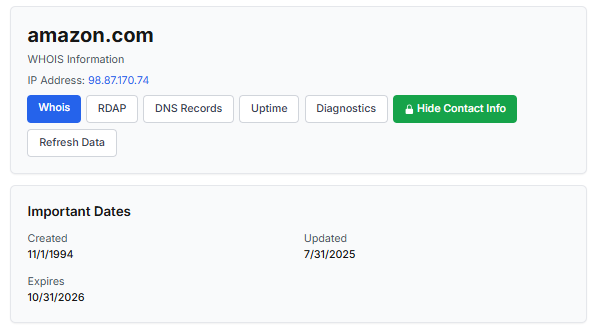
One of the first things to check is the domain age. Scam websites are often short-lived, appearing only for a few weeks or months before disappearing once users start reporting them. To check when the domain was created, use a WHOIS lookup. If it’s less than six months old, be cautious — especially for e-commerce or investment sites, where legitimacy and trust take time to build.

Let’s take a look at the registration details for the popular online marketplace Amazon. As we can see from the WHOIS information, it was registered in 1994.

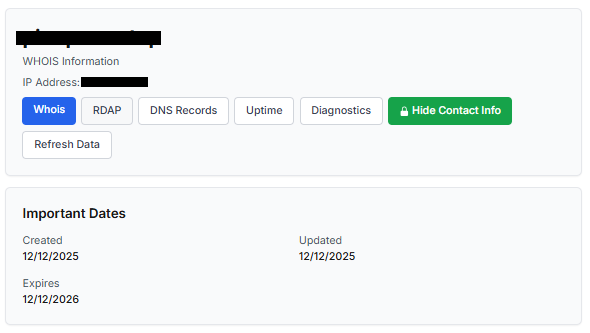
Meanwhile, a reported suspicious online store was created a couple of months ago.

Legitimate websites usually operate on stable hosting platforms and remain on the same IP addresses or networks for long periods. In contrast, fraudulent websites often move between servers (in most cases using a cheap shared hosting service) or reuse infrastructure already associated with abuse. Checking the IP address reputation can reveal if the website or the hosting server has previously been linked to suspicious activities. Even if the website looks legitimate, a poor IP reputation can expose it.

In addition to that, looking at the infrastructure behavior over time can reveal patterns about its legitimacy. Websites associated with fraudulent activity often show short lifespans, sudden spikes in activity, or rapid appearance and disappearance, which indicates a coordinated campaign rather than a legitimate business.

Another important clue is hidden ownership. When the WHOIS details show “Redacted for Privacy” or leaves the organization name blank, it may indicate that the website owner is deliberately hiding their identity.

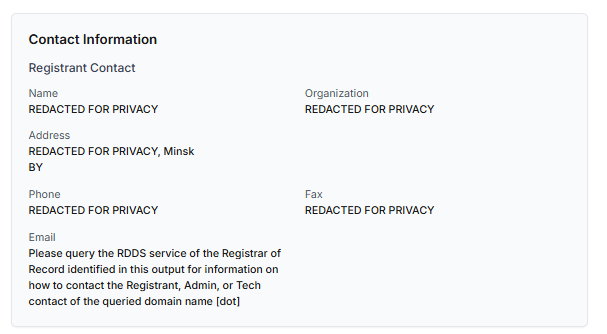
We should point out that while this can raise suspicion during investigations, hidden WHOIS data is not inherently malicious. Many legitimate businesses use privacy protection services for valid reasons. These may include protection from spam and phishing after public email addresses are taken from WHOIS databases, personal safety for small business owners, and brand protection to prevent competitors or malicious actors from targeting the registrant. This means that some businesses can use services like WHOIS Privacy Protection, Domains By Proxy, or PrivacyGuardian.org to remove the WHOIS data while still operating transparently on their websites through clear contact details, customer support channels, and legal pages (e.g. terms of use).

Therefore, hidden ownership should be treated as a contextual risk indicator, not a standalone proof of fraud. It becomes more suspicious when combined with other signals such as newly registered domains, and lack of legal information.

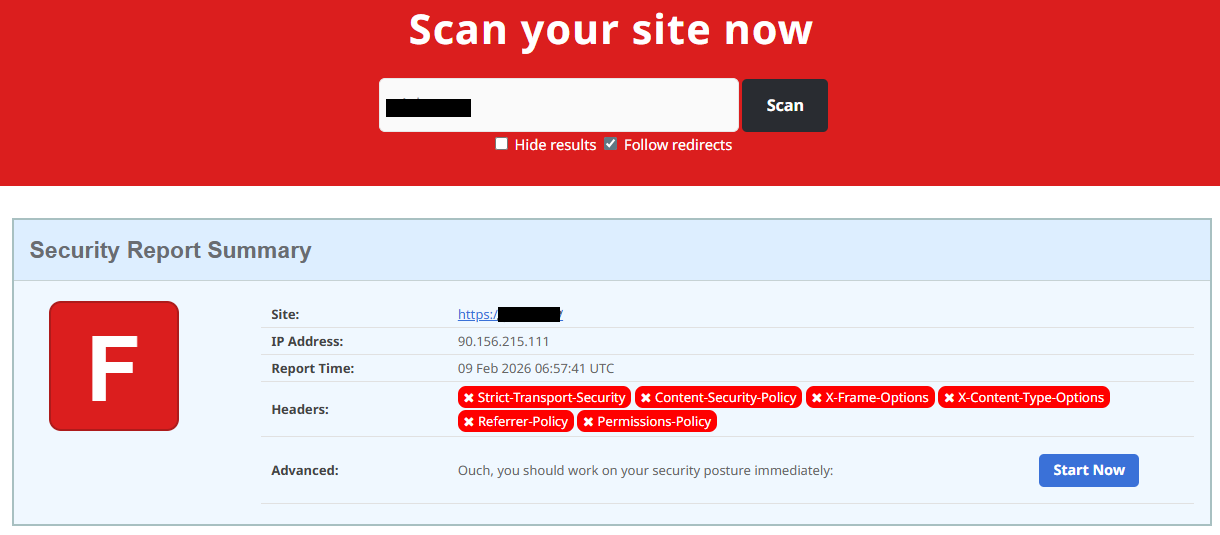
Next, you can check the security headers of the website. Legitimate websites are usually well maintained and include several key HTTP headers for protection. Some examples include:

  • Content-Security-Policy (CSP) provides strong defense against cross-site scripting (XSS) attacks by defining which scripts are allowed to run on the site and blocking any malicious JavaScript that could steal login data or inject fake forms.
  • HTTP Strict-Transport-Security (HSTS) forces browsers to connect to the site only over HTTPS. It ensures all communication is encrypted and prevents redirecting users to an insecure (HTTP) version of the site.
  • X-Frame-Options prevents clickjacking, which is a type of attack where a legitimate-looking button or link on a malicious page secretly performs another action in the background.
  • X-Content-Type-Options blocks MIME-type attacks by preventing browsers from misinterpreting file types.
  • Referrer-Policy controls how much information about your previous browsing (referrer URLs) is shared with other sites.

These headers form the “digital hygiene” of a website. Their absence doesn’t always mean a site is malicious, but it does suggest a lack of security awareness or professional maintenance — both strong reasons to be cautious.

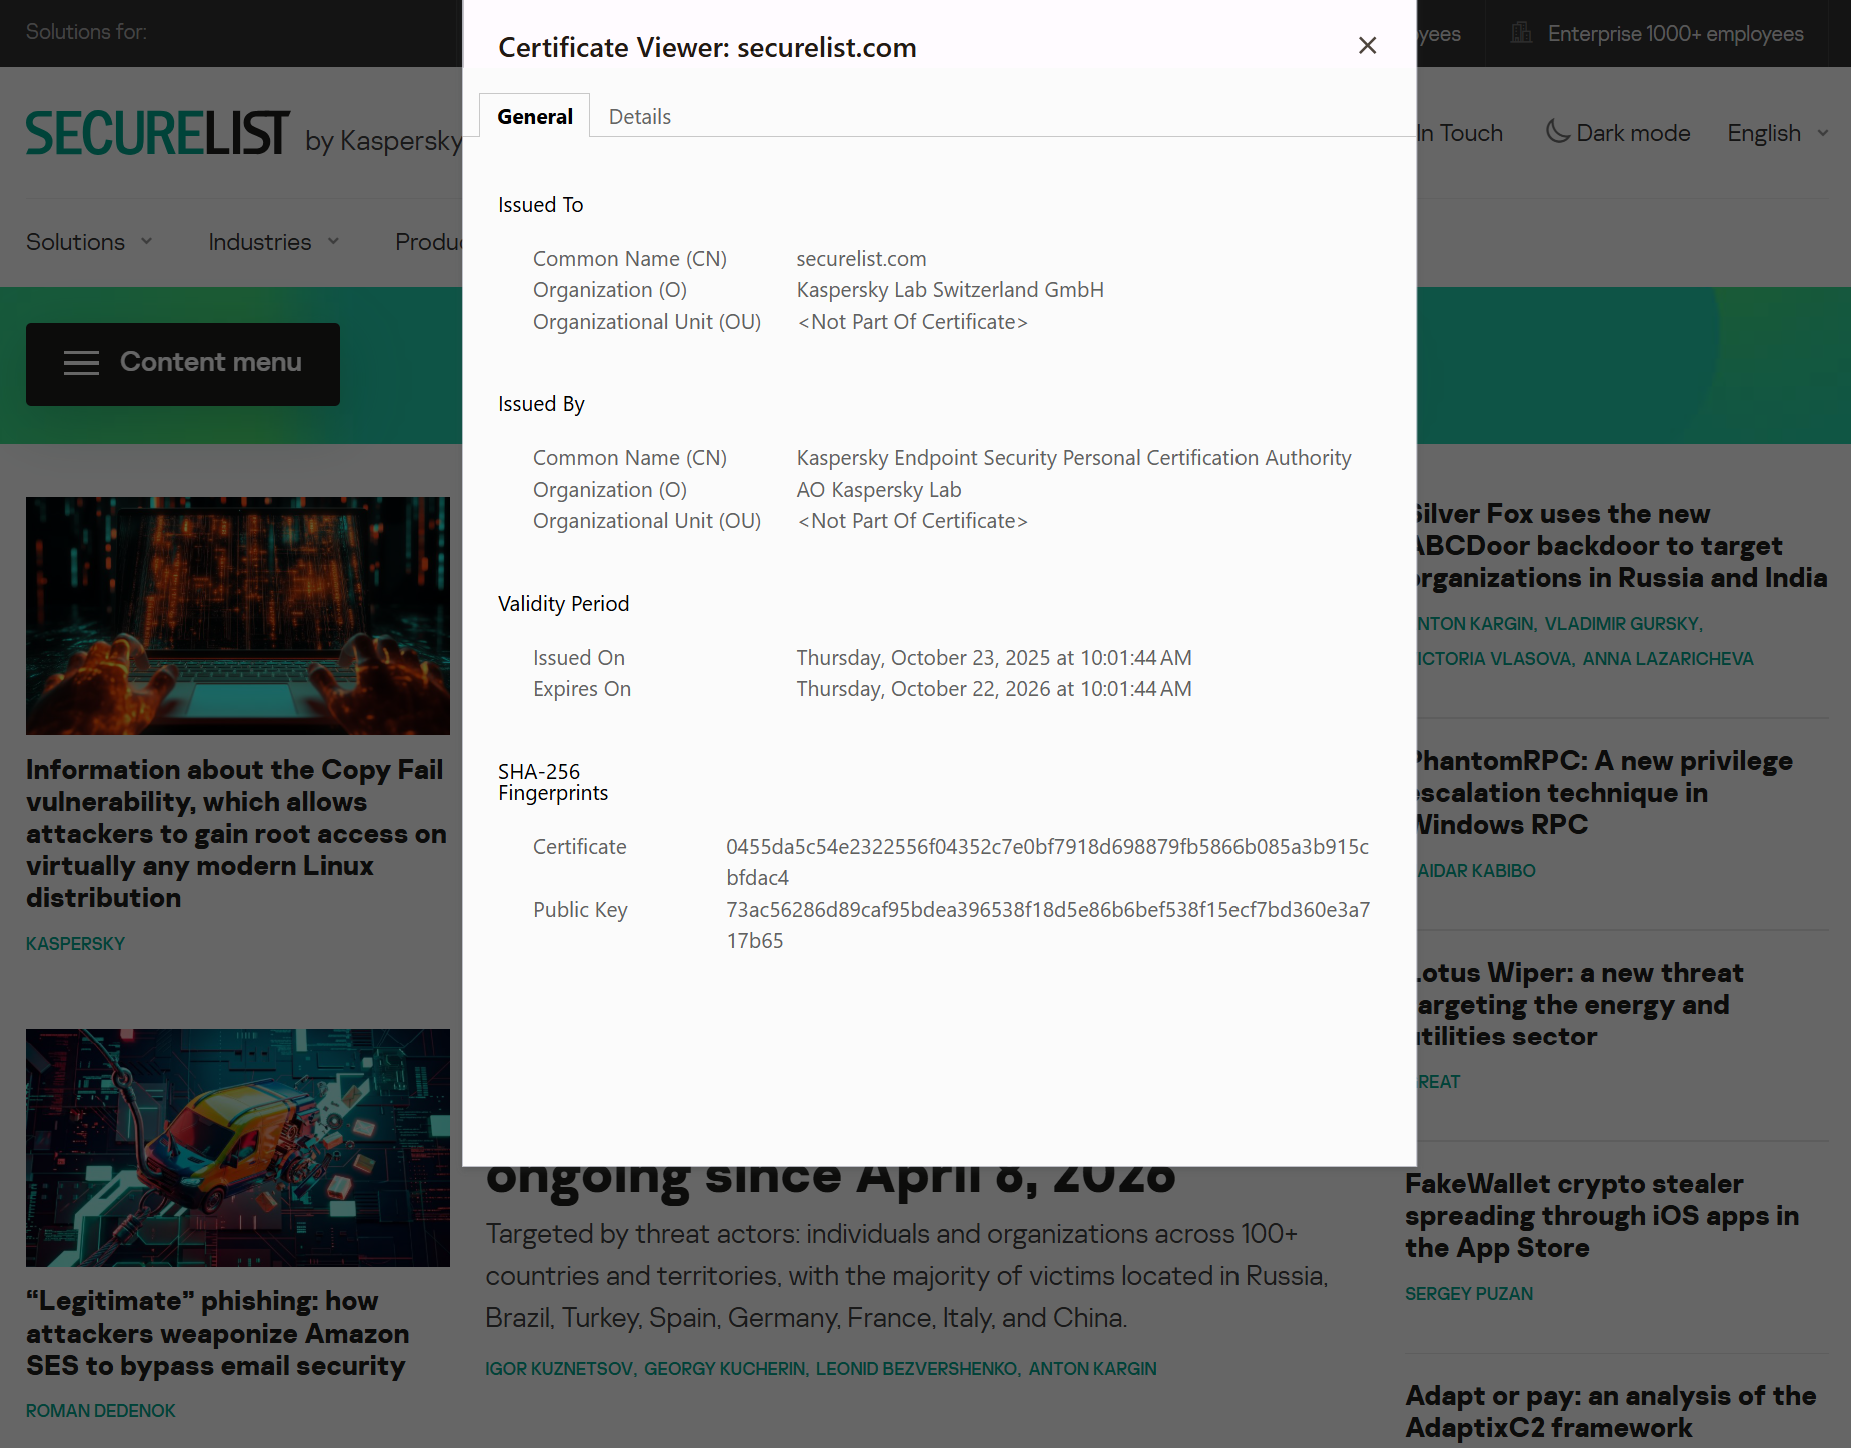
You should also check the SSL certificate. Scam sites may use self-signed or short-lived SSL certificates. You can inspect this by clicking the padlock icon in your browser’s address bar — if it says “not secure” or the certificate authority seems unfamiliar, that’s a red flag.

You can check the security headers and the SSL certificate by sending an HTTP request programmatically or by using some online service.

Another indicator that provides insight into how well a website is done and managed is DNS configurations. Legitimate businesses typically use reliable DNS providers and maintain consistent DNS records. Missing the name server NS or mail exchange MX records may indicate poor DNS configuration. In addition to NS and MX, reputable sites also configure SPF and DMARC records to protect their brand from email spoofing and phishing. Something scam website developers won’t bother with because they don’t intend to build a long-standing reputation.

You can check the configurations of DNS records either programmatically or by using an online service.

Another recommendation is to pay attention to website behavior. If there are frequent redirects, pop-up ads, or background requests to unknown domains, this may indicate unsafe scripting or tracking.

How to protect yourself

Tools and databases for detecting suspicious websites

We at Kaspersky have built an intelligent system for detecting suspicious web resources and added this new type of protection into many of our products, including Kaspersky Premium, Kaspersky for Android and iOS, and others. Our detection model is based on many factors, including but not limited to the following:

  • domain name and age,
  • IP reputation,
  • stability of the infrastructure used,
  • DNS configurations,
  • HTTP security headers,
  • digital identity and popularity of the web resource.

Kaspersky has been certified as a provider of effective protective technology for fake shop detection.

When a user tries to visit a site flagged as having an undefined trust level, our solutions show a warning to stop the visitor from becoming a victim of personal data leaks, financial losses or a bad purchase:

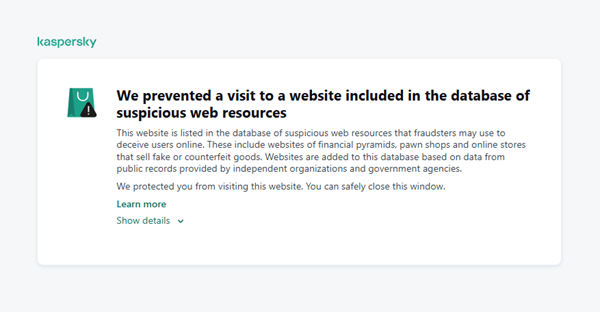
This component is on by default.

Moreover, there are several online tools and databases that can help assess a website’s legitimacy:

  • ScamAdviser analyzes trust based on WHOIS, server location, and web reputation.
  • APIVoid provides risk scoring using DNS, IP, and domain reputation databases.
  • National government databases often maintain official lists of fraudulent or blacklisted domains.

Preventive measures

To protect yourself from such threats, it might a good idea to take some additional preventive measures. Always double-check the URL and domain name, especially when you are about to click a link or make a payment. Make sure the site uses HTTPS and has a trusted certificate.

You can use standard browser tools to verify site security. For example, in Google Chrome, clicking the site information button (the lock or settings icon in the address bar) displays details about the connection security and the site’s certificate.

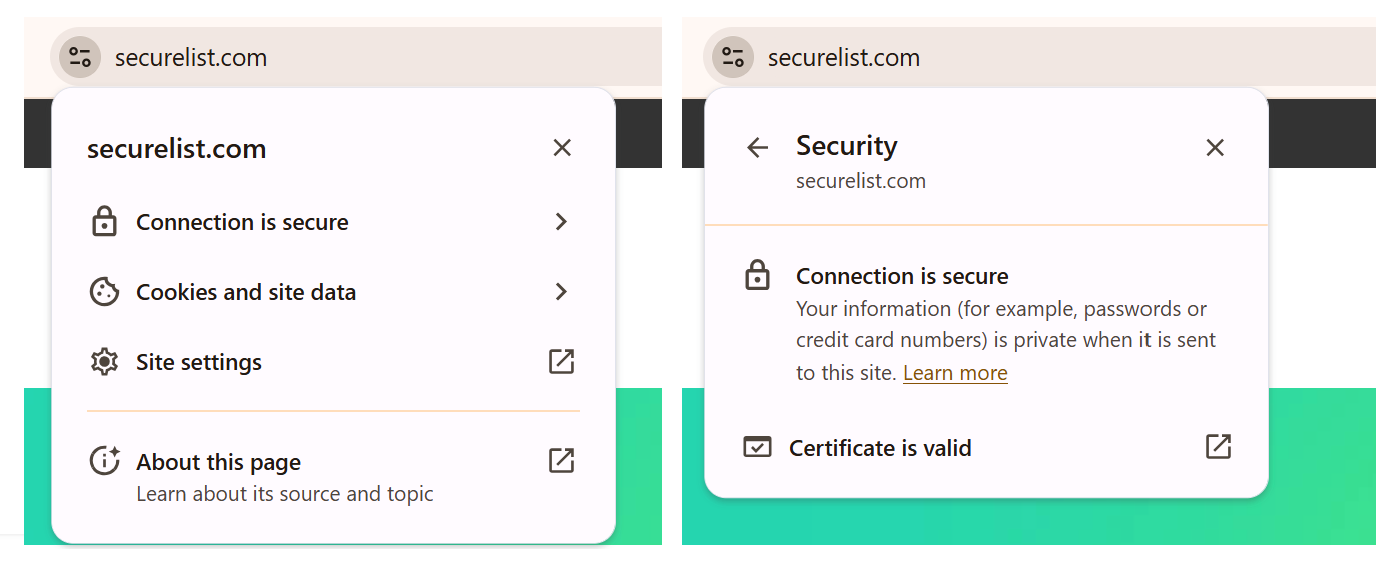
In the Security section, you can check whether the site supports HTTPS – it should say “Connection is secure” – and view the site’s digital certificate.

Additionally, keep reliable security software with real-time protection running on your device to stop you from accessing dangerous websites. Do not download any files or enter your personal information on websites that look unprofessional or suspicious. And finally, remember the golden rule: if a deal seems too good to be true, it often is.

If you realize that you’re on a scam website, it’s important to perform certain post-incident actions immediately. First, contact your bank or payment provider as soon as possible to block the transaction or card. Then, change your passwords for the services which might have been compromised, and run a full antivirus scan on your device to detect and remove any potential threats. Lastly, consider reporting the website to the cybercrime agency in your country or to the consumer protection agency. Sharing your experience online by leaving a review or warning will give notice to potential customers alike.

By staying careful and taking quick actions, you can significantly reduce the chances of being a target and help make the internet a safer place for everyone.

An overview of detection statistics for sites with an undefined trust level

To illustrate the types of suspicious sites prevalent in various regions around the world, we analyzed anonymized detection data from Kaspersky solutions for the “websites with an undefined trust level” category in January 2026. For each region, we identified the 10 most frequently encountered sites and calculated the share of each within that list. To maintain privacy, specific domains are not listed directly; instead, they’re described based on their functionality and characteristics.

Most visited suspicious sites

First, let’s examine the sites that appear across multiple regions, indicating a high prevalence.

In 9 out of the 10 regions analyzed, we encountered a suspicious image processing platform (*a*o*.com). This site positions itself as a photo editing tool, but in reality, it serves as an intermediary server for uploading images used in phishing and other campaigns. By interacting with such a site, users risk exposing personal data under the guise of uploading images or falling victim to a phishing attack.

Percentage of the *a*o*.com domain detections by region, January 2026 (download)

This site has the largest share of detections in the Russian Federation, where it ranks first in the TOP 10 with a 40.80% share. It is also prevalent in Latin American countries (21.70%) and the CIS (14.64%), while it’s least common in Canada at 0.24%.

The next site appeared in 7 regions. It consists of a landing page for a fake antivirus solution presented as a browser extension (*n*s*.com). This extension redirects the user to a fake search engine page allowing it to collect data and track user activity, specifically search queries.

Percentage of the *n*s*.com domain detections by region, January 2026 (download)

This site is most frequently detected in South Asia, with a share of 33.31%. Its presence in Canada and Oceania is roughly equal (15.47% and 15.09%, respectively). We recorded the lowest number of detections in Africa, at 2.99%.

Another suspicious browser extension appeared in the TOP 10 in 6 out of the 10 regions. It’s a fake privacy-enhancing tool hosted at *w*a*.com. Instead of providing the advertised privacy features, this extension carries a high risk of intercepting browser data. It can modify browser settings, harvest user data, and swap the default search engine for a fake one. Furthermore, it maintains full control over all browser traffic.

Percentage of the *w*a*.com domain detections by region, January 2026 (download)

This “service” has its largest share, 22.25%, in the Middle East and North Africa, and is also quite common in Canada (16.26%). It’s least frequently encountered in Latin America (5.38%) and East Asia (4.02%).

The site *o*r*.com appeared in five regional rankings. It’s a fake security service promising to provide online safety by warning users about malicious sites and dangerous search queries. This extension has the potential to steal cookies (including session cookies), inject advertisements, spoof login forms, and harvest browser history and search queries. We noted that this site made the TOP 10 in Africa (0.59%), the MENA (Middle East and North Africa) region (4.57%), Europe (5.61%), Canada (7.21%), and Oceania (1.93%).

In 4 out of the 10 regions, we identified several other recurring sites. One of them (*n*p*.xyz) mimics a repository for creative AI image generation prompts while capturing browser data. The domain hosting this site exhibits several red flags: it was recently registered, and the owner’s information is hidden. This site reached the TOP 10 in Africa (0.51%), the MENA region (7.04%), Latin America (22.54%, ranking first in that region), and South Asia (5.91%).

The second service (*i*s*.com) positions itself as a tool for safe searching, protecting the browser from threats, and verifying extensions. However, this is a typical browser hijacker, much like the others mentioned above. It made the TOP 10 in South Asia (8.03%), Oceania (17.97%), Europe (3.90%), and Canada (14.35%).

The third site (*h*t*.com) poses as a private browsing extension. In reality, it’s another potentially unwanted application designed for browser hijacking: it modifies settings, steals sensitive data (cookies, browser history, and queries), and can redirect the user to phishing pages. Users have specifically noted the difficulty involved in removing the extension. This site appears in the TOP 10 for the MENA region (10.17%), Canada (7.06%), Europe (3.81%), and Oceania (2.81%).

Another domain (*o*t*.com) that reached the TOP 10 in four regions is a service mimicking a browser extension for safe searching and web browsing. It’s dangerous because it injects ads and steals user data. It’s important to note that such extensions can be installed without explicit user consent – for example, via links embedded in other software. This service holds the number one spot in two regions: Canada (25.72%) and Oceania (30.92%), while also appearing in the TOP 10 for East Asia (8.01%) and Africa (0.88%).

Consequently, we can see that the majority of suspicious sites detected by our solutions worldwide are browser hijackers masquerading as security products. Nevertheless, other categories of sites also appear in the TOP 10.

Next, we’ll examine each region individually, focusing on descriptions of domains not previously covered. For clarity, the sites mentioned above will be marked as [MULTI-REGION], while those appearing in only two or three regions will include the names of those specific areas. We’ll observe several regional overlaps and similarities, allowing us to determine which types of suspicious sites are popular both within specific regions and globally.

Africa

Distribution of the TOP 10 suspicious websites in Africa, January 2026 (download)

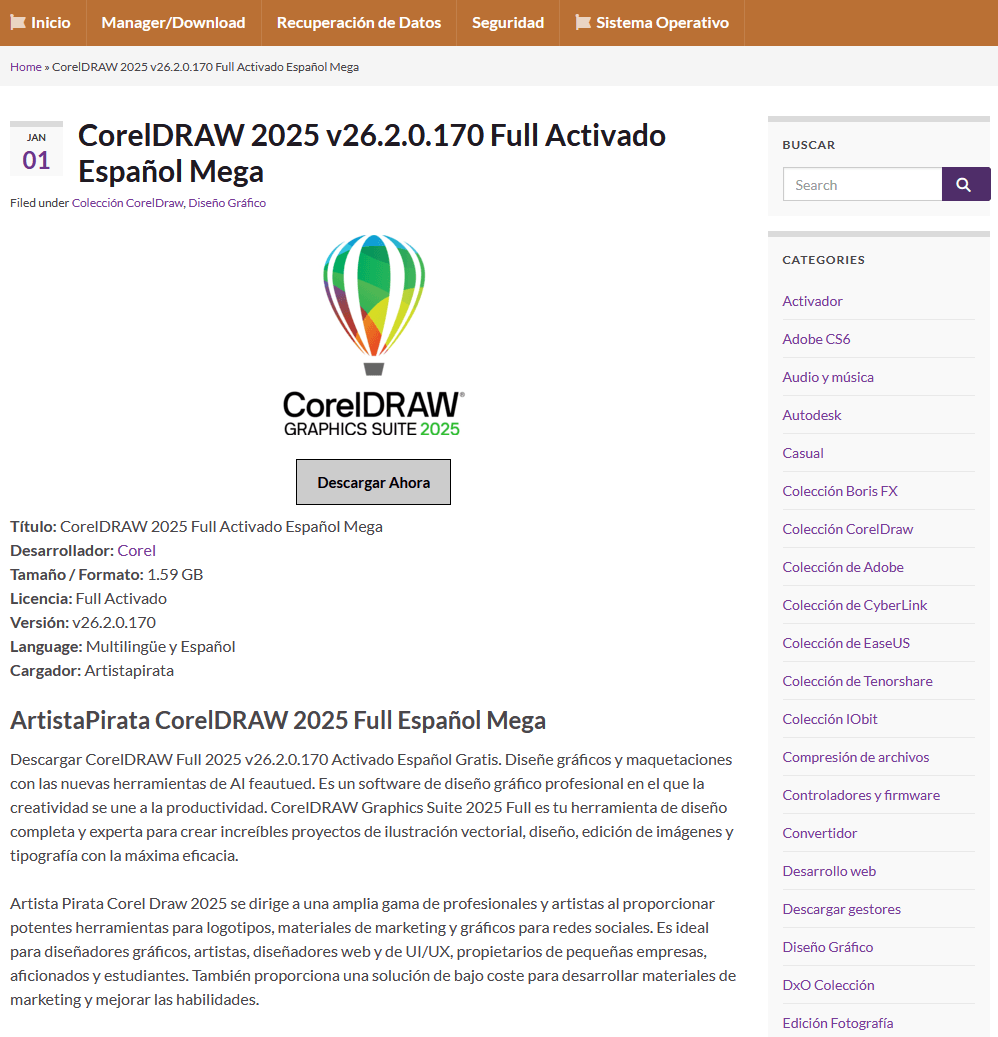
The three most prevalent domains in African countries are found exclusively in this region. All of them – *i*r*.world (60.27%), *m*a*.com (22.84%), and *e*p*.com (9.36%) – are potentially fraudulent online trading platforms suspected of using forged licenses. These sites employ classic scam schemes where it’s impossible to withdraw any alleged earnings. In fifth place is a domain we’ll also see in the European TOP 10, *r*e*.com (1.46%): a platform marketed as a tool for retail and semi-professional traders. It charges for services available elsewhere for free. Eighth place is held by a site that also appears in the Russian TOP 10: *a*c*.com (0.56%). This is a dubious AI tool that claims to offer free subscriptions to a premium graphics editor. In ninth place is a domain that also surfaces in the Canadian TOP 10: *u*e*.com (0.53%), a browser extension of the “web protection” variety that we’ve encountered previously.

In summary, the African region is dominated by financial scams within the online trading and brokerage sectors. These include fake platforms that make it impossible to withdraw funds and use fake licenses and classic schemes to steal users’ money. Additionally, Africa sees paid tools that duplicate free services and questionable AI-based subscriptions. The primary threat in this region is financial loss through fraudulent investment-themed sites.

MENA

Distribution of the TOP 10 suspicious websites in the Middle East and North Africa, January 2026 (download)

In the MENA region, the site *a*v*.su holds the top spot with a 28.64% share; notably, this site also appears in the TOP 10 for Russia. It markets itself as a tool for building custom VoIP-PBX systems. However, it has an extremely low trust rating and is frequently associated with phishing, and hidden redirects. Using this service carries significant risks, including data leaks, and financial loss.

Ranked seventh is *a*r*.foundation (6.32%), an AI bot allegedly designed for trading, which we also identified in the TOP 10 for Oceania. This service has been flagged as an investment scam operating as a pyramid scheme with the hallmarks of a Ponzi scheme.

The ranking is rounded out by two domains not found in any other region. The first one, *l*e*.pro (4.42%), is a spoof of a popular betting service. The second, *p*r*.group (2.21%), is a clone of a well-known broker. Both sites are scams.

In the MENA region, the landscape is dominated by fake VoIP services as well as counterfeits of financial and betting platforms, which attackers use to conduct phishing attacks, and perform hidden redirects. A significant portion of suspicious sites consists of fake online privacy tools and browser hijackers masquerading as security extensions. Ponzi schemes and cryptocurrency scams are also prominent. The primary risks for the region are data theft, and financial loss.

Latin America

Distribution of the TOP 10 suspicious websites in Latin America, January 2026 (download)

In Latin America, we identified five popular suspicious sites specific to this region, which is unusual compared to other areas where more overlaps are typically observed. Ranking third with a share of 10.81% is the fake betting platform *b*e*.net. In fifth place is *r*e*.club, an illegitimate clone of a well-known bookmaker, with a share of 7.82%.

Further down the list of local threats are *a*a*.com.br (7.02%), a Brazilian Ponzi scam; *s*a*.com (5.07%), which offers dubious investment programs; and *t*r*.com (4.53%), a potentially dangerous trading platform.

In Latin America, the most-visited suspicious sites are betting-themed scams, including both clones of legitimate sites and those built from scratch. Also prevalent are Ponzi schemes, fake investment programs, and dubious online brokers. A significant portion of these sites consists of browser hijackers posing as crypto platforms and AI bots. The primary threats in Latin American countries include financial loss through gambling and Ponzi schemes, as well as the theft of NFTs and other tokens.

East Asia

Distribution of the TOP 10 suspicious websites in East Asia, January 2026 (download)

In the East Asian TOP 10, we see the highest concentration of domains that are absent from other regional rankings.

In first place, with an 18.77% share, is the fake broker *r*x*.com, which can be used to steal personal data or funds. Second place is held by a crypto-gaming site (16.44%) that we previously encountered in the Latin American TOP 10. Visitors to this site risk losing NFTs and other tokens. In third place is the domain *u*h*.net (11.61%), used for redirects, which can hijack sessions. Following this is *s*m*.com (9.98%), a domain typically used as a browser-hijacking server and for phishing attacks, serving as a link in an infection chain.

Rounding out the local threats in East Asia are the following domains: *e*v*.com (9.37%), utilized in drive-by attacks; *a*k*.com (9.16%), an API-like domain associated with suspicious scripts and extensions; and *b*l*.com (4.38%), a domain potentially used for redirects.

East Asia has a high concentration of region-specific fake brokers, crypto gaming platforms, and NFT marketplaces. The primary threats for this region include the loss of financial data, NFTs, and other tokens, as well as session hijacking.

South Asia

Distribution of the TOP 10 suspicious websites in South Asia, January 2026 (download)

In South Asian countries, we also observe a concentration of local suspicious sites specific to the region.

The second most popular site in the region is *a*s*.com (12.01%), a poor-reputation, high-risk microloan service typical of South Asia. By interacting with these sites, users risk not only losing significant funds but also compromising their overall security. Following this are *v*n*.com with a 9.47% share and *l*f*.com with 8.65%. These domains are employed in various fraudulent schemes, ranging from phishing to spam.

The TOP 10 also includes *s*o*.com (4.80%), a free video downloading service associated with a high risk of infection. The final site we analyzed in the South Asia region is *c*o*.site (1.89%), a pseudo-tool for local SEO optimization that carries the danger of data loss and a high risk of financial fraud through subscription sign-ups.

In summary, the region is dominated by fake antivirus extensions, microloan services, dubious video downloaders, and counterfeit SEO tools. The primary risks for South Asia include financial fraud, phishing and spam distribution, and data theft.

CIS

When analyzing statistics for suspicious sites in CIS countries, we treat Russia as a separate region due to the unique characteristics of its online space which are not found in any other CIS member states. However, we’ve placed these two regions in the same section, as we’ve observed overlaps between them that are not seen in other parts of the world.

Distribution of the TOP 10 suspicious websites in the CIS, January 2026 (download)

The top two sites in the CIS TOP 10 also appear in the Russian TOP 10. The domain *r*a*.bar, which ranks first in the CIS (39.50%), holds the second spot in Russia (15.93%) and is a fake trading site. It’s worth noting that sites in the .bar domain zone are frequently used for scams. In second place in the CIS (15.29%) and sixth in Russia (3.75%) is the domain *p*o*.ru, which is often associated with bots for inflating follower counts and automating community management.

Domains from fourth to eighth place are specific only to the CIS region and don’t appear in the Russian TOP 10. These sites include:

  • *a*e*.online (8.42%): an online image editor that carries risks of data harvesting
  • *n*a*.io (6.51%): a high-risk cryptocurrency trading platform
  • *e*r*.com (3.72%): a site promising free cryptocurrency and posing the risk of compromising visitors’ private keys and digital wallets
  • *s*o*.ltd (3.70%): a domain with an extremely low trust rating
  • *s*.gg (3.49%): a scam site masquerading as a play-to-earn blockchain game

The ranking concludes with sites that overlap with the Russian region. *a*.consulting (2.42%) is a fake clone of a binary options site, and *a*.lol (2.32%) is a domain suspected of dubious activity.

The CIS landscape is dominated by fake trading platforms (particularly crypto exchanges), promises of easy profits, play-to-earn scams, and dubious investment projects. We also observe many bots for inflating social metrics and automation. The primary threat in the CIS is the theft of private keys, digital wallets, and funds through investment schemes and lures involving online promotion.

Distribution of the TOP 10 suspicious websites in Russia, January 2026 (download)

The Russian TOP 10 includes three unique domains not found in the rankings of other regions. The first, *n*m*.top (7.84%), is an imitator of a well-known binary options broker. This suspicious site was recently registered and has a tellingly low rating on domain verification services. The second, *t*e*.ru (3.25%), claims to be an educational platform and has a dubious subscription system with a high probability of fraud involving difficulties in canceling subscriptions. The third site, *e*e*.org (3.14%), positions itself as a tool for a popular media platform, but it’s actually a scam that fails to provide its stated services.

Overall, the Russian landscape is characterized by fake binary options brokers and sketchy sites with fraudulent subscriptions posing as e-learning platforms. There are also frequent instances of sites spoofing well-known legitimate services. The primary risks in Russia are scams related to the knowledge business sector, as well as the theft of money and personal data.

Europe

Distribution of the TOP 10 suspicious websites in Europe, January 2026 (download)

In the European region, we’ve found two unique domains. The first of these, *c*r*.org, has been identified as part of a chain for massive phishing and spam attacks. It accounts for a 16.08% share of the TOP 10. The second site, *o*n*.de, is an unofficial reseller with a poor reputation and a high likelihood of fraud. This domain ranks second to last in our statistics with a 5.95% share.

Among the sites not previously covered, the European TOP 10 includes one site that also appears in the Oceania TOP 10: *o*i*.com (6.61%). This is a classic cryptocurrency scam promising passive income.

A significant portion of suspicious sites in Europe consists of intermediary sites for phishing and spam, fake security extensions, and crypto scams. Unofficial sales services and paid trading tools are also on the list. The primary threats in the European region include session hijacking, data theft, spam, and investment fraud.

Canada

Distribution of the TOP 10 suspicious websites in Canada, January 2026 (download)

Canada has been designated as a separate region to illustrate prevailing trends within North America. The first four positions in the Canadian TOP 10 are held by multiregional domains discussed previously. In fifth place is *t*c*.com (10.88%), which also appears in the TOP 10 rankings for Oceania and South Asia. This is yet another browser extension masquerading as a security solution. Occupying the final spot is the domain *e*w*.com (0.17%), which is unique to the Canadian market. This site operates a dropshipping scam, offering products at prices significantly below market value. Customers typically either never receive their orders or get low-quality counterfeits.

The landscape of dubious websites in Canada is largely defined by fraudulent extensions capable of hijacking browser data, tracking user activity, spoofing search queries, harvesting cookies, and injecting ads. This is further compounded by dropshipping schemes involving counterfeit goods. The primary risks for users in Canada include data theft and financial loss from purchasing substandard products.

Oceania

Distribution of the TOP 10 suspicious websites in Oceania, January 2026 (download)

The final region under consideration is Oceania. Notably, we didn’t identify a single domain unique to this region. Every site appearing in the TOP 10 represents a global threat that’s already been detailed in previous sections. To summarize the findings for this region: the primary threats consist of fake security extensions and privacy products designed for browser hijacking, tracking user activity, displaying advertisements, and stealing data. There’s a minimal presence of crypto Ponzi schemes in this area. The main risk for users in Oceania is the loss of privacy and confidentiality through unwanted apps.

Conclusion

Suspicious websites are particularly dangerous because they often masquerade as legitimate sites with high levels of persuasiveness. They mimic online stores, subscription-based streaming platforms, repair firms, and various other services. Unlike standard phishing sites, they employ more sophisticated manipulations to deceive users, tricking them into voluntarily handing over their personal data and transferring funds.

By examining the TOP 10 suspicious sites across the world’s major regions, we can draw several conclusions. On average, the most prevalent threats globally are fraudulent extensions masquerading as security solutions and privacy services. Their true purpose is to hijack browser data, track user activity, and display ads. We also frequently encounter phishing platforms for image processing and financial scams involving trading, cryptocurrency, betting, and microloans. Our statistics demonstrate that these sites not only employ classic fraudulent schemes centered on easy money but also adapt to contemporary trends targeting younger audiences and specific regional characteristics. The primary risks for users interacting with these sites are a combination of privacy threats and financial loss.

To help protect users from these shady sites, we’ve introduced the category of “websites with an undefined trust level” as part of the web filtering features in our solutions. However, it’s important to note that user awareness and individual responsibility play a significant role in ensuring safe web browsing. It’s essential for users to be able to recognize suspicious sites and remain vigilant toward any that appear untrustworthy.

The game is over: when “free” comes at too high a price. What we know about RenEngine

We often describe cases of malware distribution under the guise of game cheats and pirated software. Sometimes such methods are used to spread complex malware that employs advanced techniques and sophisticated infection chains.

In February 2026, researchers from Howler Cell announced the discovery of a mass campaign distributing pirated games infected with a previously unknown family of malware. It turned out to be a loader called RenEngine, which was delivered to the device using a modified version of the Ren’Py engine-based game launcher. Kaspersky solutions detect the RenEngine loader as Trojan.Python.Agent.nb and HEUR:Trojan.Python.Agent.gen.

However, this threat is not new. Our solutions began detecting the first samples of the RenEngine loader in March 2025, when it was used to distribute the Lumma stealer (Trojan-PSW.Win32.Lumma.gen).

In the ongoing incidents, ACR Stealer (Trojan-PSW.Win32.ACRstealer.gen) is being distributed as the final payload. We have been monitoring this campaign for a long time and will share some details in this article.

Incident analysis

Disguise as a visual novel

Let’s look at the first incident, which we detected in March 2025. At that time, the attackers distributed the malware under the guise of a hacked game on a popular gaming web resource.

The website featured a game download page with two buttons: Free Download Now and Direct Download. Both buttons had the same functionality: they redirected users to the MEGA file-sharing service, where they were offered to download an archive with the “game.”

Game download page

Game download page


When the “game” was launched, the download process would stop at 100%. One might think that the game froze, but that was not the case — the “real” malicious code just started working.
Placeholder with the download screen

Placeholder with the download screen

“Game” source files analysis

The full infection chain

The full infection chain


After analyzing the source files, we found Python scripts that initiated the initial device infection. These scripts imitated the endless loading of the game. In addition, they contained the is_sandboxed function for bypassing the sandbox and xor_decrypt_file for decrypting the malicious payload. Using the latter, the script decrypts the ZIP archive, unpacks its contents into the .temp directory, and launches the unpacked files.
Contents of the .temp directory

Contents of the .temp directory


There are five files in the .temp directory. The DKsyVGUJ.exe executable is not malicious. Its original name is Ahnenblatt4.exe, and it is a well-known legitimate application for organizing genealogical data. The borlndmm.dll library also does not contain malicious code; it implements the memory manager required to run the executable. Another library, cc32290mt.dll, contains a code snippet patched by attackers that intercepts control when the application is launched and deploys the first stage of the payload in the process memory.

HijackLoader

The dbghelp.dll system library is used as a “container” to launch the first stage of the payload. It is overwritten in memory with decrypted shellcode obtained from the gayal.asp file using the cc32290mt.dll library. The resulting payload is HijackLoader. This is a relatively new means of delivering and deploying malicious implants. A distinctive feature of this malware family is its modularity and configuration flexibility. HijackLoader was first detected and described in the summer of 2023. More detailed information about this loader is available to customers of the Kaspersky Intelligence Reporting Service.

The final payload can be delivered in two ways, depending on the configuration parameters of the malicious sample. The main HijackLoader ti module is used to launch and prepare the process for the final payload injection. In some cases, an additional module is also used, which is injected into an intermediate process launched by the main one. The code that performs the injection is the same in both cases.

Before creating a child process, the configuration parameters are encrypted using XOR and saved to the %TEMP% directory with a random name. The file name is written to the system environment variables.

Loading configuration parameters saved by the main module

Loading configuration parameters saved by the main module


In the analyzed sample, the execution follows a longer path with an intermediate child process, cmd.exe. It is created in suspended mode by calling the auxiliary module modCreateProcess. Then, using the ZwCreateSection and ZwMapViewOfSection system API calls, the code of the same dbghelp.dll library is loaded into the address space of the process, after which it intercepts control.

Next, the ti module, launched inside the child process, reads the hap.eml file, from which it decrypts the second stage of HijackLoader. The module then loads the pla.dll system library and overwrites the beginning of its code section with the received payload, after which it transfers control to this library.

Payload decryption

Payload decryption


The decrypted payload is an EXE file, and the configuration parameters are set to inject it into the explorer.exe child process. The payload is written to the memory of the child process in several stages:
  1. First, the malicious payload is written to a temporary file on disk using the transaction mechanism provided by the Windows API. The payload is written in several stages and not in the order in which the data is stored in the file. The MZ signature, with which any PE file begins, is written last with a delay.
    Writing the payload to a temporary file

    Writing the payload to a temporary file

  2. After that, the payload is loaded from the temporary file into the address space of the current process using the ZwCreateSection call. The transaction that wrote to the file is rolled back, thus deleting the temporary file with the payload.
  3. Next, the sample uses the modCreateProcess module to launch the child process explorer.exe and injects the payload into it by creating a shared memory region with the ZwMapViewOfSection call.
    Payload injection into the child process

    Payload injection into the child process


    Another HijackLoader module, rshell, is used to launch the shellcode. Its contents are also injected into the child process, replacing the code located at its entry point.
    The rshell module injection

    The rshell module injection

  4. The last step performed by the parent process is starting a thread in the child process by calling ZwResumeThread. After that, the thread starts executing the rshell module code placed at the child process entry point, and the parent process terminates.

    The rshell module prepares the final malicious payload. Once it has finished, it transfers control to another HijackLoader module called ESAL. It replaces the contents of rshell with zeros using the memset function and launches the final payload, which is a stealer from the Lumma family (Trojan-PSW.Win32.Lumma).

In addition to the modules described above, this HijackLoader sample contains the following modules, which were used at intermediate stages: COPYLIST, modTask, modUAC, and modWriteFile.
Kaspersky solutions detect HijackLoader with the verdicts Trojan.Win32.Penguish and Trojan.Win32.DllHijacker.

Not only games

In addition to gaming sites, we found that attackers created dozens of different web resources to distribute RenEngine under the guise of pirated software. On one such site, for example, users can supposedly download an activated version of the CorelDRAW graphics editor.

Distribution of RenEngine under the guise of the CorelDRAW pirated version

Distribution of RenEngine under the guise of the CorelDRAW pirated version


When the user clicks the Descargar Ahora (“Download Now”) button, they are redirected several times to other malicious websites, after which an infected archive is downloaded to their device.
File storage imitations

File storage imitations

Distribution

According to our data, since March 2025, RenEngine has affected users in the following countries:

Distribution of incidents involving the RenEngine loader by country (TOP 20), February 2026 (download)

The distribution pattern of this loader suggests that the attacks are not targeted. At the time of publication, we have recorded the highest number of incidents in Russia, Brazil, Türkiye, Spain, and Germany.

Recommendations for protection

The format of game archives is generally not standardized and is unique for each game. This means that there is no universal algorithm for unpacking and checking the contents of game archives. If the game engine does not check the integrity and authenticity of executable resources and scripts, such an archive can become a repository for malware if modified by attackers. Despite this, Kaspersky Premium protects against such threats with its Behavior Detection component.

The distribution of malware under the guise of pirated software and hacked games is not a new tactic. It is relatively easy to avoid infection by the malware described in this article: simply install games and programs from trusted sites. In addition, it is important for gamers to remember the need to install specialized security solutions. This ongoing campaign employs the Lumma and ACR stylers, and Vidar was also found — none of these are new threats, but rather long-known malware. This means that modern antivirus technologies can detect even modified versions of the above-mentioned stealers and their alternatives, preventing further infection.

Indicators of compromise

12EC3516889887E7BCF75D7345E3207A – setup_game_8246.zip
D3CF36C37402D05F1B7AA2C444DC211A – __init.py__
1E0BF40895673FCD96A8EA3DDFAB0AE2 – cc32290mt.dll
2E70ECA2191C79AD15DA2D4C25EB66B9 – Lumma Stealer

hxxps://hentakugames[.]com/country-bumpkin/
hxxps://dodi-repacks[.]site
hxxps://artistapirata[.]fit
hxxps://artistapirata[.]vip
hxxps://awdescargas[.]pro
hxxps://fullprogramlarindir[.]me
hxxps://gamesleech[.]com
hxxps://parapcc[.]com
hxxps://saglamindir[.]vip
hxxps://zdescargas[.]pro
hxxps://filedownloads[.]store
hxxps://go[.]zovo[.]ink

Lumma C2
hxxps://steamcommunity[.]com/profiles/76561199822375128
hxxps://localfxement[.]live
hxxps://explorebieology[.]run
hxxps://agroecologyguide[.]digital
hxxps://moderzysics[.]top
hxxps://seedsxouts[.]shop
hxxps://codxefusion[.]top
hxxps://farfinable[.]top
hxxps://techspherxe[.]top
hxxps://cropcircleforum[.]today

Assessing SIEM effectiveness

A SIEM is a complex system offering broad and flexible threat detection capabilities. Due to its complexity, its effectiveness heavily depends on how it is configured and what data sources are connected to it. A one-time SIEM setup during implementation is not enough: both the organization’s infrastructure and attackers’ techniques evolve over time. To operate effectively, the SIEM system must reflect the current state of affairs.

We provide customers with services to assess SIEM effectiveness, helping to identify issues and offering options for system optimization. In this article, we examine typical SIEM operational pitfalls and how to address them. For each case, we also include methods for independent verification.

This material is based on an assessment of Kaspersky SIEM effectiveness; therefore, all specific examples, commands, and field names are taken from that solution. However, the assessment methodology, issues we identified, and ways to enhance system effectiveness can easily be extrapolated to any other SIEM.

Methodology for assessing SIEM effectiveness

The primary audience for the effectiveness assessment report comprises the SIEM support and operation teams within an organization. The main goal is to analyze how well the usage of SIEM aligns with its objectives. Consequently, the scope of checks can vary depending on the stated goals. A standard assessment is conducted across the following areas:

  • Composition and scope of connected data sources
  • Coverage of data sources
  • Data flows from existing sources
  • Correctness of data normalization
  • Detection logic operability
  • Detection logic accuracy
  • Detection logic coverage
  • Use of contextual data
  • SIEM technical integration into SOC processes
  • SOC analysts’ handling of alerts in the SIEM
  • Forwarding of alerts, security event data, and incident information to other systems
  • Deployment architecture and documentation

At the same time, these areas are examined not only in isolation but also in terms of their potential influence on one another. Here are a couple of examples illustrating this interdependence:

  • Issues with detection logic due to incorrect data normalization. A correlation rule with the condition deviceCustomString1 not contains <string> triggers a large number of alerts. The detection logic itself is correct: the specific event and the specific field it targets should not generate a large volume of data matching the condition. Our review revealed the issue was in the data ingested by the SIEM, where incorrect encoding caused the string targeted by the rule to be transformed into a different one. Consequently, all events matched the condition and generated alerts.
  • When analyzing coverage for a specific source type, we discovered that the SIEM was only monitoring 5% of all such sources deployed in the infrastructure. However, extending that coverage would increase system load and storage requirements. Therefore, besides connecting additional sources, it would be necessary to scale resources for specific modules (storage, collectors, or the correlator).

The effectiveness assessment consists of several stages:

  • Collect and analyze documentation, if available. This allows assessing SIEM objectives, implementation settings (ideally, the deployment settings at the time of the assessment), associated processes, and so on.
  • Interview system engineers, analysts, and administrators. This allows assessing current tasks and the most pressing issues, as well as determining exactly how the SIEM is being operated. Interviews are typically broken down into two phases: an introductory interview, conducted at project start to gather general information, and a follow-up interview, conducted mid-project to discuss questions arising from the analysis of previously collected data.
  • Gather information within the SIEM and then analyze it. This is the most extensive part of the assessment, during which Kaspersky experts are granted read-only access to the system or a part of it to collect factual data on its configuration, detection logic, data flows, and so on.

The assessment produces a list of recommendations. Some of these can be implemented almost immediately, while others require more comprehensive changes driven by process optimization or a transition to a more structured approach to system use.

Issues arising from SIEM operations

The problems we identify during a SIEM effectiveness assessment can be divided into three groups:

  • Performance issues, meaning operational errors in various system components. These problems are typically resolved by technical support, but to prevent them, it is worth periodically checking system health status.
  • Efficiency issues – when the system functions normally but seemingly adds little value or is not used to its full potential. This is usually due to the customer using the system capabilities in a limited way, incorrectly, or not as intended by the developer.
  • Detection issues – when the SIEM is operational and continuously evolving according to defined processes and approaches, but alerts are mostly false positives, and the system misses incidents. For the most part, these problems are related to the approach taken in developing detection logic.

Key observations from the assessment

Event source inventory

When building the inventory of event sources for a SIEM, we follow the principle of layered monitoring: the system should have information about all detectable stages of an attack. This principle enables the detection of attacks even if individual malicious actions have gone unnoticed, and allows for retrospective reconstruction of the full attack chain, starting from the attackers’ point of entry.

Problem: During effectiveness assessments, we frequently find that the inventory of connected source types is not updated when the infrastructure changes. In some cases, it has not been updated since the initial SIEM deployment, which limits incident detection capabilities. Consequently, certain types of sources remain completely invisible to the system.

We have also encountered non-standard cases of incomplete source inventory. For example, an infrastructure contains hosts running both Windows and Linux, but monitoring is configured for only one family of operating systems.

How to detect: To identify the problems described above, determine the list of source types connected to the SIEM and compare it against what actually exists in the infrastructure. Identifying the presence of specific systems in the infrastructure requires an audit. However, this task is one of the most critical for many areas of cybersecurity, and we recommend running it on a periodic basis.

We have compiled a reference sheet of system types commonly found in most organizations. Depending on the organization type, infrastructure, and threat model, we may rearrange priorities. However, a good starting point is as follows:

  • High Priority – sources associated with:
    • Remote access provision
    • External services accessible from the internet
    • External perimeter
    • Endpoint operating systems
    • Information security tools
  • Medium Priority – sources associated with:
    • Remote access management within the perimeter
    • Internal network communication
    • Infrastructure availability
    • Virtualization and cloud solutions
  • Low Priority – sources associated with:
    • Business applications
    • Internal IT services
    • Applications used by various specialized teams (HR, Development, PR, IT, and so on)

Monitoring data flow from sources

Regardless of how good the detection logic is, it cannot function without telemetry from the data sources.

Problem: The SIEM core is not receiving events from specific sources or collectors. Based on all assessments conducted, the average proportion of collectors that are configured with sources but are not transmitting events is 38%. Correlation rules may exist for these sources, but they will, of course, never trigger. It is also important to remember that a single collector can serve hundreds of sources (such as workstations), so the loss of data flow from even one collector can mean losing monitoring visibility for a significant portion of the infrastructure.

How to detect: The process of locating sources that are not transmitting data can be broken down into two components.

  1. Checking collector health. Find the status of collectors (see the support website for the steps to do this in Kaspersky SIEM) and identify those with a status of Offline, Stopped, Disabled, and so on.
  2. Checking the event flow. In Kaspersky SIEM, this can be done by gathering statistics using the following query (counting the number of events received from each collector over a specific time period):
SELECT count(ID), CollectorID, CollectorName FROM `events` GROUP BY CollectorID, CollectorName ORDER BY count(ID)
It is essential to specify an optimal time range for collecting these statistics. Too large a range can increase the load on the SIEM, while too small a range may provide inaccurate information for a one-time check – especially for sources that transmit telemetry relatively infrequently, say, once a week. Therefore, it is advisable to choose a smaller time window, such as 2–4 days, but run several queries for different periods in the past.

Additionally, for a more comprehensive approach, it is recommended to use built-in functionality or custom logic implemented via correlation rules and lists to monitor event flow. This will help automate the process of detecting problems with sources.

Event source coverage

Problem: The system is not receiving events from all sources of a particular type that exist in the infrastructure. For example, the company uses workstations and servers running Windows. During SIEM deployment, workstations are immediately connected for monitoring, while the server segment is postponed for one reason or another. As a result, the SIEM receives events from Windows systems, the flow is normalized, and correlation rules work, but an incident in the unmonitored server segment would go unnoticed.

How to detect: Below are query variations that can be used to search for unconnected sources.

  • SELECT count(distinct, DeviceAddress), DeviceVendor, DeviceProduct FROM events GROUP BY DeviceVendor, DeviceProduct ORDER BY count(ID)
  • SELECT count(distinct, DeviceHostName), DeviceVendor, DeviceProduct FROM events GROUP BY DeviceVendor, DeviceProduct ORDER BY count(ID)

We have split the query into two variations because, depending on the source and the DNS integration settings, some events may contain either a DeviceAddress or DeviceHostName field.

These queries will help determine the number of unique data sources sending logs of a specific type. This count must be compared against the actual number of sources of that type, obtained from the system owners.

Retaining raw data

Raw data can be useful for developing custom normalizers or for storing events not used in correlation that might be needed during incident investigation. However, careless use of this setting can cause significantly more harm than good.

Problem: Enabling the Keep raw event option effectively doubles the event size in the database, as it stores two copies: the original and the normalized version. This is particularly critical for high-volume collectors receiving events from sources like NetFlow, DNS, firewalls, and others. It is worth noting that this option is typically used for testing a normalizer but is often forgotten and left enabled after its configuration is complete.

How to detect: This option is applied at the normalizer level. Therefore, it is necessary to review all active normalizers and determine whether retaining raw data is required for their operation.

Normalization

As with the absence of events from sources, normalization issues lead to detection logic failing, as this logic relies on finding specific information in a specific event field.

Problem: Several issues related to normalization can be identified:

  • The event flow is not being normalized at all.
  • Events are only partially normalized – this is particularly relevant for custom, non-out-of-the-box normalizers.
  • The normalizer being used only parses headers, such as syslog_headers, placing the entire event body into a single field, this field most often being Message.
  • An outdated default normalizer is being used.

How to detect: Identifying normalization issues is more challenging than spotting source problems due to the high volume of telemetry and variety of parsers. Here are several approaches to narrowing the search:

  • First, check which normalizers supplied with the SIEM the organization uses and whether their versions are up to date. In our assessments, we frequently encounter auditd events being normalized by the outdated normalizer, Linux audit and iptables syslog v2 for Kaspersky SIEM. The new normalizer completely reworks and optimizes the normalization schema for events from this source.
  • Execute the query:
SELECT count(ID), DeviceProduct, DeviceVendor, CollectorName FROM `events` GROUP BY DeviceProduct, DeviceVendor, CollectorName ORDER BY count(ID)
This query gathers statistics on events from each collector, broken down by the DeviceVendor and DeviceProduct fields. While these fields are not mandatory, they are present in almost any normalization schema. Therefore, their complete absence or empty values may indicate normalization issues. We recommend including these fields when developing custom normalizers.

To simplify the identification of normalization problems when developing custom normalizers, you can implement the following mechanism. For each successfully normalized event, add a Name field, populated from a constant or the event itself. For a final catch-all normalizer that processes all unparsed events, set the constant value: Name = unparsed event. This will later allow you to identify non-normalized events through a simple search on this field.

Detection logic coverage

Collected events alone are, in most cases, only useful for investigating an incident that has already been identified. For a SIEM to operate to its full potential, it requires detection logic to be developed to uncover probable security incidents.

Problem: The mean correlation rule coverage of sources, determined across all our assessments, is 43%. While this figure is only a ballpark figure – as different source types provide different information – to calculate it, we defined “coverage” as the presence of at least one correlation rule for a source. This means that for more than half of the connected sources, the SIEM is not actively detecting. Meanwhile, effort and SIEM resources are spent on connecting, maintaining, and configuring these sources. In some cases, this is formally justified, for instance, if logs are only needed for regulatory compliance. However, this is an exception rather than the rule.

We do not recommend solving this problem by simply not connecting sources to the SIEM. On the contrary, sources should be connected, but this should be done concurrently with the development of corresponding detection logic. Otherwise, it can be forgotten or postponed indefinitely, while the source pointlessly consumes system resources.

How to detect: This brings us back to auditing, a process that can be greatly aided by creating and maintaining a register of developed detection logic. Given that not every detection logic rule explicitly states the source type from which it expects telemetry, its description should be added to this register during the development phase.

If descriptions of the correlation rules are not available, you can refer to the following:

  • The name of the detection logic. With a standardized approach to naming correlation rules, the name can indicate the associated source or at least provide a brief description of what it detects.
  • The use of fields within the rules, such as DeviceVendor, DeviceProduct (another argument for including these fields in the normalizer), Name, DeviceAction, DeviceEventCategory, DeviceEventClassID, and others. These can help identify the actual source.

Excessive alerts generated by the detection logic

One criterion for correlation rules effectiveness is a low false positive rate.

Problem: Detection logic generates an abnormally high number of alerts that are physically impossible to process, regardless of the size of the SOC team.

How to detect: First and foremost, detection logic should be tested during development and refined to achieve an acceptable false positive rate. However, even a well-tuned correlation rule can start producing excessive alerts due to changes in the event flow or connected infrastructure. To identify these rules, we recommend periodically running the following query:

SELECT count(ID), Name FROM `events` WHERE Type = 3 GROUP BY Name ORDER BY count(ID)

In Kaspersky SIEM, a value of 3 in the Type field indicates a correlation event.

Subsequently, for each identified rule with an anomalous alert count, verify the correctness of the logic it uses and the integrity of the event stream on which it triggered.

Depending on the issue you identify, the solution may involve modifying the detection logic, adding exceptions (for example, it is often the case that 99% of the spam originates from just 1–5 specific objects, such as an IP address, a command parameter, or a URL), or adjusting event collection and normalization.

Lack of integration with indicators of compromise

SIEM integrations with other systems are generally a critical part of both event processing and alert enrichment. In at least one specific case, their presence directly impacts detection performance: integration with technical Threat Intelligence data or IoCs (indicators of compromise).

A SIEM allows conveniently checking objects against various reputation databases or blocklists. Furthermore, there are numerous sources of this data that are ready to integrate natively with a SIEM or require minimal effort to incorporate.

Problem: There is no integration with TI data.

How to detect: Generally, IoCs are integrated into a SIEM at the system configuration level during deployment or subsequent optimization. The use of TI within a SIEM can be implemented at various levels:

  • At the data source level. Some sources, such as NGFWs, add this information to events involving relevant objects.
  • At the SIEM native functionality level. For example, Kaspersky SIEM integrates with CyberTrace indicators, which add object reputation information at the moment of processing an event from a source.
  • At the detection logic level. Information about IoCs is stored in various active lists, and correlation rules match objects against these to enrich the event.

Furthermore, TI data does not appear in a SIEM out of thin air. It is either provided by external suppliers (commercially or in an open format) or is part of the built-in functionality of the security tools in use. For instance, various NGFW systems can additionally check the reputation of external IP addresses or domains that users are accessing. Therefore, the first step is to determine whether you are receiving information about indicators of compromise and in what form (whether external providers’ feeds have been integrated and/or the deployed security tools have this capability). It is worth noting that receiving TI data only at the security tool level does not always cover all types of IoCs.

If data is being received in some form, the next step is to verify that the SIEM is utilizing it. For TI-related events coming from security tools, the SIEM needs a correlation rule developed to generate alerts. Thus, checking integration in this case involves determining the capabilities of the security tools, searching for the corresponding events in the SIEM, and identifying whether there is detection logic associated with these events. If events from the security tools are absent, the source audit configuration should be assessed to see if the telemetry type in question is being forwarded to the SIEM at all. If normalization is the issue, you should assess parsing accuracy and reconfigure the normalizer.

If TI data comes from external providers, determine how it is processed within the organization. Is there a centralized system for aggregating and managing threat data (such as CyberTrace), or is the information stored in, say, CSV files?

In the former case (there is a threat data aggregation and management system) you must check if it is integrated with the SIEM. For Kaspersky SIEM and CyberTrace, this integration is handled through the SIEM interface. Following this, SIEM event flows are directed to the threat data aggregation and management system, where matches are identified and alerts are generated, and then both are sent back to the SIEM. Therefore, checking the integration involves ensuring that all collectors receiving events that may contain IoCs are forwarding those events to the threat data aggregation and management system. We also recommend checking if the SIEM has a correlation rule that generates an alert based on matching detected objects with IoCs.

In the latter case (threat information is stored in files), you must confirm that the SIEM has a collector and normalizer configured to load this data into the system as events. Also, verify that logic is configured for storing this data within the SIEM for use in correlation. This is typically done with the help of lists that contain the obtained IoCs. Finally, check if a correlation rule exists that compares the event flow against these IoC lists.

As the examples illustrate, integration with TI in standard scenarios ultimately boils down to developing a final correlation rule that triggers an alert upon detecting a match with known IoCs. Given the variety of integration methods, creating and providing a universal out-of-the-box rule is difficult. Therefore, in most cases, to ensure IoCs are connected to the SIEM, you need to determine if the company has developed that rule (the existence of the rule) and if it has been correctly configured. If no correlation rule exists in the system, we recommend creating one based on the TI integration methods implemented in your infrastructure. If a rule does exist, its functionality must be verified: if there are no alerts from it, analyze its trigger conditions against the event data visible in the SIEM and adjust it accordingly.

The SIEM is not kept up to date

For a SIEM to run effectively, it must contain current data about the infrastructure it monitors and the threats it’s meant to detect. Both elements change over time: new systems and software, users, security policies, and processes are introduced into the infrastructure, while attackers develop new techniques and tools. It is safe to assume that a perfectly configured and deployed SIEM system will no longer be able to fully see the altered infrastructure or the new threats after five years of running without additional configuration. Therefore, practically all components – event collection, detection, additional integrations for contextual information, and exclusions – must be maintained and kept up to date.

Furthermore, it is important to acknowledge that it is impossible to cover 100% of all threats. Continuous research into attacks, development of detection methods, and configuration of corresponding rules are a necessity. The SOC itself also evolves. As it reaches certain maturity levels, new growth opportunities open up for the team, requiring the utilization of new capabilities.

Problem: The SIEM has not evolved since its initial deployment.

How to detect: Compare the original statement of work or other deployment documentation against the current state of the system. If there have been no changes, or only minimal ones, it is highly likely that your SIEM has areas for growth and optimization. Any infrastructure is dynamic and requires continuous adaptation.

Other issues with SIEM implementation and operation

In this article, we have outlined the primary problems we identify during SIEM effectiveness assessments, but this list is not exhaustive. We also frequently encounter:

  • Mismatch between license capacity and actual SIEM load. The problem is almost always the absence of events from sources, rather than an incorrect initial assessment of the organization’s needs.
  • Lack of user rights management within the system (for example, every user is assigned the administrator role).
  • Poor organization of customizable SIEM resources (rules, normalizers, filters, and so on). Examples include chaotic naming conventions, non-optimal grouping, and obsolete or test content intermixed with active content. We have encountered confusing resource names like [dev] test_Add user to admin group_final2.
  • Use of out-of-the-box resources without adaptation to the organization’s infrastructure. To maximize a SIEM’s value, it is essential at a minimum to populate exception lists and specify infrastructure parameters: lists of administrators and critical services and hosts.
  • Disabled native integrations with external systems, such as LDAP, DNS, and GeoIP.

Generally, most issues with SIEM effectiveness stem from the natural degradation (accumulation of errors) of the processes implemented within the system. Therefore, in most cases, maintaining effectiveness involves structuring these processes, monitoring the quality of SIEM engagement at all stages (source onboarding, correlation rule development, normalization, and so on), and conducting regular reviews of all system components and resources.

Conclusion

A SIEM is a powerful tool for monitoring and detecting threats, capable of identifying attacks at various stages across nearly any point in an organization’s infrastructure. However, if improperly configured and operated, it can become ineffective or even useless while still consuming significant resources. Therefore, it is crucial to periodically audit the SIEM’s components, settings, detection rules, and data sources.

If a SOC is overloaded or otherwise unable to independently identify operational issues with its SIEM, we offer Kaspersky SIEM platform users a service to assess its operation. Following the assessment, we provide a list of recommendations to address the issues we identify. That being said, it is important to clarify that these are not strict, prescriptive instructions, but rather highlight areas that warrant attention and analysis to improve the product’s performance, enhance threat detection accuracy, and enable more efficient SIEM utilization.

Yet another DCOM object for lateral movement

Introduction

If you’re a penetration tester, you know that lateral movement is becoming increasingly difficult, especially in well-defended environments. One common technique for remote command execution has been the use of DCOM objects.

Over the years, many different DCOM objects have been discovered. Some rely on native Windows components, others depend on third-party software such as Microsoft Office, and some are undocumented objects found through reverse engineering. While certain objects still work, others no longer function in newer versions of Windows.

This research presents a previously undescribed DCOM object that can be used for both command execution and potential persistence. This new technique abuses older initial access and persistence methods through Control Panel items.

First, we will discuss COM technology. After that, we will review the current state of the Impacket dcomexec script, focusing on objects that still function, and discuss potential fixes and improvements, then move on to techniques for enumerating objects on the system. Next, we will examine Control Panel items, how adversaries have used them for initial access and persistence, and how these items can be leveraged through a DCOM object to achieve command execution.

Finally, we will cover detection strategies to identify and respond to this type of activity.

COM/DCOM technology

What is COM?

COM stands for Component Object Model, a Microsoft technology that defines a binary standard for interoperability. It enables the creation of reusable software components that can interact at runtime without the need to compile COM libraries directly into an application.

These software components operate in a client–server model. A COM object exposes its functionality through one or more interfaces. An interface is essentially a collection of related member functions (methods).

COM also enables communication between processes running on the same machine by using local RPC (Remote Procedure Call) to handle cross-process communication.

Terms

To ensure a better understanding of its structure and functionality, let’s revise COM-related terminology.

  1. COM interface
    A COM interface defines the functionality that a COM object exposes. Each COM interface is identified by a unique GUID known as the IID (Interface ID). All COM interfaces can be found in the Windows Registry under HKEY_CLASSES_ROOT\Interface, where they are organized by GUID.
  2. COM class (COM CoClass)
    A COM class is the actual implementation of one or more COM interfaces. Like COM interfaces, classes are identified by unique GUIDs, but in this case the GUID is called the CLSID (Class ID). This GUID is used to locate the COM server and activate the corresponding COM class.

    All COM classes must be registered in the registry under HKEY_CLASSES_ROOT\CLSID, where each class’s GUID is stored. Under each GUID, you may find multiple subkeys that serve different purposes, such as:

    • InprocServer32/LocalServer32: Specifies the system path of the COM server where the class is defined. InprocServer32 is used for in-process servers (DLLs), while LocalServer32 is used for out-of-process servers (EXEs). We’ll describe this in more detail later.
    • ProgID: A human-readable name assigned to the COM class.
    • TypeLib: A binary description of the COM class (essentially documentation for the class).
    • AppID: Used to describe security configuration for the class.
  3. COM server
    A COM is the module where a COM class is defined. The server can be implemented as an EXE, in which case it is called an out-of-process server, or as a DLL, in which case it is called an in-process server. Each COM server has a unique file path or location in the system. Information about COM servers is stored in the Windows Registry. The COM runtime uses the registry to locate the server and perform further actions. Registry entries for COM servers are located under the HKEY_CLASSES_ROOT root key for both 32- and 64-bit servers.
Component Object Model implementation

Component Object Model implementation

Client–server model

  1. In-process server
    In the case of an in-process server, the server is implemented as a DLL. The client loads this DLL into its own address space and directly executes functions exposed by the COM object. This approach is efficient since both client and server run within the same process.
    In-process COM server

    In-process COM server

  2. Out-of-process server
    Here, the server is implemented and compiled as an executable (EXE). Since the client cannot load an EXE into its address space, the server runs in its own process, separate from the client. Communication between the two processes is handled via ALPC (Advanced Local Procedure Call) ports, which serve as the RPC transport layer for COM.
Out-of-process COM server

Out-of-process COM server

What is DCOM?

DCOM is an extension of COM where the D stands for Distributed. It enables the client and server to reside on different machines. From the user’s perspective, there is no difference: DCOM provides an abstraction layer that makes both the client and the server appear as if they are on the same machine.

Under the hood, however, COM uses TCP as the RPC transport layer to enable communication across machines.

Distributed COM implementation

Distributed COM implementation

Certain requirements must be met to extend a COM object into a DCOM object. The most important one for our research is the presence of the AppID subkey in the registry, located under the COM CLSID entry.

The AppID value contains a GUID that maps to a corresponding key under HKEY_CLASSES_ROOT\AppID. Several subkeys may exist under this GUID. Two critical ones are:

  • AccessPermission: controls access permissions.
  • LaunchPermission: controls activation permissions.

These registry settings grant remote clients permissions to activate and interact with DCOM objects.

Lateral movement via DCOM

After attackers compromise a host, their next objective is often to compromise additional machines. This is what we call lateral movement. One common lateral movement technique is to achieve remote command execution on a target machine. There are many ways to do this, one of which involves abusing DCOM objects.

In recent years, many DCOM objects have been discovered. This research focuses on the objects exposed by the Impacket script dcomexec.py that can be used for command execution. More specifically, three exposed objects are used: ShellWindows, ShellBrowserWindow and MMC20.

  1. ShellWindows
    ShellWindows was one of the first DCOM objects to be identified. It represents a collection of open shell windows and is hosted by explorer.exe, meaning any COM client communicates with that process.

    In Impacket’s dcomexec.py, once an instance of this COM object is created on a remote machine, the script provides a semi-interactive shell.

    Each time a user enters a command, the function exposed by the COM object is called. The command output is redirected to a file, which the script retrieves via SMB and displays back to simulate a regular shell.

    Internally, the script runs this command when connecting:

    cmd.exe /Q /c cd \ 1> \\127.0.0.1\ADMIN$\__17602 2>&1

    This sets the working directory to C:\ and redirects the output to the ADMIN$ share under the filename __17602. After that, the script checks whether the file exists; if it does, execution is considered successful and the output appears as if in a shell.

    When running dcomexec.py against Windows 10 and 11 using the ShellWindows object, the script hangs after confirming SMB connection initialization and printing the SMB banner. As I mentioned in my personal blog post, it appears that this DCOM object no longer has permission to write to the ADMIN$ share. A simple fix is to redirect the output to a directory the DCOM object can write to, such as the Temp folder. The Temp folder can then be accessed under the same ADMIN$ share. A small change in the code resolves the issue. For example:

    OUTPUT_FILENAME = 'Temp\\__' + str(time.time())[:5]

  2. ShellBrowserWindow
    The ShellBrowserWindow object behaves almost identically to ShellWindows and exhibits the same behavior on Windows 10. The same workaround that we used for ShellWindows applies in this case. However, on Windows 11, this object no longer works for command execution.
  3. MMC20
    The MMC20.Application COM object is the automation interface for Microsoft Management Console (MMC). It exposes methods and properties that allow MMC snap-ins to be automated.

    This object has historically worked across all Windows versions. Starting with Windows Server 2025, however, attempting to use it triggers a Defender alert, and execution is blocked.

    As shown in earlier examples, the dcomexec.py script writes the command output to a file under ADMIN$, with a filename that begins with __:

    OUTPUT_FILENAME = '__' + str(time.time())[:5]

    Defender appears to check for files written under ADMIN$ that start with __, and when it detects one, it blocks the process and alerts the user. A quick fix is to simply remove the double underscores from the output filename.

    Another way to bypass this issue is to use the same workaround used for ShellWindows – redirecting the output to the Temp folder. The table below outlines the status of these objects across different Windows versions.

    Windows Server 2025 Windows Server 2022 Windows 11 Windows 10
    ShellWindows Doesn’t work Doesn’t work Works but needs a fix Works but needs a fix
    ShellBrowserWindow Doesn’t work Doesn’t work Doesn’t work Works but needs a fix
    MMC20 Detected by Defender Works Works Works

Enumerating COM/DCOM objects

The first step to identifying which DCOM objects could be used for lateral movement is to enumerate them. By enumerating, I don’t just mean listing the objects. Enumeration involves:

  • Finding objects and filtering specifically for DCOM objects.
  • Identifying their interfaces.
  • Inspecting the exposed functions.

Automating enumeration is difficult because most COM objects lack a type library (TypeLib). A TypeLib acts as documentation for an object: which interfaces it supports, which functions are exposed, and the definitions of those functions. Even when TypeLibs are available, manual inspection is often still required, as we will explain later.

There are several approaches to enumerating COM objects depending on their use cases. Next, we’ll describe the methods I used while conducting this research, taking into account both automated and manual methods.

  1. Automation using PowerShell
    In PowerShell, you can use .NET to create and interact with DCOM objects. Objects can be created using either their ProgID or CLSID, after which you can call their functions (as shown in the figure below).
    Shell.Application COM object function list in PowerShell

    Shell.Application COM object function list in PowerShell

    Under the hood, PowerShell checks whether the COM object has a TypeLib and implements the IDispatch interface. IDispatch enables late binding, which allows runtime dynamic object creation and function invocation. With these two conditions met, PowerShell can dynamically interact with COM objects at runtime.

    Our strategy looks like this:

    As you can see in the last box, we perform manual inspection to look for functions with names that could be of interest, such as Execute, Exec, Shell, etc. These names often indicate potential command execution capabilities.

    However, this approach has several limitations:

    • TypeLib requirement: Not all COM objects have a TypeLib, so many objects cannot be enumerated this way.
    • IDispatch requirement: Not all COM objects implement the IDispatch interface, which is required for PowerShell interaction.
    • Interface control: When you instantiate an object in PowerShell, you cannot choose which interface the instance will be tied to. If a COM class implements multiple interfaces, PowerShell will automatically select the one marked as [default] in the TypeLib. This means that other non-default interfaces, which may contain additional relevant functionality, such as command execution, could be overlooked.
  2. Automation using C++
    As you might expect, C++ is one of the languages that natively supports COM clients. Using C++, you can create instances of COM objects and call their functions via header files that define the interfaces.However, with this approach, we are not necessarily interested in calling functions directly. Instead, the goal is to check whether a specific COM object supports certain interfaces. The reasoning is that many interfaces have been found to contain functions that can be abused for command execution or other purposes.

    This strategy primarily relies on an interface called IUnknown. All COM interfaces should inherit from this interface, and all COM classes should implement it.The IUnknown interface exposes three main functions. The most important is QueryInterface(), which is used to ask a COM object for a pointer to one of its interfaces.So, the strategy is to:

    • Enumerate COM classes in the system by reading CLSIDs under the HKEY_CLASSES_ROOT\CLSID key.
    • Check whether they support any known valuable interfaces. If they do, those classes may be leveraged for command execution or other useful functionality.

    This method has several advantages:

    • No TypeLib dependency: Unlike PowerShell, this approach does not require the COM object to have a TypeLib.
    • Use of IUnknown: In C++, you can use the QueryInterface function from the base IUnknown interface to check if a particular interface is supported by a COM class.
    • No need for interface definitions: Even without knowing the exact interface structure, you can obtain a pointer to its virtual function table (vtable), typically cast as a void*. This is enough to confirm the existence of the interface and potentially inspect it further.

    The figure below illustrates this strategy:

    This approach is good in terms of automation because it eliminates the need for manual inspection. However, we are still only checking well-known interfaces commonly used for lateral movement, while potentially missing others.

  3. Manual inspection using open-source tools

    As you can see, automation can be difficult since it requires several prerequisites and, in many cases, still ends with a manual inspection. An alternative approach is manual inspection using a tool called OleViewDotNet, developed by James Forshaw. This tool allows you to:
    • List all COM classes in the system.
    • Create instances of those classes.
    • Check their supported interfaces.
    • Call specific functions.
    • Apply various filters for easier analysis.
    • Perform other inspection tasks.
    Open-source tool for inspecting COM interfaces

    Open-source tool for inspecting COM interfaces

    One of the most valuable features of this tool is its naming visibility. OleViewDotNet extracts the names of interfaces and classes (when available) from the Windows Registry and displays them, along with any associated type libraries.

    This makes manual inspection easier, since you can analyze the names of classes, interfaces, or type libraries and correlate them with potentially interesting functionality, for example, functions that could lead to command execution or persistence techniques.

Control Panel items as attack surfaces

Control Panel items allow users to view and adjust their computer settings. These items are implemented as DLLs that export the CPlApplet function and typically have the .cpl extension. Control Panel items can also be executables, but our research will focus on DLLs only.

Control Panel items

Control Panel items

Attackers can abuse CPL files for initial access. When a user executes a malicious .cpl file (e.g., delivered via phishing), the system may be compromised – a technique mapped to MITRE ATT&CK T1218.002.

Adversaries may also modify the extensions of malicious DLLs to .cpl and register them in the corresponding locations in the registry.

  • Under HKEY_CURRENT_USER:
    HKCU\Software\Microsoft\Windows\CurrentVersion\Control Panel\Cpls
  • Under HKEY_LOCAL_MACHINE:
    • For 64-bit DLLs:
      HKLM\Software\Microsoft\Windows\CurrentVersion\Control Panel\Cpls
    • For 32-bit DLLs:
      HKLM\Software\WOW6432Node\Microsoft\Windows\CurrentVersion\Control Panel\Cpls

These locations are important when Control Panel DLLs need to be available to the current logged-in user or to all users on the machine. However, the “Control Panel” subkey and its “Cpls” subkey under HKCU should be created manually, unlike the “Control Panel” and “Cpls” subkeys under HKLM, which are created automatically by the operating system.

Once registered, the DLL (CPL file) will load every time the Control Panel is opened, enabling persistence on the victim’s system.

It’s worth noting that even DLLs that do not comply with the CPL specification, do not export CPlApplet, or do not have the .cpl extension can still be executed via their DllEntryPoint function if they are registered under the registry keys listed above.

There are multiple ways to execute Control Panel items:

  • From cmd: control.exe [filename].cpl
  • By double-clicking the .cpl file.

Both methods use rundll32.exe under the hood:

rundll32.exe shell32.dll,Control_RunDLL [filename].cpl

This calls the Control_RunDLL function from shell32.dll, passing the CPL file as an argument. Everything inside the CPlApplet function will then be executed.

However, if the CPL file has been registered in the registry as shown earlier, then every time the Control Panel is opened, the file is loaded into memory through the COM Surrogate process (dllhost.exe):

COM Surrogate process loading the CPL file

COM Surrogate process loading the CPL file

What happened was that a Control Panel with a COM client used a COM object to load these CPL files. We will talk about this COM object in more detail later.

The COM Surrogate process was designed to host COM server DLLs in a separate process rather than loading them directly into the client process’s address space. This isolation improves stability for the in-process server model. This hosting behavior can be configured for a COM object in the registry if you want a COM server DLL to run inside a separate process because, by default, it is loaded in the same process.

‘DCOMing’ through Control Panel items

While following the manual approach of enumerating COM/DCOM objects that could be useful for lateral movement, I came across a COM object called COpenControlPanel, which is exposed through shell32.dll and has the CLSID {06622D85-6856-4460-8DE1-A81921B41C4B}. This object exposes multiple interfaces, one of which is IOpenControlPanel with IID {D11AD862-66DE-4DF4-BF6C-1F5621996AF1}.

IOpenControlPanel interface in the OleViewDotNet output

IOpenControlPanel interface in the OleViewDotNet output

I immediately thought of its potential to compromise Control Panel items, so I wanted to check which functions were exposed by this interface. Unfortunately, neither the interface nor the COM class has a type library.

COpenControlPanel interfaces without TypeLib

COpenControlPanel interfaces without TypeLib

Normally, checking the interface definition would require reverse engineering, so at first, it looked like we needed to take a different research path. However, it turned out that the IOpenControlPanel interface is documented on MSDN, and according to the documentation, it exposes several functions. One of them, called Open, allows a specified Control Panel item to be opened using its name as the first argument.

Full type and function definitions are provided in the shobjidl_core.h Windows header file.

Open function exposed by IOpenControlPanel interface

Open function exposed by IOpenControlPanel interface

It’s worth noting that in newer versions of Windows (e.g., Windows Server 2025 and Windows 11), Microsoft has removed interface names from the registry, which means they can no longer be identified through OleViewDotNet.

COpenControlPanel interfaces without names

COpenControlPanel interfaces without names

Returning to the COpenControlPanel COM object, I found that the Open function can trigger a DLL to be loaded into memory if it has been registered in the registry. For the purposes of this research, I created a DLL that basically just spawns a message box which is defined under the DllEntryPoint function. I registered it under HKCU\Software\Microsoft\Windows\CurrentVersion\Control Panel\Cpls and then created a simple C++ COM client to call the Open function on this interface.

As expected, the DLL was loaded into memory. It was hosted in the same way that it would be if the Control Panel itself was opened: through the COM Surrogate process (dllhost.exe). Using Process Explorer, it was clear that dllhost.exe loaded my DLL while simultaneously hosting the COpenControlPanel object along with other COM objects.

COM Surrogate loading a custom DLL and hosting the COpenControlPanel object

COM Surrogate loading a custom DLL and hosting the COpenControlPanel object

Based on my testing, I made the following observations:

  1. The DLL that needs to be registered does not necessarily have to be a .cpl file; any DLL with a valid entry point will be loaded.
  2. The Open() function accepts the name of a Control Panel item as its first argument. However, it appears that even if a random string is supplied, it still causes all DLLs registered in the relevant registry location to be loaded into memory.

Now, what if we could trigger this COM object remotely? In other words, what if it is not just a COM object but also a DCOM object? To verify this, we checked the AppID of the COpenControlPanel object using OleViewDotNet.

COpenControlPanel object in OleViewDotNet

COpenControlPanel object in OleViewDotNet

Both the launch and access permissions are empty, which means the object will follow the system’s default DCOM security policy. By default, members of the Administrators group are allowed to launch and access the DCOM object.

Based on this, we can build a remote strategy. First, upload the “malicious” DLL, then use the Remote Registry service to register it in the appropriate registry location. Finally, use a trigger acting as a DCOM client to remotely invoke the Open() function, causing our DLL to be loaded. The diagram below illustrates the flow of this approach.

Malicious DLL loading using DCOM

Malicious DLL loading using DCOM

The trigger can be written in either C++ or Python, for example, using Impacket. I chose Python because of its flexibility. The trigger itself is straightforward: we define the DCOM class, the interface, and the function to call. The full code example can be found here.

Once the trigger runs, the behavior will be the same as when executing the COM client locally: our DLL will be loaded through the COM Surrogate process (dllhost.exe).

As you can see, this technique not only achieves command execution but also provides persistence. It can be triggered in two ways: when a user opens the Control Panel or remotely at any time via DCOM.

Detection

The first step in detecting such activity is to check whether any Control Panel items have been registered under the following registry paths:

  • HKCU\Software\Microsoft\Windows\CurrentVersion\Control Panel\Cpls
  • HKLM\Software\Microsoft\Windows\CurrentVersion\Control Panel\Cpls
  • HKLM\Software\WOW6432Node\Microsoft\Windows\CurrentVersion\Control Panel\Cpls

Although commonly known best practices and research papers regarding Windows security advise monitoring only the first subkey, for thorough coverage it is important to monitor all of the above.

In addition, monitoring dllhost.exe (COM Surrogate) for unusual COM objects such as COpenControlPanel can provide indicators of malicious activity.
Finally, it is always recommended to monitor Remote Registry usage because it is commonly abused in many types of attacks, not just in this scenario.

Conclusion

In conclusion, I hope this research has clarified yet another attack vector and emphasized the importance of implementing hardening practices. Below are a few closing points for security researchers to take into account:

  • As shown, DCOM represents a large attack surface. Windows exposes many DCOM classes, a significant number of which lack type libraries – meaning reverse engineering can reveal additional classes that may be abused for lateral movement.
  • Changing registry values to register malicious CPLs is not good practice from a red teaming ethics perspective. Defender products tend to monitor common persistence paths, but Control Panel applets can be registered in multiple registry locations, so there is always a gap that can be exploited.
  • Bitness also matters. On x64 systems, loading a 32-bit DLL will spawn a 32-bit COM Surrogate process (dllhost.exe *32). This is unusual on 64-bit hosts and therefore serves as a useful detection signal for defenders and an interesting red flag for red teamers to consider.

Turn me on, turn me off: Zigbee assessment in industrial environments

We all encounter IoT and home automation in some form or another, from smart speakers to automated sensors that control water pumps. These services appear simple and straightforward to us, but many devices and protocols work together under the hood to deliver them.

One of those protocols is Zigbee. Zigbee is a low-power wireless protocol (based on IEEE 802.15.4) used by many smart devices to talk to each other. It’s common in homes, but is also used in industrial environments where hundreds or thousands of sensors may coordinate to support a process.

There are many guides online about performing security assessments of Zigbee. Most focus on the Zigbee you see in home setups. They often skip the Zigbee used at industrial sites, what I call ‘non-public’ or ‘industrial’ Zigbee.

In this blog, I will take you on a journey through Zigbee assessments. I’ll explain the basics of the protocol and map the attack surface likely to be found in deployments. I’ll also walk you through two realistic attack vectors that you might see in facilities, covering the technical details and common problems that show up in assessments. Finally, I will present practical ways to address these problems.

Zigbee introduction

Protocol overview

Zigbee is a wireless communication protocol designed for low-power applications in wireless sensor networks. Based on the IEEE 802.15.4 standard, it was created for short-range and low-power communication. Zigbee supports mesh networking, meaning devices can connect through each other to extend the network range. It operates on the 2.4 GHz frequency band and is widely used in smart homes, industrial automation, energy monitoring, and many other applications.

You may be wondering why there’s a need for Zigbee when Wi-Fi is everywhere? The answer depends on the application. In most home setups, Wi-Fi works well for connecting devices. But imagine you have a battery-powered sensor that isn’t connected to your home’s electricity. If it used Wi-Fi, its battery would drain quickly – maybe in just a few days – because Wi-Fi consumes much more power. In contrast, the Zigbee protocol allows for months or even years of uninterrupted work.

Now imagine an even more extreme case. You need to place sensors in a radiation zone where humans can’t go. You drop the sensors from a helicopter and they need to operate for months without a battery replacement. In this situation, power consumption becomes the top priority. Wi-Fi wouldn’t work, but Zigbee is built exactly for this kind of scenario.

Also, Zigbee has a big advantage if the area is very large, covering thousands of square meters and requiring thousands of sensors: it supports thousands of nodes in a mesh network, while Wi-Fi is usually limited to hundreds at most.

There are lots more ins and outs, but these are the main reasons Zigbee is preferred for large-scale, low-power sensor networks.

Since both Zigbee and IEEE 802.15.4 define wireless communication, many people confuse the two. The difference between them, to put it simply, concerns the layers they support. IEEE 802.15.4 defines the physical (PHY) and media access control (MAC) layers, which basically determine how devices send and receive data over the air. Zigbee (as well as other protocols like Thread, WirelessHART, 6LoWPAN, and MiWi) builds on IEEE 802.15.4 by adding the network and application layers that define how devices form a network and communicate.

Zigbee operates in the 2.4 GHz wireless band, which it shares with Wi-Fi and Bluetooth. The Zigbee band includes 16 channels, each with a 2 MHz bandwidth and a 5 MHz gap between channels.

This shared frequency means Zigbee networks can sometimes face interference from Wi-Fi or Bluetooth devices. However, Zigbee’s low power and adaptive channel selection help minimize these conflicts.

Devices and network

There are three main types of Zigbee devices, each of which plays a different role in the network.

  1. Zigbee coordinator
    The coordinator is the brain of the Zigbee network. A Zigbee network is always started by a coordinator and can only contain one coordinator, which has the fixed address 0x0000.
    It performs several key tasks:
    • Starts and manages the Zigbee network.
    • Chooses the Zigbee channel.
    • Assigns addresses to other devices.
    • Stores network information.
    • Chooses the PAN ID: a 2-byte identifier (for example, 0x1234) that uniquely identifies the network.
    • Sets the Extended PAN ID: an 8-byte value, often an ASCII name representing the network.

    The coordinator can have child devices, which can be either Zigbee routers or Zigbee end devices.

  2. Zigbee router
    The router works just like a router in a traditional network: it forwards data between devices, extends the network range and can also accept child devices, which are usually Zigbee end devices.
    Routers are crucial for building large mesh networks because they enable communication between distant nodes by passing data through multiple hops.
  3. Zigbee end device
    The end device, also referred to as a Zigbee endpoint, is the simplest and most power-efficient type of Zigbee device. It only communicates with its parent, either a coordinator or router, and sleeps most of the time to conserve power. Common examples include sensors, remotes, and buttons.

Zigbee end devices do not accept child devices unless they are configured as both a router and an endpoint simultaneously.

Each of these device types, also known as Zigbee nodes, has two types of address:

  • Short address: two bytes long, similar to an IP address in a TCP/IP network.
  • Extended address: eight bytes long, similar to a MAC address.

Both addresses can be used in the MAC and network layers, unlike in TCP/IP, where the MAC address is used only in Layer 2 and the IP address in Layer 3.

Zigbee setup

Zigbee has many attack surfaces, such as protocol fuzzing and low-level radio attacks. In this post, however, I’ll focus on application-level attacks. Our test setup uses two attack vectors and is intentionally small to make the concepts clear.

In our setup, a Zigbee coordinator is connected to a single device that functions as both a Zigbee endpoint and a router. The coordinator also has other interfaces (Ethernet, Bluetooth, Wi-Fi, LTE), while the endpoint has a relay attached that the coordinator can switch on or off over Zigbee. This relay can be triggered by events coming from any interface, for example, a Bluetooth command or an Ethernet message.

Our goal will be to take control of the relay and toggle its state (turn it off and on) using only the Zigbee interface. Because the other interfaces (Ethernet, Bluetooth, Wi-Fi, LTE) are out of scope, the attack must work by hijacking Zigbee communication.

For the purposes of this research, we will attempt to hijack the communication between the endpoint and the coordinator. The two attack vectors we will test are:

  1. Spoofed packet injection: sending forged Zigbee commands made to look like they come from the coordinator to trigger the relay.
  2. Coordinator impersonation (rejoin attack): impersonating the legitimate coordinator to trick the endpoint into joining the attacker-controlled coordinator and controlling it directly.

Spoofed packet injection

In this scenario, we assume the Zigbee network is already up and running and that both the coordinator and endpoint nodes are working normally. The coordinator has additional interfaces, such as Ethernet, and the system uses those interfaces to trigger the relay. For instance, a command comes in over Ethernet and the coordinator sends a Zigbee command to the endpoint to toggle the relay. Our goal is to toggle the relay by injecting simulated legitimate Zigbee packets, using only the Zigbee link.

Sniffing

The first step in any radio assessment is to sniff the wireless traffic so we can learn how the devices talk. For Zigbee, a common and simple tool is the nRF52840 USB dongle by Nordic Semiconductor. With the official nRF Sniffer for 802.15.4 firmware, the dongle can run in promiscuous mode to capture all 802.15.4/Zigbee traffic. Those captures can be opened in Wireshark with the appropriate dissector to inspect the frames.

How do you find the channel that’s in use?

Zigbee runs on one of the 16 channels that we mentioned earlier, so we must set the sniffer to the same channel that the network uses. One practical way to scan the channels is to change the sniffer channel manually in Wireshark and watch for Zigbee traffic. When we see traffic, we know we’ve found the right channel.

After selecting the channel, we will be able to see the communication between the endpoint and the coordinator, though it will most likely be encrypted:

In the “Info” column, we can see that Wireshark only identifies packets as Data or Command without specifying their exact type, and that’s because the traffic is encrypted.

Even when Zigbee payloads are encrypted, the network and MAC headers remain visible. That means we can usually read things like source and destination addresses, PAN ID, short and extended MAC addresses, and frame control fields. The application payload (i.e., the actual command to toggle the relay) is typically encrypted at the Zigbee network/application layer, so we won’t see it in clear text without encryption keys. Nevertheless, we can still learn enough from the headers.

Decryption

Zigbee supports several key types and encryption models. In this post, we’ll keep it simple and look at a case involving only two security-related devices: a Zigbee coordinator and a device that is both an endpoint and a router. That way, we’ll only use a network encryption model, whereas with, say, mesh networks there can be various encryption models in use.

The network encryption model is a common concept. The traffic that we sniffed earlier is typically encrypted using the network key. This key is a symmetric AES-128 key shared by all devices in a Zigbee network. It protects network-layer packets (hop-by-hop) such as routing and broadcast packets. Because every router on the path shares the network key, this encryption method is not considered end-to-end.

Depending on the specific implementation, Zigbee can use two approaches for application payloads:

  • Network-layer encryption (hop-by-hop): the network key encrypts the Application Support Sublayer (APS) data, the sublayer of the application layer in Zigbee. In this case, each router along the route can decrypt the APS payload. This is not end-to-end encryption, so it is not recommended for transmitting sensitive data.
  • Link key (end-to-end) encryption: a link key, which is also an AES-128 key, is shared between two devices (for example, the coordinator and an endpoint).

The link key provides end-to-end protection of the APS payload between the two devices.

Because the network key could allow an attacker to read and forge many types of network traffic, it must be random and protected. Exposing the key effectively compromises the entire network.

When a new device joins, the coordinator (Trust Center) delivers the network key using a Transport Key command. That transport packet must be protected by a link key so the network key is not exposed in clear text. The link key authenticates the joining device and protects the key delivery.

The image below shows the transport packet:

There are two common ways link keys are provided:

  • Pre-installed: the device ships with an installation code or link key already set.
  • Key establishment: the device runs a key-establishment protocol.

A common historical problem is the global default Trust Center link key, “ZigBeeAlliance09”. It was included in early versions of Zigbee (pre-3.0) to facilitate testing and interoperability. However, many vendors left it enabled on consumer devices, and that has caused major security issues. If an attacker knows this key, they can join devices and read or steal the network key.

Newer versions – Zigbee 3.0 and later – introduced installation codes and procedures to derive unique link keys for each device. An installation code is usually a factory-assigned secret (often encoded on the device label) that the Trust Center uses to derive a unique link key for the device in question. This helps avoid the problems caused by a single hard-coded global key.

Unfortunately, many manufacturers still ignore these best practices. During real assessments, we often encounter devices that use default or hard-coded keys.

How can these keys be obtained?

If an endpoint has already joined the network and communicates with the coordinator using the network key, there are two main options for decrypting traffic:

  1. Guess or brute-force the network key. This is usually impractical because a properly generated network key is a random AES-128 key.
  2. Force the device to rejoin and capture the transport key. If we can make the endpoint leave the network and then rejoin, the coordinator will send the transport key. Capturing that packet can reveal the network key, but the transport key itself is protected by the link key. Therefore, we still need the link key.

To obtain the network and link keys, many approaches can be used:

  • The well-known default link key, ZigBeeAlliance09. Many legacy devices still use it.
  • Identify the device manufacturer and search for the default keys used by that vendor. We can find the manufacturer by:
    • Checking the device MAC/OUI (the first three bytes of the 64-bit extended address often map to a vendor).
    • Physically inspecting the device (label, model, chip markings).
  • Extract the firmware from the coordinator or device if we have physical access and search for hard-coded keys inside the firmware images.

Once we have the relevant keys, the decryption process is straightforward:

  1. Open the capture in Wireshark.
  2. Go to Edit -> Preferences -> Protocols -> Zigbee.
  3. Add the network key and any link keys in our possession.
  4. Wireshark will then show decrypted APS payloads and higher-level Zigbee packets.

After successful decryption, packet types and readable application commands will be visible, such as Link Status or on/off cluster commands:

Choose your gadget

Now that we can read and potentially decrypt traffic, we need hardware and software to inject packets over the Zigbee link between the coordinator and the endpoint. To keep this practical and simple, I opted for cheap, widely available tools that are easy to set up.

For the hardware, I used the nRF52840 USB dongle, the same device we used for sniffing. It’s inexpensive, easy to find, and supports IEEE 802.15.4/Zigbee, so it can sniff and transmit.

The dongle runs the firmware we can use. A good firmware platform is Zephyr RTOS. Zephyr has an IEEE 802.15.4 radio API that enables the device to receive raw frames, essentially enabling sniffer mode, as well as send raw frames as seen in the snippets below.

Using this API and other components, we created a transceiver implementation written in C, compiled it to firmware, and flashed it to the dongle. The firmware can expose a simple runtime interface, such as a USB serial port, which allows us to control the radio from a laptop.

At runtime, the dongle listens on the serial port (for example, /dev/ttyACM1). Using a script, we can send it raw bytes, which the firmware will pass to the radio API and transmit to the channel. The following is an example of a tiny Python script to open the serial port:

I used the Scapy tool with the 802.15.4/Zigbee extensions to build Zigbee packets. Scapy lets us assemble packets layer-by-layer – MAC → NWK → APS → ZCL – and then convert them to raw bytes to send to the dongle. We will talk about APS and ZCL in more detail later.

Here is an example of how we can use Scapy to craft an APS layer packet:

from scapy.layers.dot15d4 import Dot15d4, Dot15d4FCS, Dot15d4Data, Dot15d4Cmd, Dot15d4Beacon, Dot15d4CmdAssocResp
from scapy.layers.zigbee import ZigbeeNWK, ZigbeeAppDataPayload, ZigbeeSecurityHeader, ZigBeeBeacon, ZigbeeAppCommandPayload

Before sending, the packet must be properly encrypted and signed so the endpoint accepts it. That means applying AES-CCM (AES-128 with MIC) using the network key (or the correct link key) and adhering to Zigbee’s rules for packet encryption and MIC calculation. This is how we implemented the encryption and MIC in Python (using a cryptographic library) after building the Scapy packet. We then sent the final bytes to the dongle.

This is how we implemented the encryption and MIC:

Crafting the packet

Now that we know how to inject packets, the next question is what to inject. To toggle the relay, we simply need to send the same type of command that the coordinator already sends. The easiest way to find that command is to sniff the traffic and read the application payload. However, when we look at captures in Wireshark, we can see many packets under ZCL marked [Malformed Packet].

A “malformed” ZCL packet usually means Wireshark could not fully interpret the packet because the application layer is non-standard or lacks details Wireshark expects. To understand why this happens, let’s look at the Zigbee application layer.

The Zigbee application layer consists of four parts:

  • Application Support Sublayer (APS): routes messages to the correct profile, endpoint, and cluster, and provides application-level security.
  • Application Framework (AF): contains the application objects that implement device functionality. These objects reside on endpoints (logical addresses 1–240) and expose clusters (sets of attributes and commands).
  • Zigbee Cluster Library (ZCL): defines standard clusters and commands so devices can interoperate.
  • Zigbee Device Object (ZDO): handles device discovery and management (out of scope for this post).

To make sense of application traffic, we must introduce three concepts:

  • Profile: a rulebook for how devices should behave for a specific use case. Public (standard) profiles are managed by the Connectivity Standards Alliance (CSA). Vendors can also create private profiles for proprietary features.
  • Cluster: a set of attributes and commands for a particular function. For example, the On/Off cluster contains On and Off commands and an OnOff attribute that displays the current state.
  • Endpoint: a logical “port” on the device where a profile and clusters reside. A device can host multiple endpoints for different functions.

Putting all this together, in the standard home automation traffic we see APS pointing to the home automation profile, the On/Off cluster, and a destination endpoint (for example, endpoint 1). In ZCL, the byte 0x00 often means “Off”.

In many industrial setups, vendors use private profiles or custom application frameworks. That’s why Wireshark can’t decode the packets; the AF payload is custom, so the dissector doesn’t know the format.

So how do we find the right bytes to toggle the switch when the application is private? Our strategy has two phases.

  1. Passive phase
    Sniff traffic while the system is driven legitimately. For example, trigger the relay from another interface (Ethernet or Bluetooth) and capture the Zigbee packets used to toggle the relay. If we can decrypt the captures, we can extract the application payload that correlates with the on/off action.
  2. Active phase
  3. With the legitimate payload at hand, we can now turn to creating our own packet. There are two ways to do that. First, we need to replay or duplicate the captured application payload exactly as it is. This works if there are no freshness checks like sequence numbers. Otherwise, we have to reverse-engineer the payload and adjust any counters or fields that prevent replay. For instance, many applications include an application-level counter. If the device ignores packets with a lower application counter, we must locate and increment that counter when we craft our packet.

    Another important protective measure is the frame counter inside the Zigbee security header (in the network header security fields). The frame counter prevents replay attacks; the receiver expects the frame counter to increase with each new packet, and will reject packets with a lower or repeated counter.

So, in the active phase, we must:

  1. Sniff the traffic until the coordinator sends a valid packet to the endpoint.
  2. Decrypt the packet, extract the counters and increase them by one.
  3. Build a packet with the correct APS/AF fields (profile, endpoint, cluster).
  4. Include a valid ZCL command or the vendor-specific payload that we identified in the passive phase.
  5. Encrypt and sign the packet with the correct network or link key.
  6. Make sure both the application counter (if used) and the Zigbee frame counter are modified so the packet is accepted.

The whole strategy for this phase will look like this:

If all of the above are handled correctly, we will be able to hijack the Zigbee communication and toggle the relay (turn it off and on) using only the Zigbee link.

Coordinator impersonation (rejoin attack)

The goal of this attack vector is to force the Zigbee endpoint to leave its original coordinator’s network and join our spoofed network so that we can take control of the device. To do this, we must achieve two things:

  1. Force the endpoint to leave the original network.
  2. Spoof the original coordinator and trick the node into joining our fake coordinator.

Force leaving

To better understand how to manipulate endpoint connections, let’s first describe the concept of a beacon frame. Beacon frames are periodic announcements sent by a coordinator and by routers. They advertise the presence of a network and provide join information, such as:

  • PAN ID and Extended PAN ID
  • Coordinator address
  • Stack/profile information
  • Device capacity (for example, whether the coordinator can accept child devices)

When a device wants to join, it sends a beacon request across Zigbee channels and waits for beacon replies from nearby coordinators/routers. Even if the network is not beacon-enabled for regular synchronization, beacon frames are still used during the join/discovery process, so they are mandatory when a node tries to discover networks.

Note that beacon frames exist at both the Zigbee and IEEE 802.15.4 levels. The MAC layer carries the basic beacon structure that Zigbee then extends with network-specific fields.

Now, we can force the endpoint to leave its network by abusing how Zigbee handles PAN conflicts. If a coordinator sees beacons from another coordinator using the same PAN ID and the same channel, it may trigger a PAN ID conflict resolution. When that happens, the coordinator can instruct its nodes to change PAN ID and rejoin, which causes them to leave and then attempt to join again. That rejoin window gives us an opportunity to advertise a spoofed coordinator and capture the joining node.

In the capture shown below, packet 7 is a beacon generated by our spoofed coordinator using the same PAN ID as the real network. As a result, the endpoint with the address 0xe8fa leaves the network (see packets 14–16).

Choose me

After forcing the endpoint to leave its original network by sending a fake beacon, the next step is to make the endpoint choose our spoofed coordinator. At this point, we assume we already have the necessary keys (network and link keys) and understand how the application behaves.

To impersonate the original coordinator, our spoofed coordinator must reply to any beacon request the endpoint sends. The beacon response must include the same Extended PAN ID (and other fields) that the endpoint expects. If the endpoint deems our beacon acceptable, it may attempt to join us.

I can think of two ways to make the endpoint prefer our coordinator.

  1. Jam the real coordinator
    Use a device that reduces the real coordinator’s signal at the endpoint so that it appears weaker, forcing the endpoint to prefer our beacon. This requires extra hardware.
  2. Exploit undefined or vendor-specific behavior
    Zigbee stacks sometimes behave slightly differently across vendors. One useful field in a beacon is the Update ID field. It increments when a coordinator changes network configuration.

If two coordinators advertise the same Extended PAN ID but one has a higher Update ID, some stacks will prefer the beacon with the higher Update ID. This is undefined behavior across implementations; it works on some stacks but not on others. In my experience, sometimes it works and sometimes it fails. There are lots of other similar quirks we can try during an assessment.

Even if the endpoint chooses our fake coordinator, the connection may be unstable. One main reason for that is the timing. The endpoint expects ACKs for the frames it sends to the coordinator, as well as fast responses regarding connection initiation packets. If our responder is implemented in Python on a laptop that receives packets, builds responses, and forwards them to a dongle, the round trip will be too slow. The endpoint will not receive timely ACKs or packets and will drop the connection.

In short, we’re not just faking a few packets; we’re trying to reimplement parts of Zigbee and IEEE 802.15.4 that must run quickly and reliably. This is usually too slow for production stacks when done in high-level, interpreted code.

A practical fix is to run a real Zigbee coordinator stack directly on the dongle. For example, the nRF52840 dongle can act as a coordinator if flashed with the right Nordic SDK firmware (see Nordic’s network coordinator sample). That provides the correct timing and ACK behavior needed for a stable connection.

However, that simple solution has one significant disadvantage. In industrial deployments we often run into incompatibilities. In my tests I compared beacons from the real coordinator and the Nordic coordinator firmware. Notable differences were visible in stack profile headers:

The stack profile identifies the network profile type. Common values include 0x00, which is a network-specific (private) profile, and 0x02, which is a Zigbee Pro (public) profile.

If the endpoint expects a network-specific profile (i.e., it uses a private vendor profile) and we provide Zigbee Pro, the endpoint will refuse to join. Devices that only understand private profiles will not join public-profile networks, and vice versa. In my case, I could not change the Nordic firmware to match the proprietary stack profile, so the endpoint refused to join.

Because of this discrepancy, the “flash a coordinator firmware on the dongle” fix was ineffective in that environment. This is why the standard off-the-shelf tools and firmware often fail in industrial cases, forcing us to continue working with and optimizing our custom setup instead.

Back to the roots

In our previous test setup we used a sniffer in promiscuous mode, which receives every frame on the air regardless of destination. Real Zigbee (IEEE 802.15.4) nodes do not work like that. At the MAC/802.15.4 layer, a node filters frames by PAN ID and destination address. A frame is only passed to upper layers if the PAN ID matches and the destination address is the node’s address or a broadcast address.

We can mimic that real behavior on the dongle by running Zephyr RTOS and making the dongle act as a basic 802.15.4 coordinator. In that role, we set a PAN ID and short network address on the dongle so that the radio only accepts frames that match those criteria. This is important because it allows the dongle to handle auto-ACKs and MAC-level timing: the dongle will immediately send ACKs at the MAC level.

With the dongle doing MAC-level work (sending ACKs and PAN filtering), we can implement the Zigbee logic in Python. Scapy helps a lot with packet construction: we can create our own beacons with the headers matching those of the original coordinator, which solves the incompatibility problem. However, we must still implement the higher-level Zigbee state machine in our code, including connection initiation, association, network key handling, APS/AF behavior, and application payload handling. That’s the hardest part.

There is one timing problem that we cannot solve in Python: the very first steps of initiating a connection require immediate packet responses. To handle this issue, we implemented the time-critical parts in C on the dongle firmware. For example, we can statically generate the packets for connection initiation in Python and hard-code them in the firmware. Then, using “if” statements, we can determine how to respond to each packet from the endpoint.

So, we let the dongle (C/Zephyr) handle MAC-level ACKs and the initial association handshake, but let Python build higher-level packets and instruct the dongle what to send next when dealing with the application level. This hybrid model reduces latency and maintains a stable connection. The final architecture looks like this:

Deliver the key

Here’s a quick recap of how joining works: a Zigbee endpoint broadcasts beacon requests across channels, waits for beacon responses, chooses a coordinator, and sends an association request, followed by a data request to identify its short address. The coordinator then sends a transport key packet containing the network key. If the endpoint has the correct link key, it can decrypt the transport key packet and obtain the network key, meaning it has now been authenticated. From that point on, network traffic is encrypted with the network key. The entire process looks like this:

The sticking point is the transport key packet. This packet is protected using the link key, a per-device key shared between the coordinator (Trust Center) and the joining endpoint. Before the link key can be used for encryption, it often needs to be processed (hashed/derived) according to Zigbee’s key derivation rules. Since there is no trivial Python implementation that implements this hashing algorithm, we may need to implement the algorithm ourselves.

I implemented the required key derivation; the code is available on our GitHub.

Now that we’ve managed to obtain the hashed link key and deliver it to the endpoint, we can successfully mimic a coordinator.

The final success

If we follow the steps above, we can get the endpoint to join our spoofed coordinator. Once the endpoint joins, it will often remain associated with our coordinator, even after we power it down (until another event causes it to re-evaluate its connection). From that point on, we can interact with the device at the application layer using Python. Getting access as a coordinator allowed us to switch the relay on and off as intended, but also provided much more functionality and control over the node.

Conclusion

In conclusion, this study demonstrates why private vendor profiles in industrial environments complicate assessments: common tools and frameworks often fail, necessitating the development of custom tools and firmware. We tested a simple two-node scenario, but with multiple nodes the attack surface changes drastically and new attack vectors emerge (for example, attacks against routing protocols).

As we saw, a misconfigured Zigbee setup can lead to a complete network compromise. To improve Zigbee security, use the latest specification’s security features, such as using installation codes to derive unique link keys for each device. Also, avoid using hard-coded or default keys. Finally, it is not recommended to use the network key encryption model. Add another layer of security in addition to the network level protection by using end-to-end encryption at the application level.

Hunting for Mythic in network traffic

Post-exploitation frameworks

Threat actors frequently employ post-exploitation frameworks in cyberattacks to maintain control over compromised hosts and move laterally within the organization’s network. While they once favored closed-source frameworks, such as Cobalt Strike and Brute Ratel C4, open-source projects like Mythic, Sliver, and Havoc have surged in popularity in recent years. Malicious actors are also quick to adopt relatively new frameworks, such as Adaptix C2.

Analysis of popular frameworks revealed that their development focuses heavily on evading detection by antivirus and EDR solutions, often at the expense of stealth against systems that analyze network traffic. While obfuscating an agent’s network activity is inherently challenging, agents must inevitably communicate with their command-and-control servers. Consequently, an agent’s presence in the system and its malicious actions can be detected with the help of various network-based intrusion detection systems (IDS) and, of course, Network Detection and Response (NDR) solutions.

This article examines methods for detecting the Mythic framework within an infrastructure by analyzing network traffic. This framework has gained significant traction among various threat actors, including Mythic Likho (Arcane Wolf) и GOFFEE (Paper Werewolf), and continues to be used in APT and other attacks.

The Mythic framework

Mythic C2 is a multi-user command and control (C&C, or C2) platform designed for managing malicious agents during complex cyberattacks. Mythic is built on a Docker container architecture, with its core components – the server, agents, and transport modules – written in Python. This architecture allows operators to add new agents, communication channels, and custom modifications on the fly.

Since Mythic is a versatile tool for the attacker, from the defender’s perspective, its use can align with multiple stages of the Unified Kill Chain, as well as a large number of tactics, techniques, and procedures in the MITRE ATT&CK® framework.

  • Pivoting is a tactic where the attacker uses an already compromised system as a pivot point to gain access to other systems within the network. In this way, they gradually expand their presence within the organization’s infrastructure, bypassing firewalls, network segmentation, and other security controls.
  • Collection (TA0009) is a tactic focused on gathering and aggregating information of value to the attacker: files, credentials, screenshots, and system logs. In the context of network operations, collection is often performed locally on compromised hosts, with data then packaged for transfer. Tools like Mythic automate the discovery and selection of data sought by the adversary.
  • Exfiltration (TA0010) is the process of moving collected information out of the secured network via legitimate or covert channels, such as HTTP(s), DNS, or SMB, etc. Attackers may use resident agents or intermediate relays (pivot hosts) to conceal the exfiltration source and route.
  • Command and Control (TA0011) encompasses the mechanisms for establishing and maintaining a communication channel between the operator and compromised hosts to transmit commands and receive status updates. This includes direct connections, relaying through pivot hosts, and the use of covert protocols. Frameworks like Mythic provide advanced C2 capabilities, such as scheduled command execution, tunneling, and multi-channel communication, which complicate the detection and blocking of their activity.

This article focuses exclusively on the Command and Control (TA0011) tactic, whose techniques can be effectively detected within the network traffic of Mythic agents.

Detecting Mythic agent activity in network traffic

At the time of writing, Mythic supports data transfer over HTTP/S, WebSocket, TCP, SMB, DNS, and MQTT. The platform also boasts over a dozen different agents, written in Go, Python, and C#, designed for Windows, macOS, and Linux.

Mythic employs two primary architectures for its command network:

  • In this model, agents communicate with adjacent agents forming a chain of connections which eventually leads to a node communicating directly with the Mythic C2 server. For this purpose, agents utilize TCP and SMB.
  • In this model, agents communicate directly with the C2 server via HTTP/S, WebSocket, MQTT, or DNS.

P2P communication

Mythic provides pivoting capabilities via named SMB pipes and TCP sockets. To detect Mythic agent activity in P2P mode, we will examine their network traffic and create corresponding Suricata detection rules (signatures).

P2P communication via SMB

When managing agents via the SMB protocol, a named pipe is used by default for communication, with its name matching the agent’s UUID.

Although this parameter can be changed, it serves as a reliable indicator and can be easily described with a regular expression. Example:
[a-z0-9]{8}\-[a-z0-9]{4}\-[a-z0-9]{4}\-[a-z0-9]{4}\-[a-z0-9]{12}

For SMB communication, agents encode and encrypt data according to the pattern: base64(UUID+AES256(JSON)). This data is then split into blocks and transmitted over the network. The screenshot below illustrates what a network session for establishing a connection between agents looks like in Wireshark.

Commands and their responses are packaged within the MythicMessage data structure. This structure contains three header fields, as well as the commands themselves or the corresponding responses:

  • Total size (4 bytes)
  • Number of data blocks (4 bytes)
  • Current block number (4 bytes)
  • Base64-encoded data

The screenshot below shows an example of SMB communication between agents.

The agent (10.63.101.164) sends a command to another agent in the MythicMessage format. The first three Write Requests transmit the total message size, total number of blocks, and current block number. The fourth request transmits the Base64-encoded data. This is followed by a sequence of Read Requests, which are also transmitted in the MythicMessage format.

Below are the data transmitted in the fourth field of the MythicMessage structure.

The content is encoded in Base64. Upon decoding, the structure of the transmitted information becomes visible: it begins with the UUID of the infected host, followed by a data block encrypted using AES-256.

The fact that the data starts with a UUID string can be leveraged to create a signature-based detection rule that searches network packets for the identifier pattern.

To search for packets containing a UUID, the following signature can be applied. It uses specific request types and protocol flags as filters (Command: Ioctl (11), Function: FSCTL_PIPE_WAIT (0x00110018)), followed by a check to see if the pipe name matches the UUID pattern.

alert tcp any any -> any [139, 445] (msg: "Trojan.Mythic.SMB.C&C"; flow: to_server, established; content: "|fe|SMB"; offset: 4; depth: 4; content: "|0b 00|"; distance: 8; within: 2; content: "|18 00 11 00|"; distance: 48; within: 12; pcre: "/\x48\x00\x00\x00[\x00-\xFF]{2}([a-z0-9]\x00){8}\-\x00([a-z0-9]\x00){4}\-\x00([a-z0-9]\x00){4}\-\x00([a-z0-9]\x00){4}\-\x00([a-z0-9]\x00){12}$/R"; threshold: type both, track by_src, count 1, seconds 60; reference: url, https://github.com/MythicC2Profiles/smb; classtype: ndr1; sid: 9000101; rev: 1;)

Agent activity can also be detected by analyzing data transmitted in SMB WriteRequest packets with the protocol flag Command: Write (9) and a distinct packet structure where the BlobOffset and BlobLen fields are set to zero. If the Data field is Base64-encoded and, after decoding, begins with a UUID-formatted string, this indicates a command-and-control channel.

alert tcp any any -> any [139, 445] (msg: "Trojan.Mythic.SMB.C&C"; flow: to_server, established; dsize: > 360; content: "|fe|SMB"; offset: 4; depth: 4; content: "|09 00|"; distance: 8; within: 2; content: "|00 00 00 00 00 00 00 00 00 00 00 00|"; distance: 86; within: 12; base64_decode: bytes 64, offset 0, relative; base64_data; pcre: "/^[a-z0-9]{8}\-[a-z0-9]{4}\-[a-z0-9]{4}\-[a-z0-9]{4}\-[a-z0-9]{12}/"; threshold: type both, track by_src, count 1, seconds 60; reference: url, https://github.com/MythicC2Profiles/smb; classtype: ndr1; sid: 9000102; rev: 1;)

Below is the KATA NDR user interface displaying an alert about detecting a Mythic agent operating in P2P mode over SMB. In this instance, the first rule – which checks the request type, protocol flags, and the UUID pattern – was triggered.

It should be noted that these signatures have a limitation. If the SMBv3 protocol with encryption enabled is used, Mythic agent activity cannot be detected with signature-based methods. A possible alternative is behavioral analysis. However, in this context, it suffers from low accuracy and a high false-positive rate. The SMB protocol is widely used by organizations for various legitimate purposes, making it difficult to isolate behavioral patterns that definitively indicate malicious activity.

P2P communication via TCP

Mythic also supports P2P communications via TCP. The connection initialization process appears in network traffic as follows:

As with SMB, the MythicMessage structure is used for transmitting and receiving data. First, the data length (4 bytes) is sent as a big-endian DWORD in a separate packet. Subsequent packets transmit the number of data blocks, the current block number, and the data itself. However, unlike SMB packets, the value of the current block number field is always 0x00000000, due to TCP’s built-in packet fragmentation support.

The data encoding scheme is also analogous to what we observed with SMB and appears as follows: base64(UUID+AES256(JSON)). Below is an example of a network packet containing Mythic data.

The decoded data appears as follows:

Similar to communication via SMB, signature-based detection rules can be created for TCP traffic to identify Mythic agent activity by searching for packets containing UUID-formatted strings. Below are two Suricata detection rules. The first rule is a utility rule. It does not generate security alerts but instead tags the TCP session with an internal flag, which is then checked by another rule. The second rule verifies the flag and applies filters to confirm that the current packet is being analyzed at the beginning of a network session. It then decodes the Base64 data and searches the resulting content for a UUID-formatted string.

alert tcp any any -> any any (msg: "Trojan.Mythic.TCP.C&C"; flow: from_server, established; dsize: 4; stream_size: server, <, 6; stream_size: client, <, 3; content: "|00 00|"; depth: 2; pcre: "/^\x00\x00[\x00-\x5C]{1}[\x00-\xFF]{1}$/"; flowbits: set, mythic_tcp_p2p_msg_len; flowbits: noalert; threshold: type both, track by_src, count 1, seconds 60; reference: url, https://github.com/MythicC2Profiles/tcp; classtype: ndr1; sid: 9000103; rev: 1;)

alert tcp any any -> any any (msg: "Trojan.Mythic.TCP.C&C"; flow: from_server, established; dsize: > 300; stream_size: server, <, 6000; stream_size: client, <, 6000; flowbits: isset, mythic_tcp_p2p_msg_len; content: "|00 00 00|"; depth: 3; content: "|00 00 00 00|"; distance: 1; within: 4; base64_decode: bytes 64, offset 0, relative; base64_data; pcre: "/^[a-z0-9]{8}\-[a-z0-9]{4}\-[a-z0-9]{4}\-[a-z0-9]{4}\-[a-z0-9]{12}/"; threshold: type both, track by_src, count 1, seconds 60; reference: url, https://github.com/MythicC2Profiles/tcp; classtype: ndr1; sid: 9000104; rev: 1;)

Below is the NDR interface displaying an example of the two rules detecting a Mythic agent operating in P2P mode over TCP.

Egress transport modules

Covert Egress communication

For stealthy operations, Mythic allows agents to be managed through popular services. This makes its activity less conspicuous within network traffic. Mythic includes transport modules based on the following services:

  • Discord
  • GitHub
  • Slack

Of these, only the first two remain relevant at the time of writing. Communication via Slack (the Slack C2 Profile transport module) is no longer supported by the developers and is considered deprecated, so we will not examine it further.

The Discord C2 Profile transport module

The use of the Discord service as a mediator for C2 communication within the Mythic framework has been gaining popularity recently. In this scenario, agent traffic is indistinguishable from normal Discord activity, with commands and their execution results masquerading as messages and file attachments. Communication with the server occurs over HTTPS and is encrypted with TLS. Therefore, detecting Mythic traffic requires decrypting this.

Analyzing decrypted TLS traffic

Let’s assume we are using an NDR platform in conjunction with a network traffic decryption (TLS inspection) system to detect suspicious network activity. In this case, we operate under the assumption that we can decrypt all TLS traffic. Let’s examine possible detection rules for that scenario.

Agent and server communication occurs via Discord API calls to send messages to a specific channel. Communication between the agent and Mythic uses the MythicMessageWrapper structure, which contains the following fields:

  • message: the transmitted data
  • sender_id: a GUID generated by the agent, included in every message
  • to_server: a direction flag – a message intended for the server or the agent
  • id: not used
  • final: not used

Of particular interest to us is the message field, which contains the transmitted data encoded in Base64. The MythicMessageWrapper message is transmitted in plaintext, making it accessible to anyone with read permissions for messages on the Discord server.

Below is an example of data transmission via messages in a Discord channel.

To establish a connection, the agent authenticates to the Discord server via the API call /api/v10/gateway/bot. We observe the following data in the network traffic:

After successful initialization, the agent gains the ability to receive and respond to commands. To create a message in the channel, the agent makes a POST request to the API endpoint /channels/<channel.id>/messages. The network traffic for this call is shown in the screenshot below.

After decoding the Base64, the content of the message field appears as follows:

A structure characteristic of a UUID is visible at the beginning of the packet.

After processing the message, the agent deletes it from the channel via a DELETE request to the API endpoint /channels/{channel.id}/messages/{message.id}.

Below is a Suricata rule that detects the agent’s Discord-based communication activity. It checks the API activity for creating HTTP messages for the presence of Base64-encoded data containing the agent’s UUID.

alert tcp any any -> any any (msg: "Trojan.Mythic.HTTP.C&C"; flow: to_server, established; content: "POST"; http_method; content: "/api/"; http_uri; content: "/channels/"; distance: 0; http_uri; pcre: "/\/messages$/U"; content: "|7b 22|content|22|"; depth: 20; http_client_body; content: "|22|sender_id"; depth: 1500; http_client_body; pcre: "/\x22sender_id\x5c\x22\x3a\x5c\x22[a-z0-9]{8}\-[a-z0-9]{4}\-[a-z0-9]{4}\-[a-z0-9]{4}\-[a-z0-9]{12}/"; threshold: type both, track by_src, count 1, seconds 60; reference: url, https://github.com/MythicC2Profiles/discord; classtype: ndr1; sid: 9000105; rev: 1;)

Below is the NDR user interface displaying an example of detecting the activity of the Discord C2 Profile transport module for a Mythic agent within decrypted HTTP traffic.

Analyzing encrypted TLS traffic

If Discord usage is permitted on the network and there is no capability to decrypt traffic, it becomes nearly impossible to detect agent activity. In this scenario, behavioral analysis of requests to the Discord server may prove useful. Below is network traffic showing frequent TLS connections to the Discord server, which could indicate commands being sent to an agent.

In this case, we can use a Suricata rule to detect the frequent TLS sessions with Discord servers:

alert tcp any any -> any any (msg: "NetTool.PossibleMythicDiscordEgress.TLS.C&C"; flow: to_server, established; tls_sni; content: "discord.com"; nocase; threshold: type both, track by_src, count 4, seconds 420; reference: url, https://github.com/MythicC2Profiles/discord; classtype: ndr3; sid: 9000106; rev: 1;)

Another method for detecting these communications involves tracking multiple DNS queries to the discord.com domain.

The following rule can be applied to detect these:

alert udp any any -> any 53 (msg: "NetTool.PossibleMythicDiscordEgress.DNS.C&C"; content: "|01 00 00 01 00 00 00 00 00 00|"; depth: 10; offset: 2; content: "|07|discord|03|com|00|"; nocase; distance: 0; threshold: type both, track by_src, count 4, seconds 60; reference: url, https://github.com/MythicC2Profiles/discord; classtype: ndr3; sid: 9000107; rev: 1;)

Below is the NDR user interface showing an example of a custom rule in operation, detecting the activity of the Discord C2 Profile transport module for a Mythic agent within encrypted traffic based on characteristic DNS queries.

The proposed rule options have low accuracy and can generate a high number of false positives. Therefore, they must be adapted to the specific characteristics of the infrastructure in which they will run. Threshold and count parameters, which control the triggering frequency and time window, require tuning.

GitHub C2 Profile transport module

GitHub’s popularity has made it an attractive choice as a mediator for managing Mythic agents. The core concept is the same as in other covert Egress communication transport modules. Communication with GitHub utilizes HTTPS. Successful operation requires an account on the target platform and the ability to communicate via API calls. The transport module utilizes the GitHub API to send comments to pre-created Issues and to commit files to a branch within a repository controlled by the attackers. In this model, the agent interacts only with GitHub: it creates and reads comments, uploads files, and manages branches. It does not communicate with any other servers. The communication algorithm via GitHub is as follows:

  1. The agent posts a comment (check-in) to a designated Issue on GitHub, intended for agents to report their results.
  2. The Mythic server validates the comment, deletes it, and posts a reply in an issue designated for server use.
  3. The agent creates a branch with a name matching its UUID and writes a get_tasking file to it (performs a push request).
  4. The Mythic server reads the file and writes a response file to the same branch.
  5. The agent reads the response file, deletes the branch, pauses, and repeats the cycle.
Analyzing decrypted TLS traffic

Let’s consider an approach to detecting agent activity when traffic decryption is possible.

Agent communication with the server utilizes API calls to GitHub. The payload is encoded in Base64 and published in plaintext; therefore, anyone who can view the repository or analyze the traffic contents can decode it.

Analysis of agent communication revealed that the most useful traffic for creating detection rules is associated with publishing check-in comments, creating a branch, and publishing a file.

During the check-in phase, the agent posts a comment to register a new agent and establish communication.

The transmitted data is encoded in Base64 and contains the agent’s UUID and the portion of the message encrypted using AES-256.

This allows for a signature that detects UUID-formatted substrings within GitHub comment creation requests.

alert tcp any any -> any any (msg: "Trojan.Mythic.HTTP.C&C"; flow: to_server, established; content: "POST"; http_method; content: "api.github.com"; http_host; content: "/repos/"; depth: 8; http_uri; pcre: "/\/comments$/U"; content: "|22|body|22|"; depth: 8; http_client_body; base64_decode: bytes 300, offset 2, relative; base64_data; pcre: "/^[a-z0-9]{8}\-[a-z0-9]{4}\-[a-z0-9]{4}\-[a-z0-9]{4}\-[a-z0-9]{12}/"; threshold: type both, track by_src, count 1, seconds 60; reference: url, https://github.com/MythicC2Profiles/github; classtype: ndr1; sid: 9000108; rev: 1;)

Another stage suitable for detection is when the agent creates a separate branch with its UUID as the name. All subsequent relevant communication with the server will occur within this branch. Here is an example of a branch creation request:

Therefore, we can create a detection rule to identify UUID-formatted strings within branch creation requests.

alert tcp any any -> any any (msg: "Trojan.Mythic.HTTP.C&C"; flow: to_server, established; content: "POST"; http_method; content: "api.github.com"; http_host; content: "/repos/"; depth: 100; http_uri; content: "/git/refs"; distance: 0; http_uri; content: "|22|ref|22 3a|"; depth: 10; http_client_body; content: "refs/heads/"; distance: 0; within: 50; http_client_body; pcre: "/refs\/heads\/[a-z0-9]{8}\-[a-z0-9]{4}\-[a-z0-9]{4}\-[a-z0-9]{4}\-[a-z0-9]{12}\x22/"; threshold: type both, track by_src, count 1, seconds 60; reference: url, https://github.com/MythicC2Profiles/github; classtype: ndr1; sid: 9000109; rev: 1;)

After creating the branch, the agent writes a file to it (sends a push request), which contains Base64-encoded data.

Therefore, we can create a rule to trigger on file publication requests to a branch whose name matches the UUID pattern.

alert tcp any any -> any any (msg: "Trojan.Mythic.HTTP.C&C"; flow: to_server, established; content: "PUT"; http_method; content: "api.github.com"; http_host; content: "/repos/"; depth:8; http_uri; content: "/contents/"; distance: 0; http_uri; content: "|22|content|22|"; depth: 100; http_client_body; pcre: "/\x22message\x22\x3a\x22[a-z0-9]{8}\-[a-z0-9]{4}\-[a-z0-9]{4}\-[a-z0-9]{4}\-[a-z0-9]{12}\x22/"; threshold: type both, track by_src, count 1, seconds 60; reference: url, https://github.com/MythicC2Profiles/github; classtype: ndr1; sid: 9000110; rev: 1;)

The screenshot below shows how the NDR solution logs all suspicious communications using the GitHub API and subsequently identifies the Mythic agent’s activity. The result is an alert with the verdict Trojan.Mythic.HTTP.C&C.

Analyzing encrypted TLS traffic

Communication with GitHub occurs over HTTPS; therefore, in the absence of traffic decryption capability, signature-based methods for detecting agent activity cannot be applied. Let’s consider a behavioral agent activity detection approach.

For instance, it is possible to detect connections to GitHub servers that are atypical in frequency and purpose, originating from network segments where this activity is not expected. The screenshot below shows an example of an agent’s multiple TLS sessions. The traffic reflects the execution of several commands, as well as idle time, manifested as constant polling of the server while awaiting new tasks.

Multiple TLS sessions with the GitHub service from uncharacteristic network segments can be detected using the rule presented below:

alert tcp any any -> any any (msg:"NetTool.PossibleMythicGitHubEgress.TLS.C&C"; flow: to_server, established; tls_sni; content: "api.github.com"; nocase; threshold: type both, track by_src, count 4, seconds 60; reference: url, https://github.com/MythicC2Profiles/github; classtype: ndr3; sid: 9000111; rev: 1;)

Additionally, multiple DNS queries to the service can be logged in the traffic.

This activity is detected with the help of the following rule:

alert udp any any -> any 53 (msg: "NetTool.PossibleMythicGitHubEgress.DNS.C&C"; content: "|01 00 00 01 00 00 00 00 00 00|"; depth: 10; offset: 2; content: "|03|api|06|github|03|com|00|"; nocase; distance: 0; threshold: type both, track by_src, count 12, seconds 180; reference: url, https://github.com/MythicC2Profiles/github; classtype: ndr3; sid: 9000112; rev: 1;)

The screenshot below shows the NDR interface with an example of the first rule in action, detecting traces of the GitHub profile activity for a Mythic agent within encrypted TLS traffic.

The suggested rule options can produce false positives, so to improve their effectiveness, they must be adapted to the specific characteristics of the infrastructure in which they will run. The parameters of the threshold keyword – specifically the count and seconds values, which control the number of events required to generate an alert and the time window for their occurrence in NDR – must be configured.

Direct Egress communication

The Egress communication model allows agents to interact directly with the C2 server via the following protocols:

  • HTTP(S)
  • WebSocket
  • MQTT
  • DNS

The first two protocols are the most prevalent. The DNS-based transport module is still under development, and the module based on MQTT sees little use among operators. We will not examine them within the scope of this article.

Communication via HTTP

HTTP is the most common protocol for building a Mythic agent control network. The HTTP transport container acts as a proxy between the agents and the Mythic server. It allows data to be transmitted in both plaintext and encrypted form. Crucially, the metadata is not encrypted, which enables the creation of signature-based detection rules.

Below is an example of unencrypted Mythic network traffic over HTTP. During a GET request, data encoded in Base64 is passed in the value of the query parameter.

After decoding, the agent’s UUID – generated according to a specific pattern – becomes visible. This identifier is followed by a JSON object containing the key parameters of the host, collected by the agent.

If data encryption is applied, the network traffic for agent communication appears as shown in the screenshot below.

After decrypting the traffic and decoding from Base64, the communication data reveals the familiar structure: UUID+AES256(JSON).

Therefore, to create a detection signature for this case, we can also rely on the presence of a UUID within the Base64-encoded data in POST requests.

alert tcp any any -> any any (msg: "Trojan.Mythic.HTTP.C&C"; flow: to_server, established; content: "POST"; http_method; content: "|0D 0A 0D 0A|"; base64_decode: bytes 80, offset 0, relative; base64_data; content: "-"; offset: 8; depth: 1; content: "-"; distance: 4; within: 1; content: "-"; distance: 4; within: 1; content: "-"; distance: 4; within: 1; pcre: "/[0-9a-fA-F]{8}\-[0-9a-fA-F]{4}\-[0-9a-fA-F]{4}\-[0-9a-fA-F]{4}\-[0-9a-fA-F]{12}/"; threshold: type both, track by_src, count 1, seconds 180; reference: md5, 6ef89ccee639b4df42eaf273af8b5ffd; classtype: trojan1; sid: 9000113; rev: 2;)

The screenshot below shows how the NDR platform detects agent communication with the server over HTTP, generating an alert with the name Trojan.Mythic.HTTP.C&C.

Communication via HTTPS

Mythic agents can communicate with the server via HTTPS using the corresponding transport module. In this case, data is encrypted with TLS and is not amenable to signature-based analysis. However, the activity of Mythic agents can be detected if they use the default SSL certificate. Below is an example of network traffic from a Mythic agent with such a certificate.

For this purpose, the following signature is applied:

alert tcp any any -> any any (msg:"Trojan.Mythic.TLS.C&C"; flow:established, from_server; content:"|16 03|"; depth:2; content:"|0B|"; distance:3; within:1; content:"|55 04|"; distance:0; content:"|09|Mythic C2"; nocase; distance:0; threshold:type both,track by_src,count 1,seconds 60; reference:url,github.com/its-a-feature/Mythic; classtype:ndr1; sid:9000114; rev:1;)

WebSocket

The WebSocket protocol enables full-duplex communication between a client and a remote host. Mythic can utilize it for agent management.

The process of agent communication with the server via WebSocket is as follows:

  1. The agent sends a request to the WebSocket container to change the protocol for the HTTP(S) connection.
  2. The agent and the WebSocket container switch to WebSocket to send and receive messages.
  3. The agent sends a message to the WebSocket container requesting tasks from the Mythic container.
  4. The WebSocket container forwards the request to the Mythic container.
  5. The Mythic container returns the tasks to the WebSocket container.
  6. The WebSocket container forwards these tasks to the agent.

It is worth mentioning that in this communication model, both the WebSocket container and the Mythic container reside on the Mythic server. Below is a screenshot of the initial agent connection to the server.

An analysis of the TCP session shows that the actual data is transmitted in the data field in Base64 encoding.

Decoding reveals the familiar data structure: UUID+AES256(JSON).

Therefore, we can use an approach similar to those discussed above to detect agent activity. The signature should rely on the UUID string at the beginning of the data field. The rule first verifies that the session data matches the data:base64 format, then decodes the data field and searches for a string matching the UUID pattern.

alert tcp any any -> any any (msg: "Trojan.Mythic.WebSocket.C&C"; flow: established, from_server; content: "|7B 22|data|22 3a 22|"; depth: 14; pcre: "/^[0-9a-zA-Z\/\+]+[=]{0,2}\x22\x7D\x0A$/R"; content: "|7B 22|data|22 3a 22|"; depth: 14; base64_decode: bytes 48, offset 0, relative; base64_data; pcre: "/^[a-z0-9]{8}\-[a-z0-9]{4}\-[a-z0-9]{4}\-[a-z0-9]{4}\-[a-z0-9]{12}/i"; threshold: type both, track by_src, count 1, seconds 30; reference: url, https://github.com/MythicAgents/; classtype: ndr1; sid: 9000115; rev: 2;)

Below is the Trojan.Mythic.WebSocket.C&C signature triggering on Mythic agent communication over WebSocket.

Takeaways

The Mythic post-exploitation framework continues to gain popularity and evolve rapidly. New agents are emerging, designed for covert persistence within target infrastructures. Despite this evolution, the various implementations of network communication in Mythic share many common characteristics that remain largely consistent over time. This consistency enables IDS/NDR solutions to effectively detect the framework’s agent activity through network traffic analysis.

Mythic supports a wide array of agent management options utilizing several network protocols. Our analysis of agent communications across these protocols revealed that agent activity can be detected by searching for specific data patterns within network traffic. The primary detection criterion involves tracking UUID strings in specific positions within Base64-encoded transmitted data. However, while the general approach to detecting agent activity is similar across protocols, each requires protocol-specific filters. Consequently, creating a single, universal signature for detecting Mythic agents in network traffic is challenging; individual detection rules must be crafted for each protocol. This article has provided signatures that are included in Kaspersky NDR.

Kaspersky NDR is designed to identify current threats within network infrastructures. It enables the detection of all popular post-exploitation frameworks based on their characteristic traffic patterns. Since the network components of these frameworks change infrequently, employing an NDR solution ensures high effectiveness in agent discovery.

Kaspersky verdicts in Kaspersky solutions (Kaspersky Anti-Targeted Attack with NDR module and Kaspersky NGFW)

Trojan.Mythic.SMB.C&C
Trojan.Mythic.TCP.C&C
Trojan.Mythic.HTTP.C&C
Trojan.Mythic.TLS.C&C
Trojan.Mythic.WebSocket.C&C

❌