There’s a lot to security that isn’t necessarily “cyber.” It’s not all hackers or complex network attacks.
Alongside traditional cyberattacks that deploy malware or exploit known software vulnerabilities, there are also less technical—yet equally devastating—forms of theft.
This doesn’t mean that well-known cybersecurity best practices don’t apply. Every small business owner should still use unique passwords for every account, turn on multi-factor authentication, keep their software and operating systems updated, and run always-on cybersecurity software.
But for the everyday small business owner juggling dozens of accounts, networks, devices, and the reams of data being created, stored, and shared across text messages, emails, and online portals, this advice is for you.
For National Small Business Week in the US, here are three ways to protect your business that require little technical prowess.
Don’t use your Social Security Number as your tax ID
In the US, the Internal Revenue Service (IRS) allows small business owners to use their personal Social Security Number (SSN) as the Federal Tax ID. It’s a small grace meant to simplify annual record-keeping for sole proprietors and owner-employees, but for cybercriminals, it’s a basic oversight they’d like every small business to make.
Using your Social Security Number as your Federal Tax ID means putting your Social Security Number in an ever-increasing number of hands. That’s because small business taxes are different from taxes for everyday salaried employees.
Whenever a small business takes on a new client or a contractor who pays for services costing at least $600, that small business has to share and receive what is called a W-9 form. This exact form isn’t filed with the IRS, but it is used to track payments for later filings.
What’s more important, though, is that this form asks for an owner’s name, address, and tax ID number.
This means that as a small business grows, its vulnerability to identity theft increases in tandem. Every W-9 filed that uses an owner’s SSN as their tax ID number is another opportunity for that SSN to be stolen. After just one year of operation, a small business owner’s SSN could end up in the inboxes, filing cabinets, and cloud drives of a dozen different people and companies.
This is exactly what cybercriminals want.
Equipped with a W-9 form about your business, a cybercriminal could impersonate you or your business. They could open a business credit line, file fraudulent returns that claim your small business income, or scam your clients.
How to stay safe:
Apply for a free Employer Identification Number (EIN) at IRS.gov. It’s quick to do and it separates your business tax identity from your personal tax identity. After that, put the EIN on W-9s, 1099s, and all other business paperwork instead of your SSN.
Keep your personal cloud storage personal
The most popular cloud storage for most small business owners is the cloud storage they already have—their personal Google Drive or iCloud.
Built to make memory archival as easy as possible, these tools can automatically back up and secure nearly every single moment that happens through your device, from the vacation photos you snapped last summer, to your kid’s first steps recorded on video, to the texts you sent, the notes you made, and the calendar appointments you managed.
But this type of automatic archival poses a threat to any non-personal information that you view, send, markup, or sign when using your personal smartphone. Suddenly, and often without thinking about it, your cloud storage has backups of signed contracts, tax returns, client intake forms, invoices, business financial statements, and photos of physical paperwork.
Above, we warned about using your SSN as your tax ID because it creates a risk if anyone in your business network is breached. But storing client information in your personal cloud storage creates a different problem: it puts that risk directly on you.
Compounding the threat here is the fact that many personal cloud storage accounts are shared with family members. More people accessing the same account means more exposure and more chances for mistakes, even if everyone has good intentions.
How to stay safe:
Go through the cloud backup settings on both your phone and your computer and manage what data is being synced. Move sensitive business files to a dedicated business storage account with proper access controls, sharing permissions, and audit logs—something that can tell you who opened a file and when.
If anything business-related has to live in a personal cloud account, give that account a strong, unique password, turn on multi-factor authentication, and don’t share access with anyone who isn’t you.
Protect device and account access in the home
Devices have a funny way of moving around. Your smartphone goes into your spouse’s hands as they override your music choices in the car. Your tablet ends most nights in your kid’s bedroom as they watch TV. And your laptop gets tugged around from couch to counter to kitchen table—each time fully opened and logged in, a portal to the web.
You trust everyone in your home to act safely online, but the path to online safety is full of mistakes.
A single errant click on a fake ad, a malicious search result, or a disguised download is all it takes to compromise your device today, along with all your small business records.
Aside from the threat of malware, someone using your device could make purchases, accidentally delete files, and overwrite important documents.
Remember, an “insider threat” doesn’t need to be malicious to cause damage—they just need to be inside your network (which in this, is your home).
How to stay safe:
Treat your devices that you use for work as work devices. That means requiring a passcode or password for device entry, along with multi-factor authentication for important business accounts.
Also, to ensure that any wrong click doesn’t lead to a malicious PDF download or a wayward malware installation, use always-on antimalware protection software, like Malwarebytes for Teams.
Secure your success
It’s easy to get overwhelmed with modern cybersecurity advice. Every week there are new vulnerabilities to patch, emerging scams to avoid, and novel viruses and pieces of malware that can seemingly take over your device, your data, and your business.
Thankfully, there are important steps you can take today that don’t require you to fiddle with internal settings or take a class on network engineering. Some of the most effective protections are simple: Limit how widely you share sensitive information, keep business and personal data separate, and control who can access your devices.
For everything else, try Malwarebytes for Teams to receive 24/7, always-on antimalware protection to shut out viruses, block malware attacks, and keep hackers out of your business.
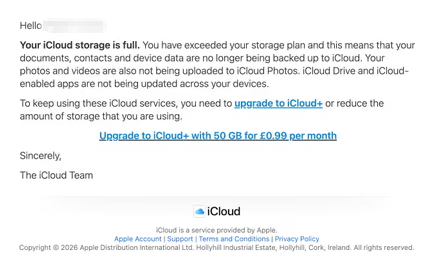
The threat of losing your photos is a powerful lure, so scammers are now using it to steal personal and financial details.
The Guardian warns about an iCloud-themed campaign that start with a few “your iCloud storage is full’ messages, then escalates to threats. If you don’t respond or take action, the emails claim your data will be wiped on a specific date.
US Consumer Affairs has urged users not to click any links and to contact Apple directly if they receive such messages.
The deadline in the emails is never far away, usually just two days. No scammer ever wants you to think things through before you act, so there is always time pressure.
We’ve seen these emails in English and Spanish. Oddly, the monthly rate is set at 99 pence or 99 euro cents respectively.
The 0.99 seems to be the magic number. In reality, scammers don’t care about the payment. What they want is for you fill out the form on their phishing site.
Email saying you must upgrade to iCloud+ or lose your photos
The screenshot above is just one of many examples. There are plenty of variations, but they all follow the same them: make a small payment to stop the files in your iCloud storage from being deleted.
The websites these emails link to also vary, but they all ask for personal and payment details to complete that payment.
How to stay safe
It’s worth remembering that Apple does notify users when their iCloud storage is nearing capacity, but those alerts appear within your device settings or as official system notifications. They don’t come through unsolicited text messages or emails with external links. If you need to check your storage, go directly to Settings on your device and review your iCloud usage.
So, to stay safe:
Always access your account through our official website.
Never share your password with anyone.
Never click on links in unsolicited emails without verifying with a trusted source.
Amazon Web Services is making its S3 object storage service easier for AI agents to access with the introduction of a native file system interface. The new interface, S3 Files, will eliminate a longstanding tradeoff between the low cost of S3 and the interactivity of a traditional file system or of Amazon’s Elastic File System (EFS).
“The file system presents S3 objects as files and directories, supporting all Network File System (NFS) v4.1+ operations like creating, reading, updating, and deleting files,” AWS principal developer advocate Sébastien Stormacq wrote in a blog post.
The file system can be accessed directly from any AWS compute instance, container, or function, spanning use cases from production applications to machine learning training and agentic AI systems, Stormacq said.
Analysts saw the change in accessibility as a strategic move by AWS to position S3 as a primary data layer for AI agents and modern applications, moving beyond its traditional use cases in data lakes and batch analytics.
“AWS is aligning S3 with AI, analytics, and distributed application needs where shared, low-latency file access is required on object-resident data. This addresses growing demand from machine learning training, agentic systems, and multi-node workloads that require concurrent read/write access without moving data out of S3,” said Kaustubh K, practice director at Everest Group.
Without a file system in S3, enterprises developing and deploying agentic systems and other modern applications typically had to either use a separate storage system or copy, synchronize, and stage data stored in S3, introducing latency, inconsistency, and operational overhead, said Pareekh Jain, principal analyst at Pareekh Consulting.
Some developers, said Kaustubh, turned to FUSE-based tools such as s3fs or Mountpoint to simulate file systems on top of S3, but these often lacked proper locking, consistency guarantees, and efficient update mechanisms.
In contrast, S3 Files addresses those limitations through native support for file operations, including permissions, locking, and incremental updates, Jain said.
This reduces friction for developers, he said, as they will no longer need to rewrite applications for object storage: existing file-based tools will just work. “Agents also become easier to build, as they can directly read and write files, store memory, and share data. Overall, it reduces the need for extra glue code like sync jobs, caching layers, and file adapters,” Jain said.
This also implications for CIOs, as it simplifies data architecture by bringing everything, including data lakes, file systems, and staging layers, into Amazon S3.
“This approach lowers costs by removing duplication, reducing pipelines, and cutting operational overhead, while also improving governance with a single source of truth and no scattered copies,” Jain said.
S3 Files is now generally available and can be accessed through the AWS Management Console or the Command Line Interface (CLI), where users can create, mount, and deploy file systems.
In the world of cybersecurity, a single data point is rarely the whole story. Modern attackers don’t just knock on the front door; they probe your APIs, flood your network with "noise" to distract your team, and attempt to slide through applications and servers using stolen credentials.
To stop these multi-vector attacks, you need the full picture. By using Cloudflare Log Explorer to conduct security forensics, you get 360-degree visibility through the integration of 14 new datasets, covering the full surface of Cloudflare’s Application Services and Cloudflare One product portfolios. By correlating telemetry from application-layer HTTP requests, network-layer DDoS and Firewall logs, and Zero Trust Access events, security analysts can significantly reduce Mean Time to Detect (MTTD) and effectively unmask sophisticated, multi-layered attacks.
Read on to learn more about how Log Explorer gives security teams the ultimate landscape for rapid, deep-dive forensics.
The flight recorder for your entire stack
The contemporary digital landscape requires deep, correlated telemetry to defend against adversaries using multiple attack vectors. Raw logs serve as the "flight recorder" for an application, capturing every single interaction, attack attempt, and performance bottleneck. And because Cloudflare sits at the edge, between your users and your servers, all of these events are logged before the requests even reach your infrastructure.
Cloudflare Log Explorer centralizes these logs into a unified interface for rapid investigation.
Log Types Supported
Zone-Scoped Logs
Focus: Website traffic, security events, and edge performance.
HTTP Requests
As the most comprehensive dataset, it serves as the "primary record" of all application-layer traffic, enabling the reconstruction of session activity, exploit attempts, and bot patterns.
Firewall Events
Provides critical evidence of blocked or challenged threats, allowing analysts to identify the specific WAF rules, IP reputations, or custom filters that intercepted an attack.
DNS Logs
Identify cache poisoning attempts, domain hijacking, and infrastructure-level reconnaissance by tracking every query resolved at the authoritative edge.
NEL (Network Error Logging) Reports
Distinguish between a coordinated Layer 7 DDoS attack and legitimate network connectivity issues by tracking client-side browser errors.
Spectrum Events
For non-web applications, these logs provide visibility into L4 traffic (TCP/UDP), helping to identify anomalies or brute-force attacks against protocols like SSH, RDP, or custom gaming traffic.
Page Shield
Track and audit unauthorized changes to your site's client-side environment such as JavaScript, outbound connections.
Zaraz Events
Examine how third-party tools and trackers are interacting with user data, which is vital for auditing privacy compliance and detecting unauthorized script behaviors.
Account-Scoped Logs
Focus: Internal security, Zero Trust, administrative changes, and network activity.
Access Requests
Tracks identity-based authentication events to determine which users accessed specific internal applications and whether those attempts were authorized.
Audit Logs
Provides a trail of configuration changes within the Cloudflare dashboard to identify unauthorized administrative actions or modifications.
CASB Findings
Identifies security misconfigurations and data risks within SaaS applications (like Google Drive or Microsoft 365) to prevent unauthorized data exposure.
Magic Transit / IPSec Logs
Helps network engineers perform network-level (L3) monitoring such as reviewing tunnel health and view BGP routing changes.
Browser Isolation Logs
Tracks user actions inside an isolated browser session (e.g., copy-paste, print, or file uploads) to prevent data leaks on untrusted sites
Device Posture Results
Details the security health and compliance status of devices connecting to your network, helping to identify compromised or non-compliant endpoints.
DEX Application Tests
Monitors application performance from the user's perspective, which can help distinguish between a security-related outage and a standard performance degradation.
DEX Device State Events
Provides telemetry on the physical state of user devices, useful for correlating hardware or OS-level anomalies with potential security incidents.
DNS Firewall Logs
Tracks DNS queries filtered through the DNS Firewall to identify communication with known malicious domains or command-and-control (C2) servers.
Email Security Alerts
Logs malicious email activity and phishing attempts detected at the gateway to trace the origin of email-based entry vectors.
Gateway DNS
Monitors every DNS query made by users on your network to identify shadow IT, malware callbacks, or domain-generation algorithms (DGAs).
Gateway HTTP
Provides full visibility into encrypted and unencrypted web traffic to detect hidden payloads, malicious file downloads, or unauthorized SaaS usage.
Gateway Network
Tracks L3/L4 network traffic (non-HTTP) to identify unauthorized port usage, protocol anomalies, or lateral movement within the network.
IPSec Logs
Monitors the status and traffic of encrypted site-to-site tunnels to ensure the integrity and availability of secure network connections.
Magic IDS Detections
Surfaces matches against intrusion detection signatures to alert investigators to known exploit patterns or malware behavior traversing the network.
Network Analytics Logs
Provides high-level visibility into packet-level data to identify volumetric DDoS attacks or unusual traffic spikes targeting specific infrastructure.
Sinkhole HTTP Logs
Captures traffic directed to "sinkholed" IP addresses to confirm which internal devices are attempting to communicate with known botnet infrastructure.
WARP Config Changes
Tracks modifications to the WARP client settings on end-user devices to ensure that security agents haven't been tampered with or disabled.
WARP Toggle Changes
Specifically logs when users enable or disable their secure connectivity, helping to identify periods where a device may have been unprotected.
Zero Trust Network Session Logs
Logs the duration and status of authenticated user sessions to map out the complete lifecycle of a user's access within the protected perimeter.
Log Explorer can identify malicious activity at every stage
Get granular application layer visibility with HTTP Requests, Firewall Events, and DNS logs to see exactly how traffic is hitting your public-facing properties.Track internal movement with Access Requests, Gateway logs, and Audit logs. If a credential is compromised, you’ll see where they went. Use Magic IDS and Network Analytics logs to spot volumetric attacks and "East-West" lateral movement within your private network.
Identify the reconnaissance
Attackers use scanners and other tools to look for entry points, hidden directories, or software vulnerabilities. To identify this, using Log Explorer, you can query http_requests for any EdgeResponseStatus codes of 401, 403, or 404 coming from a single IP, or requests to sensitive paths (e.g. /.env, /.git, /wp-admin).
Additionally, magic_ids_detections logs can also be used to identify scanning at the network layer. These logs provide packet-level visibility into threats targeting your network. Unlike standard HTTP logs, these logs focus on signature-based detections at the network and transport layers (IP, TCP, UDP). Query to discover cases where a single SourceIP is triggering multiple unique detections across a wide range of DestinationPort values in a short timeframe. Magic IDS signatures can specifically flag activities like Nmap scans or SYN stealth scans.
Check for diversions
While the attacker is conducting reconnaissance, they may attempt to disguise this with a simultaneous network flood. Pivot to network_analytics_logs to see if a volumetric attack is being used as a smokescreen.
Identify the approach
Once attackers identify a potential vulnerability, they begin to craft their weapon. The attacker sends malicious payloads (e.g. SQL injection or large/corrupt file uploads) to confirm the vulnerability. Review http_requests and/or fw_events to identify any Cloudflare detection tools that have triggered. Cloudflare logs security signals in these datasets to easily identify requests with malicious payloads using fields such as WAFAttackScore, WAFSQLiAttackScore, FraudAttack, ContentScanJobResults, and several more. Review our documentation to get a full understanding of these fields. The fw_events logs can be used to determine whether these requests made it past Cloudflare’s defenses by examining the action, source, and ruleID fields. Cloudflare’s managed rules by default blocks many of these payloads by default. Review Application Security Overview to know if your application is protected.
Showing the Managed rules Insight that displays on Security Overview if the current zone does not have Managed Rules enabled
Audit the identity
Did that suspicious IP manage to log in? Use the ClientIP to search access_requests. If you see a "Decision: Allow" for a sensitive internal app, you know you have a compromised account.
Stop the leak (data exfiltration)
Attackers sometimes use DNS tunneling to bypass firewalls by encoding sensitive data (like passwords or SSH keys) into DNS queries. Instead of a normal request like google.com, the logs will show long, encoded strings. Look for an unusually high volume of queries for unique, long, and high-entropy subdomains by examining the fields: QueryName: Look for strings like h3ldo293js92.example.com, QueryType: Often uses TXT, CNAME, or NULL records to carry the payload, and ClientIP: Identify if a single internal host is generating thousands of these unique requests.
Additionally, attackers may attempt to leak sensitive data by hiding it within non-standard protocols or by using common protocols (like DNS or ICMP) in unusual ways to bypass standard firewalls. Discover this by querying the magic_ids_detections logs to look for signatures that flag protocol anomalies, such as "ICMP tunneling" or "DNS tunneling" detections in the SignatureMessage.
Whether you are investigating a zero-day vulnerability or tracking a sophisticated botnet, the data you need is now at your fingertips.
Correlate across datasets
Investigate malicious activity across multiple datasets by pivoting between multiple concurrent searches. With Log Explorer, you can now work with multiple queries simultaneously with the new Tabs feature. Switch between tabs to query different datasets or Pivot and adjust queries using filtering via your query results.
When you correlate data across multiple Cloudflare log sources, you can detect sophisticated multi-stage attacks that appear benign when viewed in isolation. This cross-dataset analysis allows you to see the full attack chain from reconnaissance to exfiltration.
Session hijacking (token theft)
Scenario: A user authenticates via Cloudflare Access, but their subsequent HTTP_request traffic looks like a bot.
Step 1: Identify high-risk sessions in http_requests.
SELECT RayID, ClientIP, ClientRequestUserAgent, BotScore
FROM http_requests
WHERE date = '2026-02-22'
  AND BotScore < 20
LIMIT 100
Step 2: Copy the RayID and search access_requests to see which user account is associated with that suspicious bot activity.
SELECT Email, IPAddress, Allowed
FROM access_requests
WHERE date = '2026-02-22'
  AND RayID = 'INSERT_RAY_ID_HERE'
Post-phishing C2 beaconing
Scenario: An employee clicked a link in a phishing email which resulted in compromising their workstation. This workstation sends a DNS query for a known malicious domain, then immediately triggers an IDS alert.
Step 1: Find phishing attacks by examining email_security_alerts for violations.
SELECT Timestamp, Threatcategories, To, Alertreason
FROM email_security_alerts
WHERE date = '2026-02-22'
  AND Threatcategories LIKE 'phishing'
Step 2: Use Access logs to correlate the user’s email (To) to their IP Address.
SELECT Email, IPAddress
FROM access_requests
WHERE date = '2026-02-22'
Step 3: Find internal IPs querying a specific malicious domain in gateway_dns logs.
SELECT SrcIP, QueryName, DstIP,
FROM gateway_dns
WHERE date = '2026-02-22'
  AND SrcIP = 'INSERT_IP_FROM_PREVIOUS_QUERY'
  AND QueryName LIKE '%malicious_domain_name%'
Lateral movement (Access → network probing)
Scenario: A user logs in via Zero Trust and then tries to scan the internal network.
Step 1: Find successful logins from unexpected locations in access_requests.
SELECT IPAddress, Email, Country
FROM access_requests
WHERE date = '2026-02-22'
  AND Allowed = true
  AND Country != 'US' -- Replace with your HQ country
Step 2: Check if that IPAddress is triggering network-level signatures in magic_ids_detections.
SELECT SignatureMessage, DestinationIP, Protocol
FROM magic_ids_detections
WHERE date = '2026-02-22'
  AND SourceIP = 'INSERT_IP_ADDRESS_HERE'
Opening doors for more data
From the beginning, Log Explorer was designed with extensibility in mind. Every dataset schema is defined using JSON Schema, a widely-adopted standard for describing the structure and types of JSON data. This design decision has enabled us to easily expand beyond HTTP Requests and Firewall Events to the full breadth of Cloudflare's telemetry. The same schema-driven approach that powered our initial datasets scaled naturally to accommodate Zero Trust logs, network analytics, email security alerts, and everything in between.
More importantly, this standardization opens the door to ingesting data beyond Cloudflare's native telemetry. Because our ingestion pipeline is schema-driven rather than hard-coded, we're positioned to accept any structured data that can be expressed in JSON format. For security teams managing hybrid environments, this means Log Explorer could eventually serve as a single pane of glass, correlating Cloudflare's edge telemetry with logs from third-party sources, all queryable through the same SQL interface. While today's release focuses on completing coverage of Cloudflare's product portfolio, the architectural groundwork is laid for a future where customers can bring their own data sources with custom schemas.
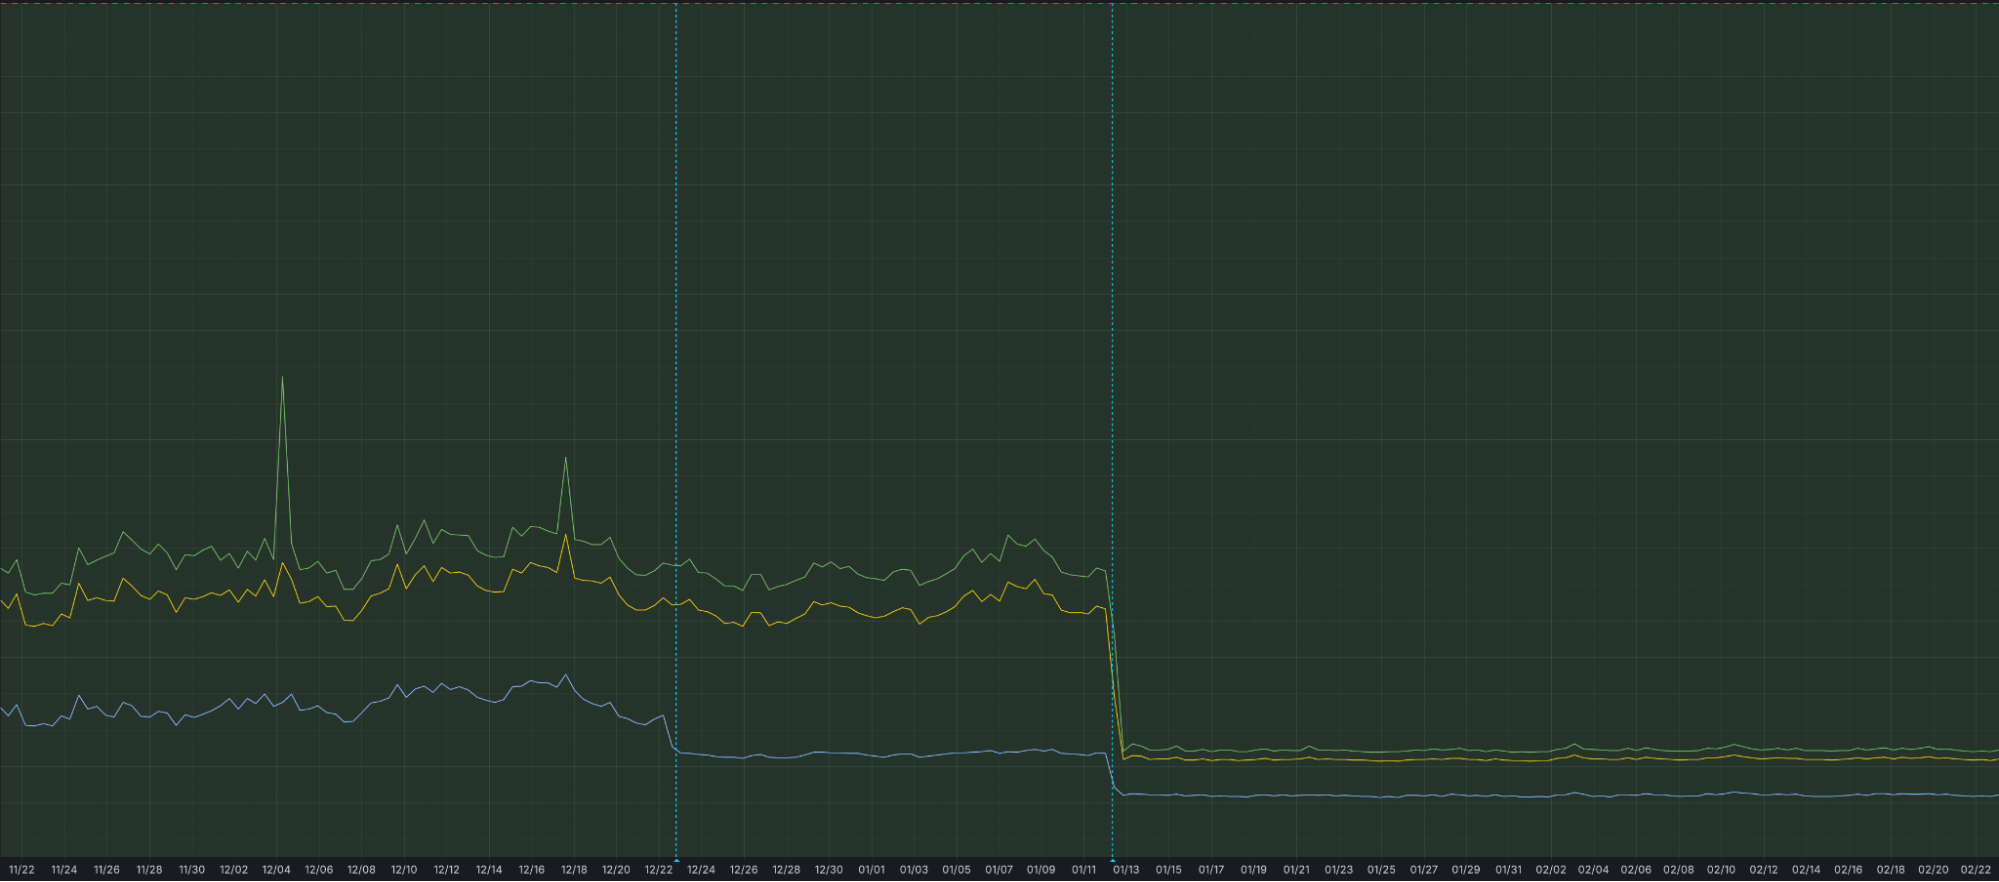
To investigate a multi-vector attack effectively, timing is everything. A delay of even a few minutes in the log availability can be the difference between proactive defense and reactive damage control.
That is why we have optimized our ingestion for better speed and resilience. By increasing concurrency in one part of our ingestion path, we have eliminated bottlenecks that could cause “noisy neighbor” issues, ensuring that one client’s data surge doesn’t slow down another’s visibility. This architectural work has reduced our P99 ingestion latency by approximately 55%, and our P50 by 25%, cutting the time it takes for an event at the edge to become available for your SQL queries.
Grafana chart displaying the drop in ingest latency after architectural upgrades
Follow along for more updates
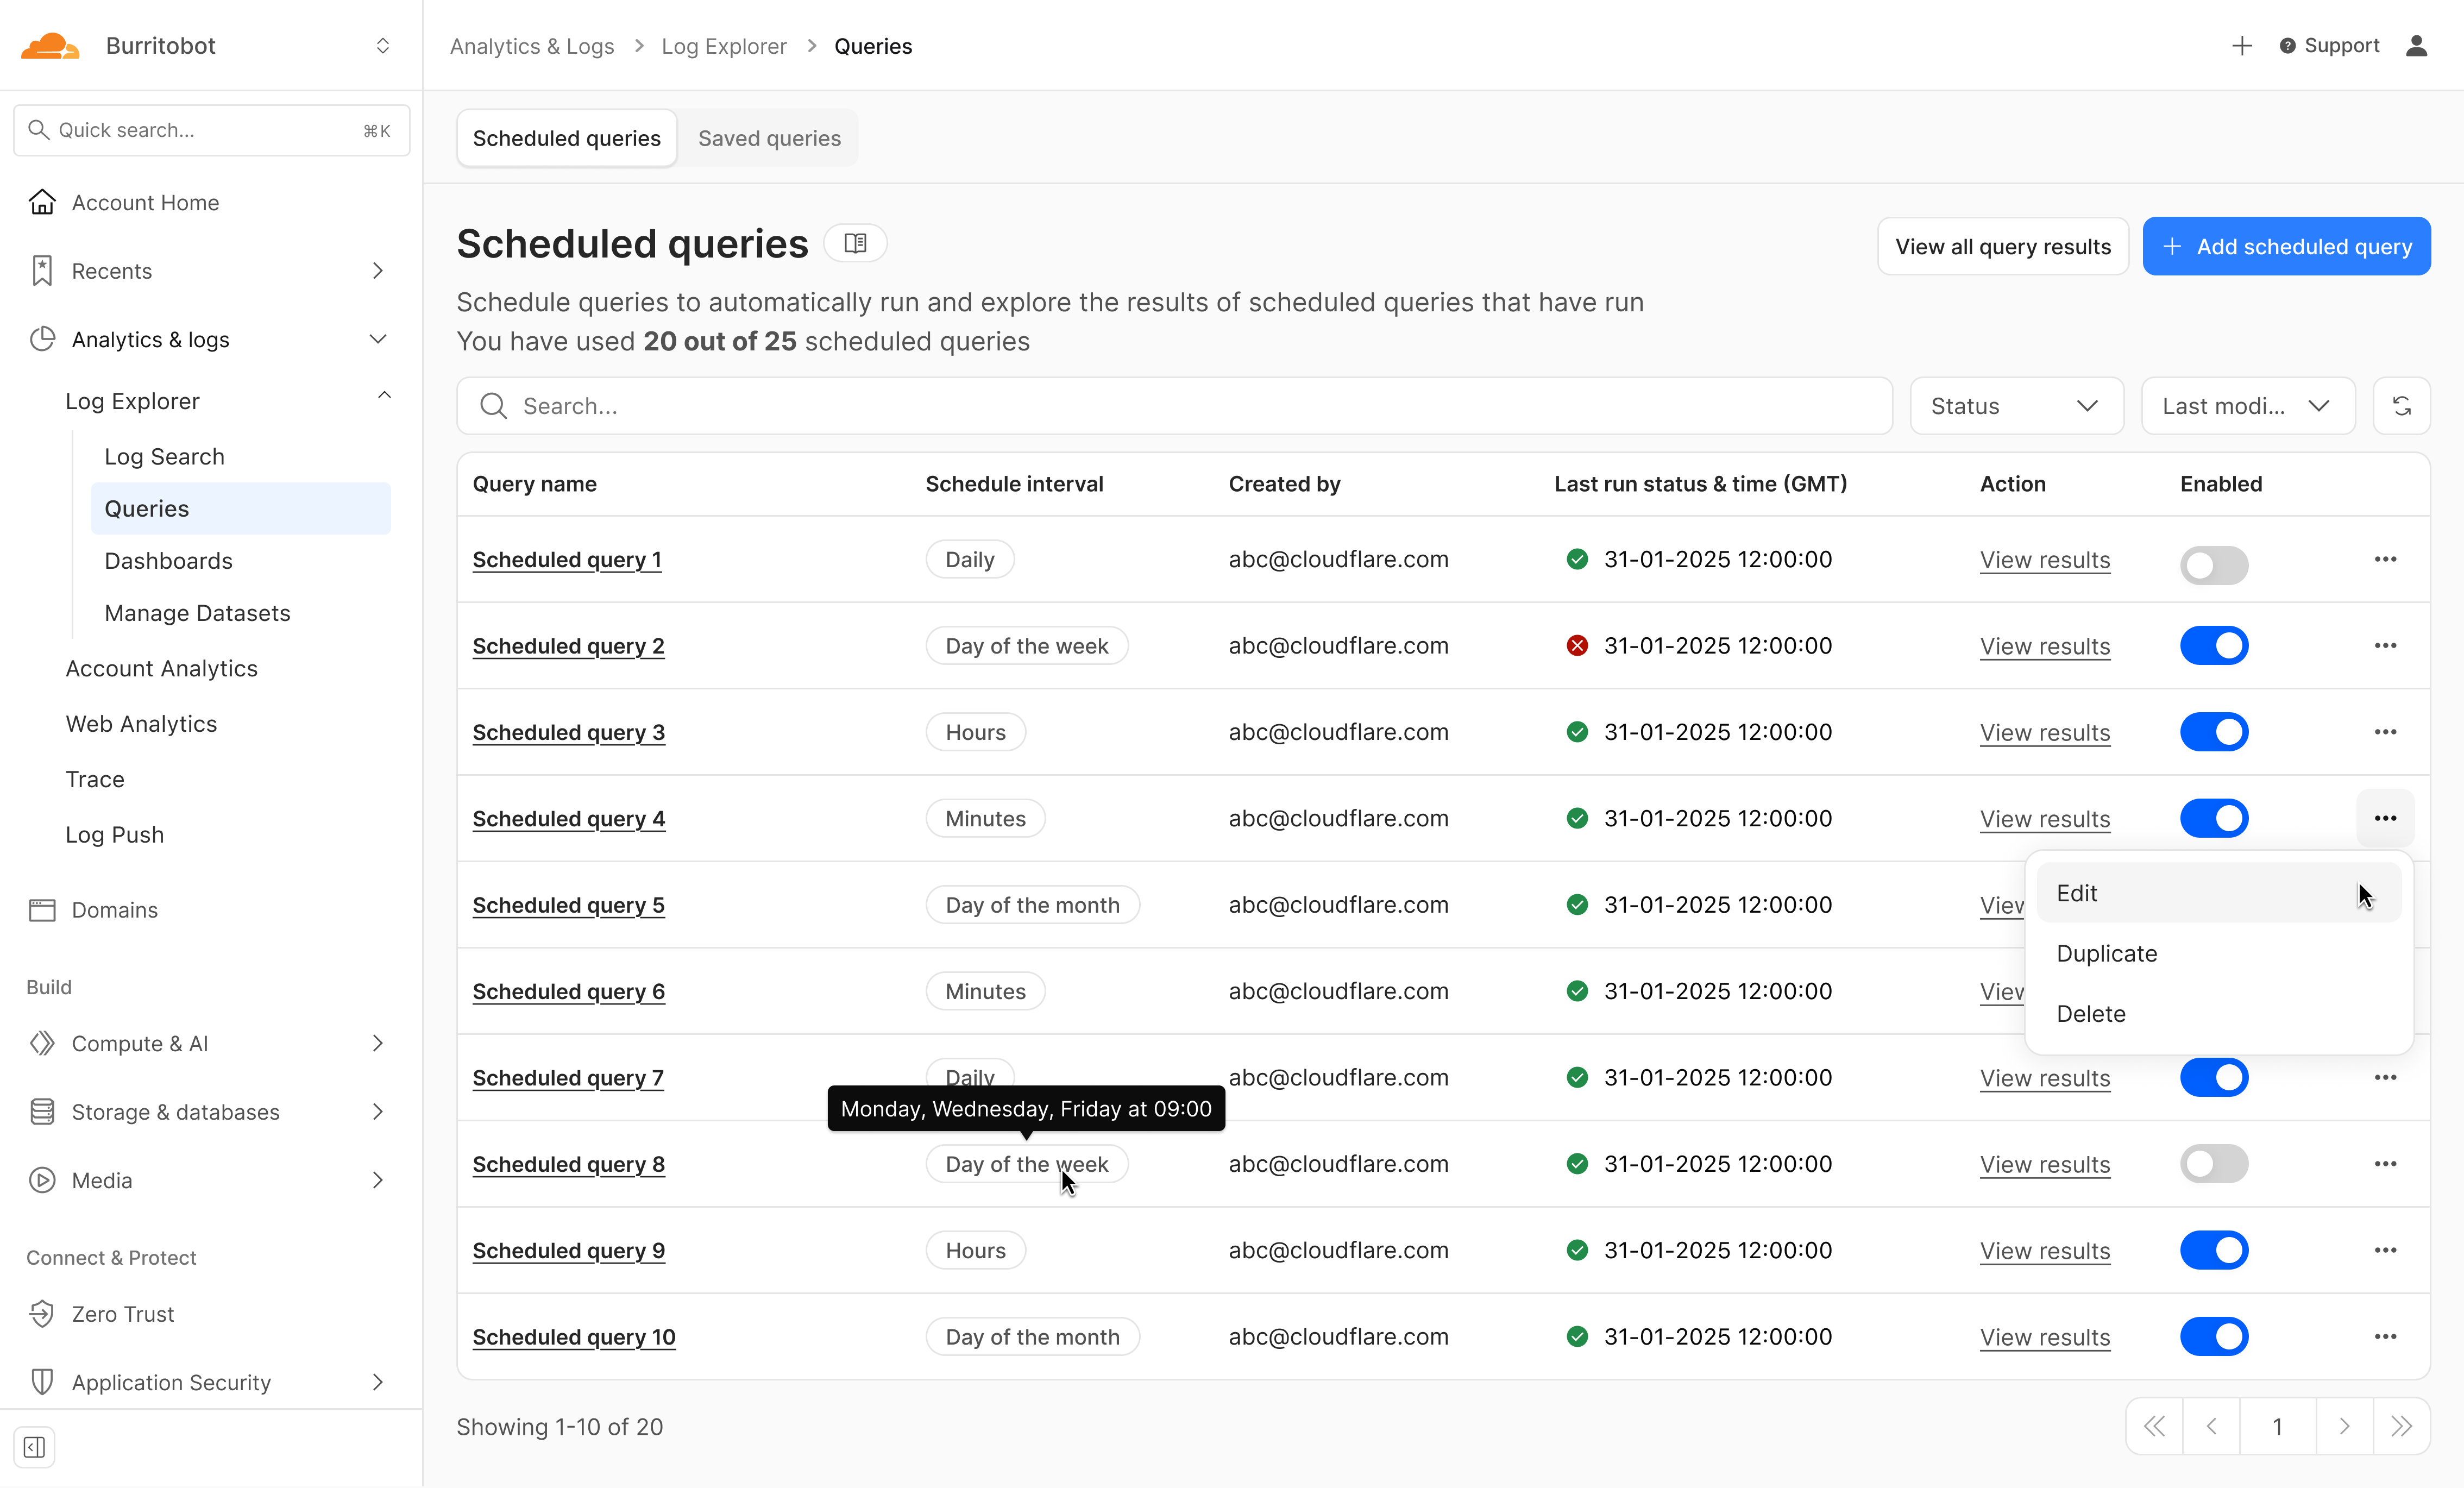
We're just getting started. We're actively working on even more powerful features to further enhance your experience with Log Explorer, including the ability to run these detection queries on a custom defined schedule.
Design mockup of upcoming Log Explorer Scheduled Queries feature
To get access to Log Explorer, you can purchase self-serve directly from the dash or for contract customers, reach out for a consultation or contact your account manager. Additionally, you can read more in our Developer Documentation.
Imagine our surprise when we ended up on a site promoting that same Freecash app while investigating a “cloud storage” phish. We’ve all probably seen one of those. They’re common enough and according to recent investigation by BleepingComputer, there’s a
“large-scale cloud storage subscription scam campaign targeting users worldwide with repeated emails falsely warning recipients that their photos, files, and accounts are about to be blocked or deleted due to an alleged payment failure.”
Based on the description in that article, the email we found appears to be part of this campaign.
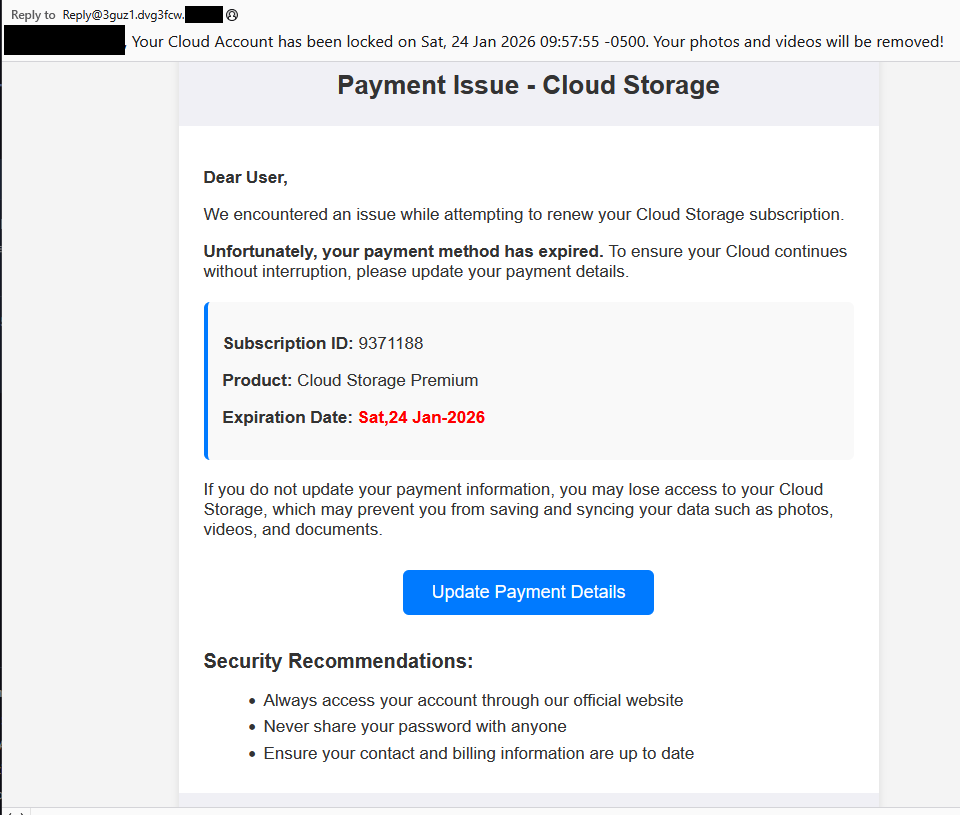
The subject line of the email is:
“{Recipient}. Your Cloud Account has been locked on Sat, 24 Jan 2026 09:57:55 -0500. Your photos and videos will be removed!”
This matches one of the subject lines that BleepingComputer listed.
And the content of the email:
“Payment Issue – Cloud Storage
Dear User,
We encountered an issue while attempting to renew your Cloud Storage subscription.
Unfortunately, your payment method has expired. To ensure your Cloud continues without interruption, please update your payment details.
Subscription ID: 9371188
Product: Cloud Storage Premium
Expiration Date: Sat,24 Jan-2026
If you do not update your payment information, you may lose access to your Cloud Storage, which may prevent you from saving and syncing your data such as photos, videos, and documents.
Update Payment Details {link button}
Security Recommendations:
Always access your account through our official website
Never share your password with anyone
Ensure your contact and billing information are up to date”
The link in the email leads to https://storage.googleapis[.]com/qzsdqdqsd/dsfsdxc.html#/redirect.html, which helps the scammer establish a certain amount of trust because it points to Google Cloud Storage (GCS). GCS is a legitimate service that allows authorized users to store and manage data such as files, images, and videos in buckets. However, as in this case, attackers can abuse it for phishing.
The redirect carries some parameters to the next website.
The feed.headquartoonjpn[.]com domain was blocked by Malwarebytes. We’ve seen it before in an earlier campaign involving an Endurance-themed phish.
After a few more redirects, we ended up at hx5.submitloading[.]com, where a fake CAPTCHA triggered the last redirect to freecash[.]com, once it was solved.
The end goal of this phish likely depends on the parameters passed along during the redirects, so results may vary.
Rather than stealing credentials directly, the campaign appears designed to monetize traffic, funneling victims into affiliate offers where the operators get paid for sign-ups or conversions.
BleepingComputer noted that they were redirected to affiliate marketing websites for various products.
“Products promoted in this phishing campaign include VPN services, little-known security software, and other subscription-based offerings with no connection to cloud storage.”
How to stay safe
Ironically, the phishing email itself includes some solid advice:
Always access your account through our official website.
Never share your password with anyone.
We’d like to add:
Never click on links in unsolicited emails without verifying with a trusted source.
Do not engage with websites that attract visitors like this.
Pro tip: Malwarebytes Scam Guard would have helped you identify this email as a scam and provided advice on how to proceed.
Redirect flow (IOCs)
storage.googleapis[.]com/qzsdqdqsd/dsfsdxc.html
feed.headquartoonjpn[.]com
revivejudgemental[.]com
hx5.submitloading[.]com
freecash[.]com
Update February 5, 2026
Almedia GmbH, the company behind the Freecash platform, reached out to us for information about the chain of redirects that lead to their platform. And after an investigation they notified us that:
“Following Malwarebytes’ reporting and the additional information they shared with us, we investigated the issue and identified an affiliate operating in breach of our policies. That partner has been removed from our network.
Almedia does not sell user data, and we take compliance, user trust, and responsible advertising seriously.”
We don’t just report on scams—we help detect them
Cybersecurity risks should never spread beyond a headline. If something looks dodgy to you, check if it’s a scam using Malwarebytes Scam Guard, a feature of our mobile protection products. Submit a screenshot, paste suspicious content, or share a text or phone number, and we’ll tell you if it’s a scam or legit. Download Malwarebytes Mobile Security for iOS or Android and try it today!
We are thrilled to announce the General Availability of Cloudflare Log Explorer, a powerful new product designed to bring observability and forensics capabilities directly into your Cloudflare dashboard. Built on the foundation of Cloudflare's vast global network, Log Explorer leverages the unique position of our platform to provide a comprehensive and contextualized view of your environment.
Security teams and developers use Cloudflare to detect and mitigate threats in real-time and to optimize application performance. Over the years, users have asked for additional telemetry with full context to investigate security incidents or troubleshoot application performance issues without having to forward data to third party log analytics and Security Information and Event Management (SIEM) tools. Besides avoidable costs, forwarding data externally comes with other drawbacks such as: complex setups, delayed access to crucial data, and a frustrating lack of context that complicates quick mitigation.
Log Explorer has been previewed by several hundred customers over the last year, and they attest to its benefits:
“Having WAF logs (firewall events) instantly available in Log Explorer with full context — no waiting, no external tools — has completely changed how we manage our firewall rules. I can spot an issue, adjust the rule with a single click, and immediately see the effect. It’s made tuning for false positives faster, cheaper, and far more effective.”
“While we use Logpush to ingest Cloudflare logs into our SIEM, when our development team needs to analyze logs, it can be more effective to utilize Log Explorer. SIEMs make it difficult for development teams to write their own queries and manipulate the console to see the logs they need. Cloudflare's Log Explorer, on the other hand, makes it much easier for dev teams to look at logs and directly search for the information they need.”
With Log Explorer, customers have access to Cloudflare logs with all the context available within the Cloudflare platform. Compared to external tools, customers benefit from:
Reduced cost and complexity: Drastically reduce the expense and operational overhead associated with forwarding, storing, and analyzing terabytes of log data in external tools.
Faster detection and triage: Access Cloudflare-native logs directly, eliminating cumbersome data pipelines and the ingest lags that delay critical security insights.
Accelerated investigations with full context: Investigate incidents with Cloudflare's unparalleled contextual data, accelerating your analysis and understanding of "What exactly happened?" and "How did it happen?"
Minimal recovery time: Seamlessly transition from investigation to action with direct mitigation capabilities via the Cloudflare platform.
Log Explorer is available as an add-on product for customers on our self serve or Enterprise plans. Read on to learn how each of the capabilities of Log Explorer can help you detect and diagnose issues more quickly.
Monitor security and performance issues with custom dashboards
Custom dashboards allow you to define the specific metrics you need in order to monitor unusual or unexpected activity in your environment.
Getting started is easy, with the ability to create a chart using natural language. A natural language interface is integrated into the chart create/edit experience, enabling you to describe in your own words the chart you want to create. Similar to the AI Assistant we announced during Security Week 2024, the prompt translates your language to the appropriate chart configuration, which can then be added to a new or existing custom dashboard.
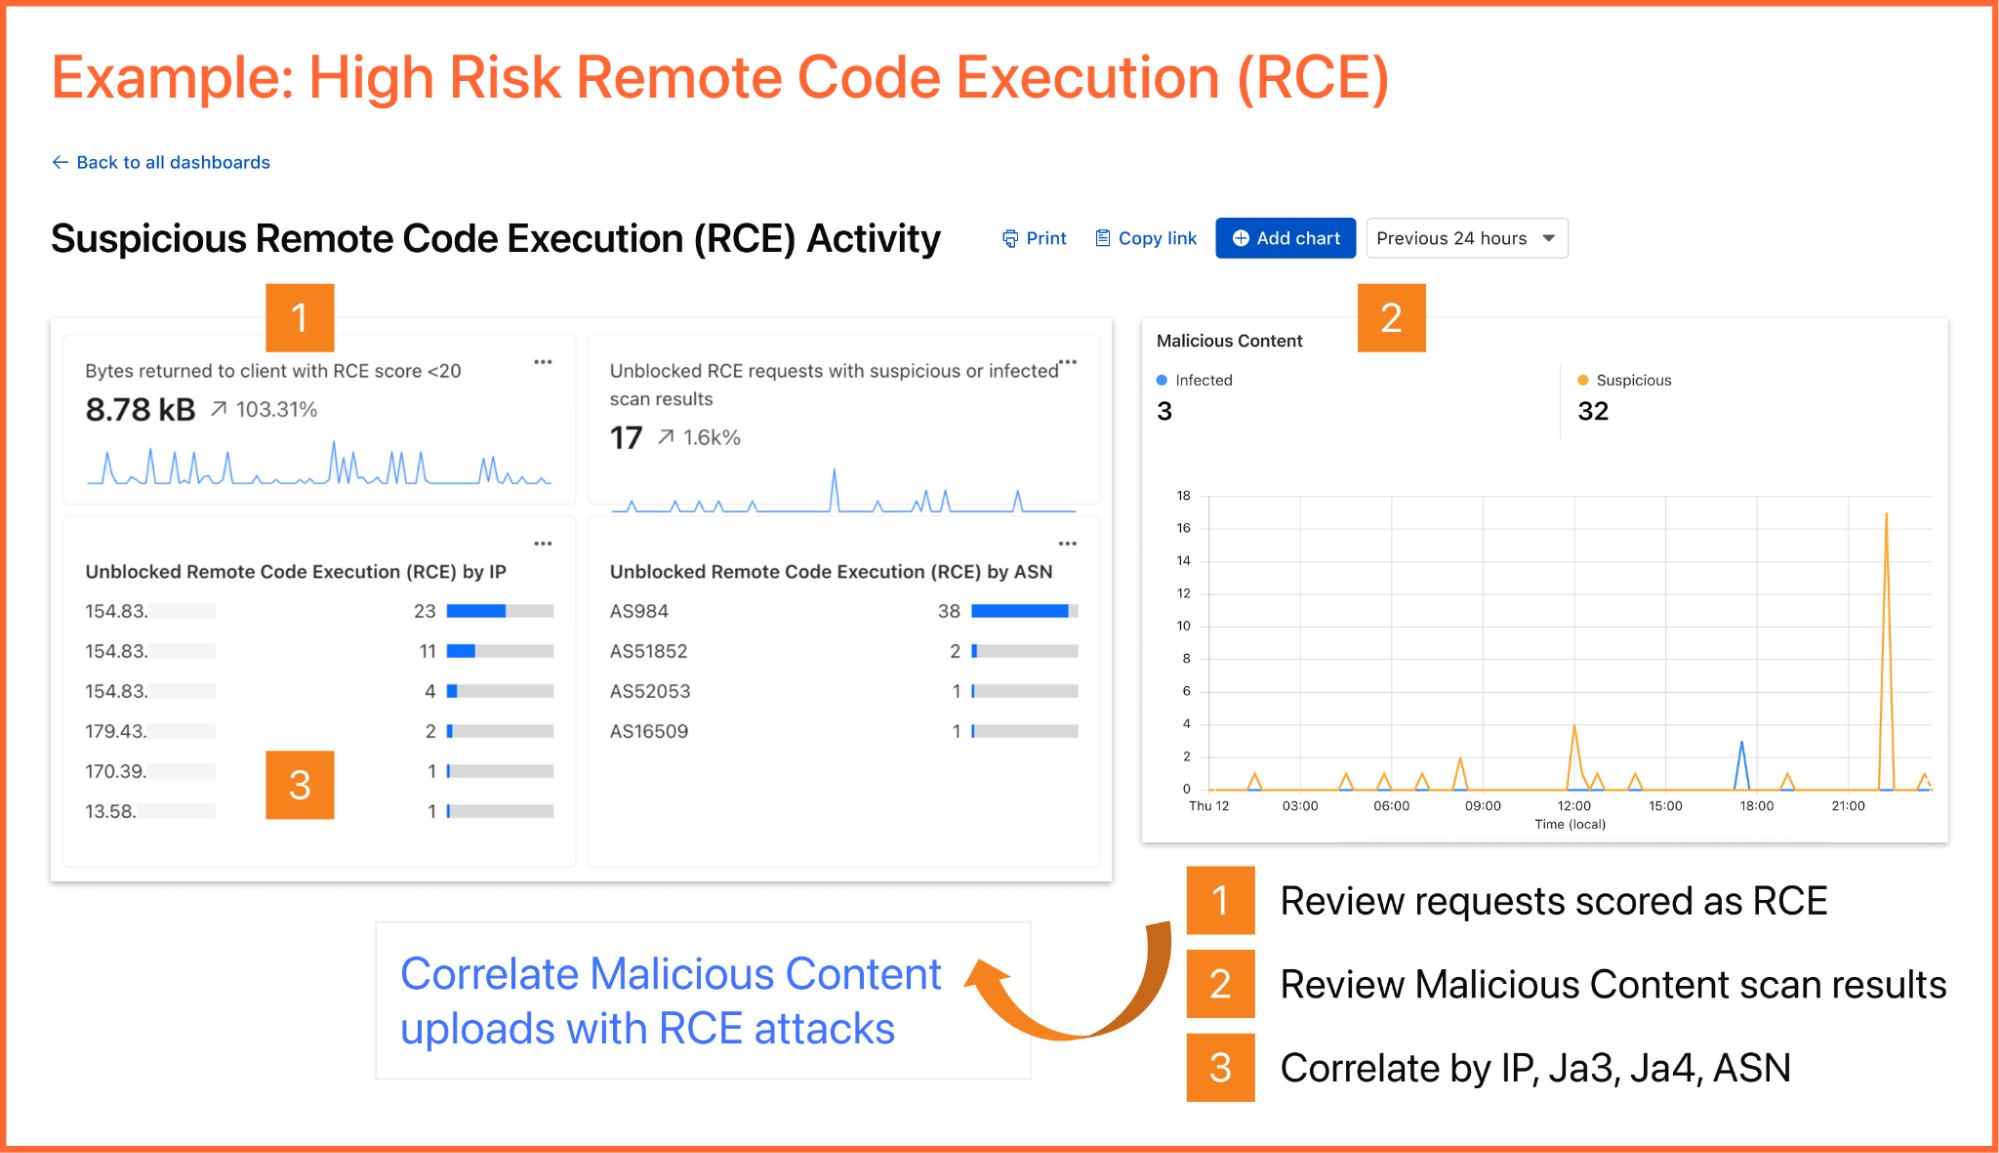
As an example, you can create a dashboard for monitoring for the presence of Remote Code Execution (RCE) attacks happening in your environment. An RCE attack is where an attacker is able to compromise a machine in your environment and execute commands. The good news is that RCE is a detection available in Cloudflare WAF. In the dashboard example below, you can not only watch for RCE attacks, but also correlate them with other security events such as malicious content uploads, source IP addresses, and JA3/JA4 fingerprints. Such a scenario could mean one or more machines in your environment are compromised and being used to spread malware — surely, a very high risk incident!
A reliability engineer might want to create a dashboard for monitoring errors. They could use the natural language prompt to enter a query like “Compare HTTP status code ranges over time.” The AI model then decides the most appropriate visualization and constructs their chart configuration.
While you can create custom dashboards from scratch, you could also use an expert-curated dashboard template to jumpstart your security and performance monitoring.
Available templates include:
Bot monitoring: Identify automated traffic accessing your website
API Security: Monitor the data transfer and exceptions of API endpoints within your application
API Performance: See timing data for API endpoints in your application, along with error rates
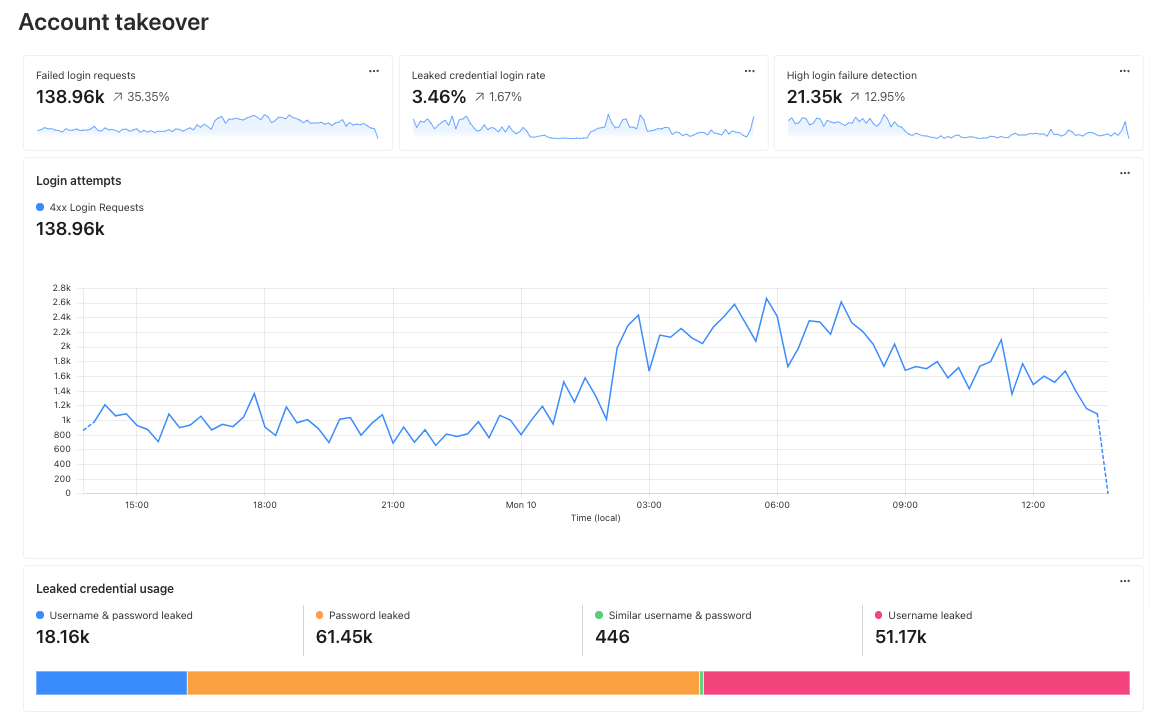
Account Takeover: View login attempts, usage of leaked credentials, and identify account takeover attacks
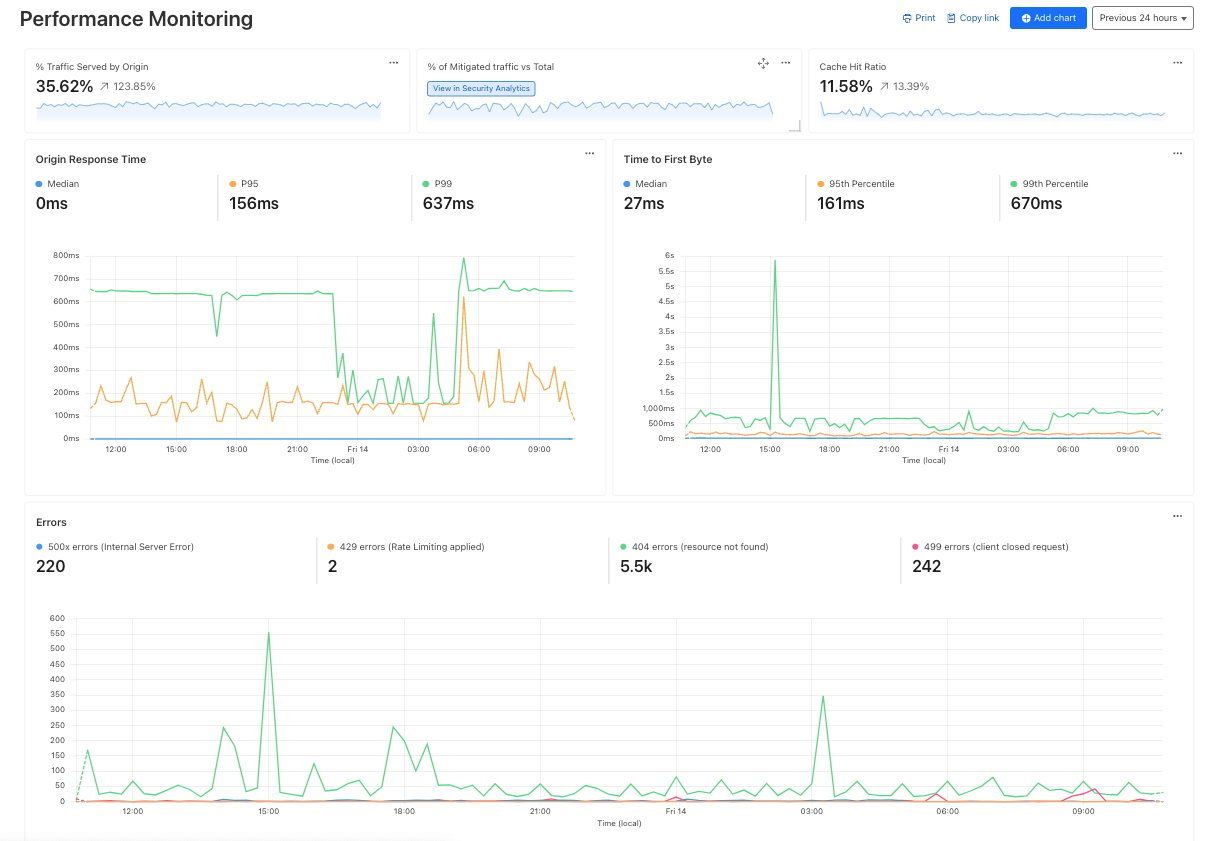
Performance Monitoring: Identify slow hosts and paths on your origin server, and view time to first byte (TTFB) metrics over time
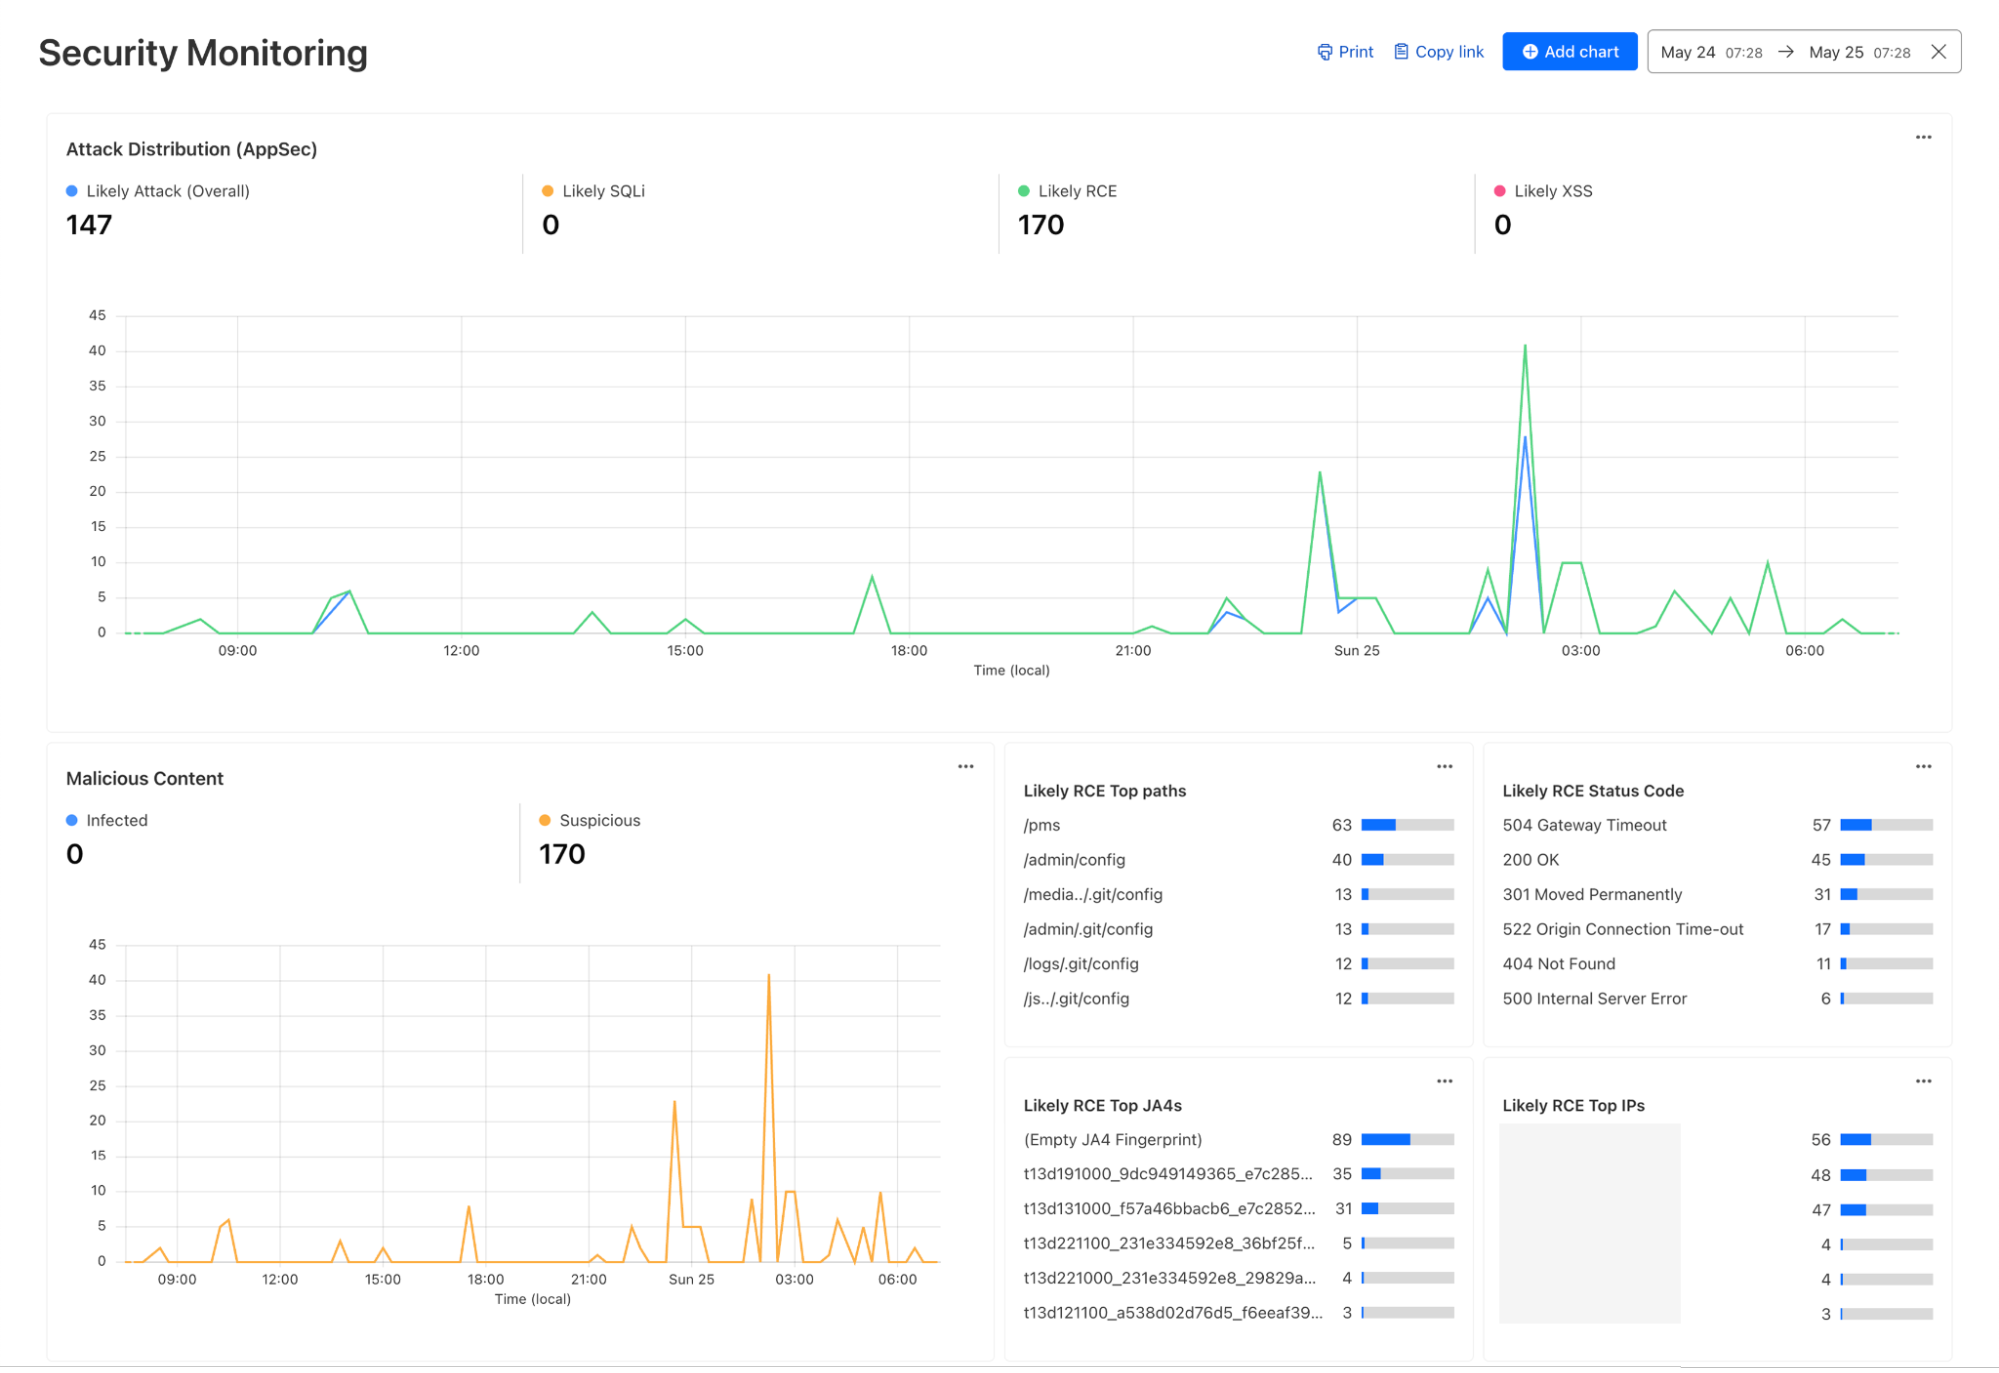
Security Monitoring: monitor attack distribution across top hosts and paths, correlate DDoS traffic with origin Response time to understand the impact of DDoS attacks.
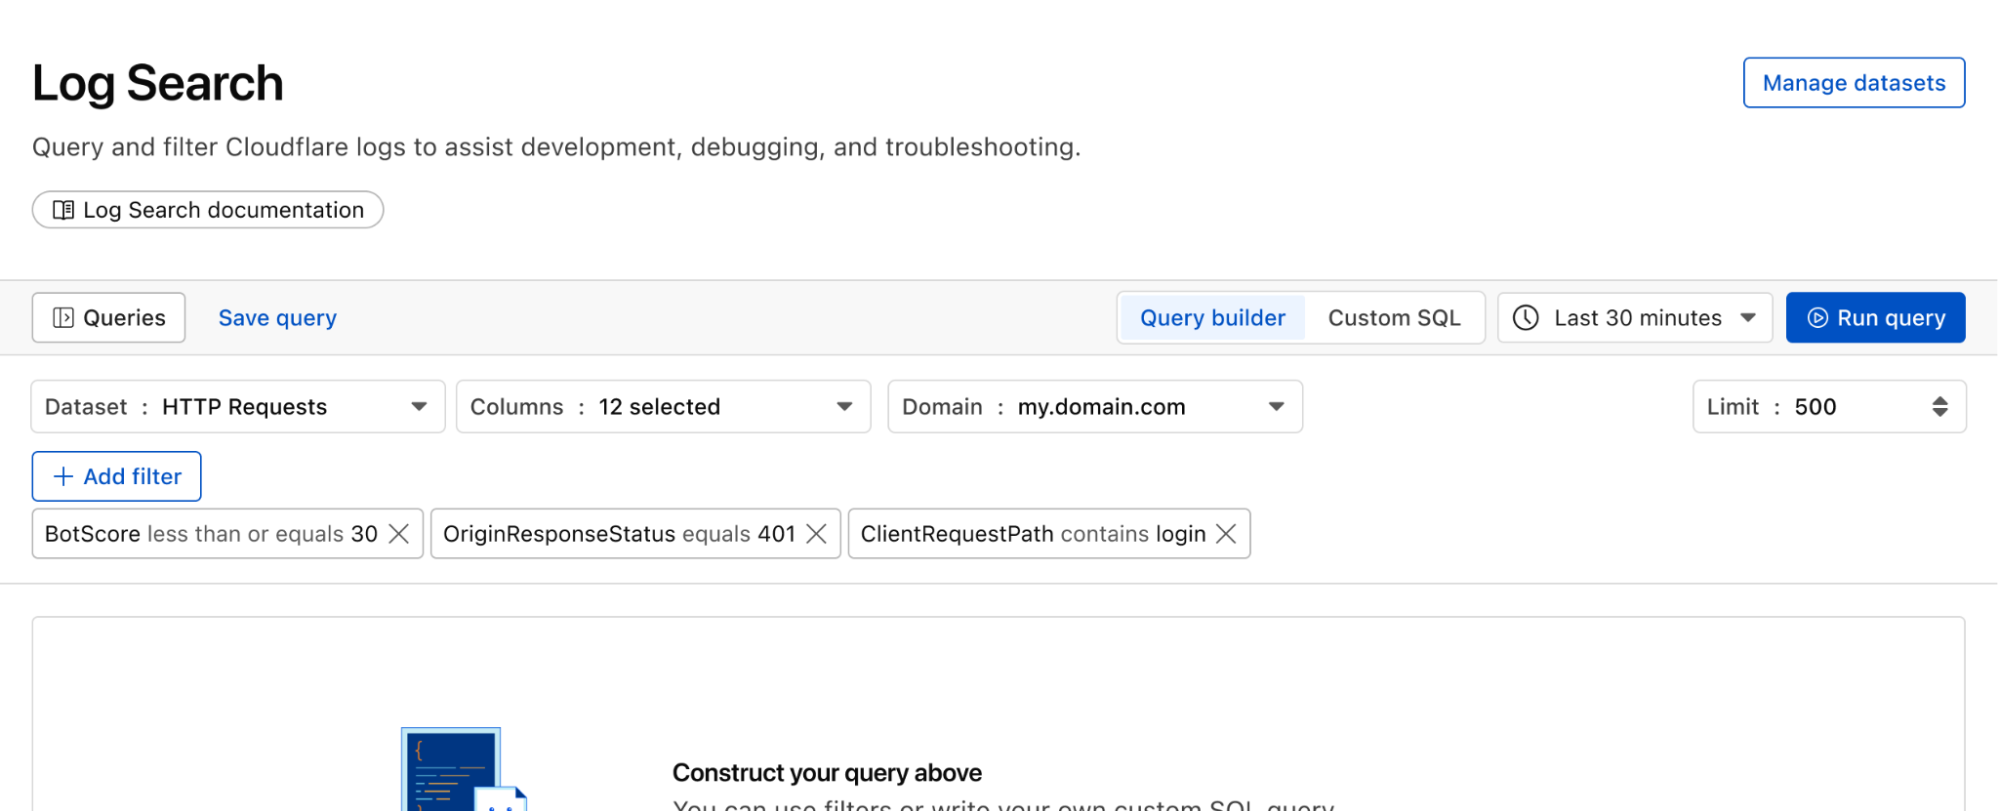
Investigate and troubleshoot issues with Log Search
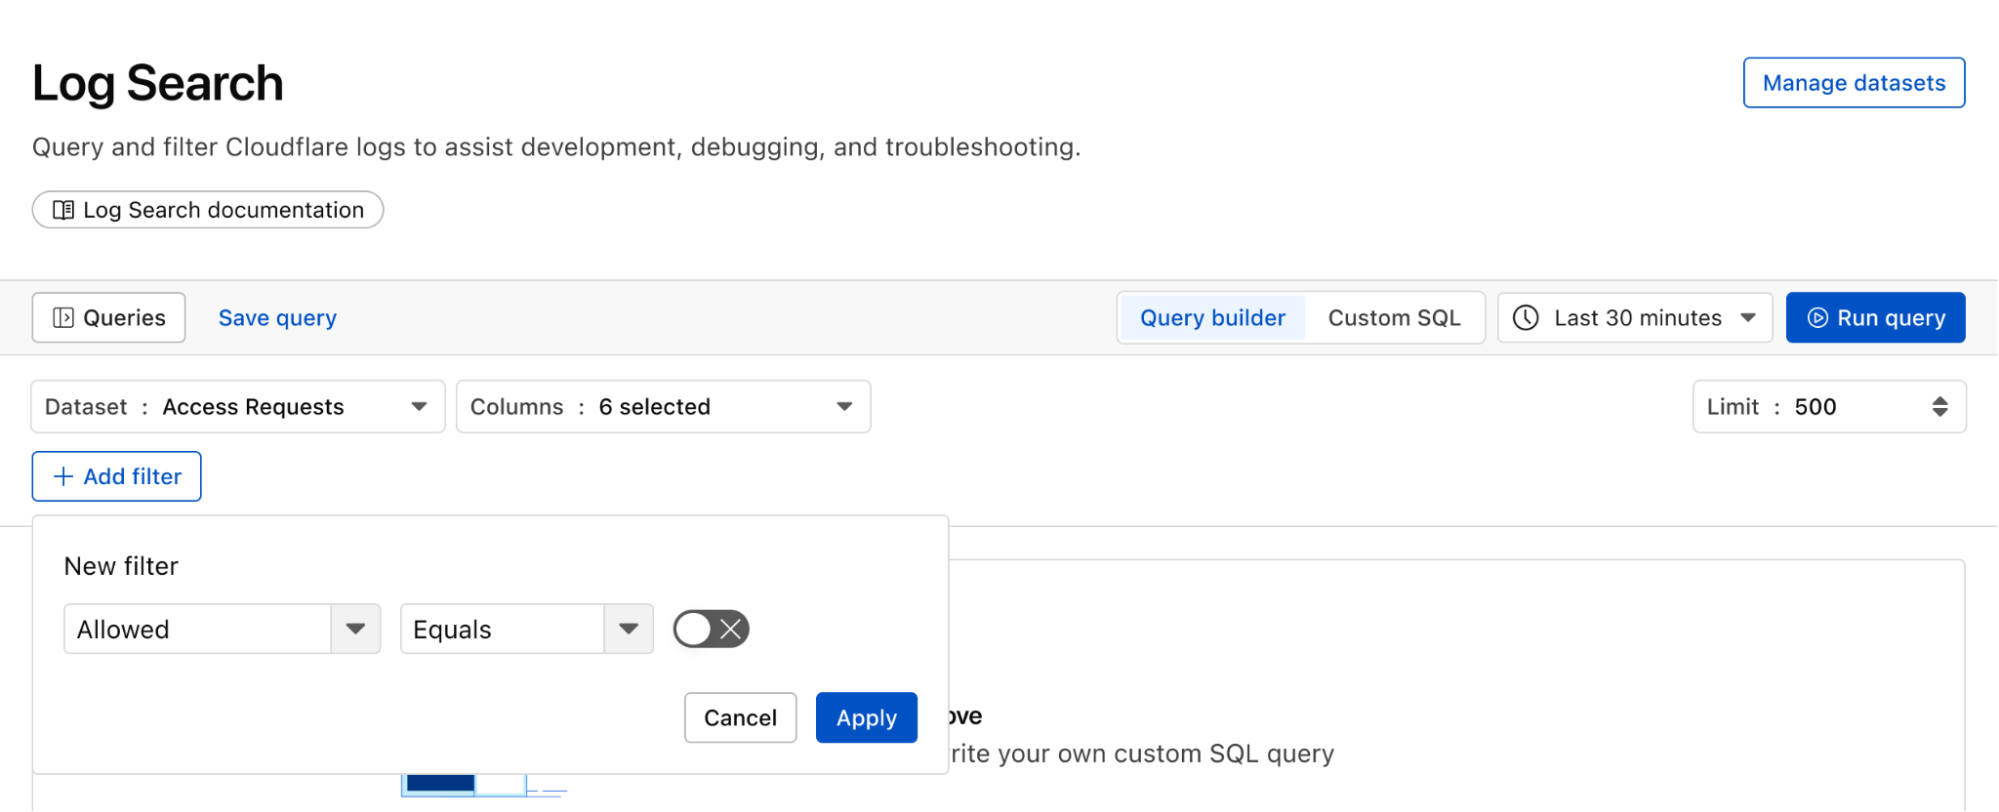
Continuing with the example from the prior section, after successfully diagnosing that some machines were compromised through the RCE issue, analysts can pivot over to Log Search in order to investigate whether the attacker was able to access and compromise other internal systems. To do that, the analyst could search logs from Zero Trust services, using context, such as compromised IP addresses from the custom dashboard, shown in the screenshot below:
Log Search is a streamlined experience including data type-aware search filters, or the ability to switch to a custom SQL interface for more powerful queries. Log searches are also available via a public API.
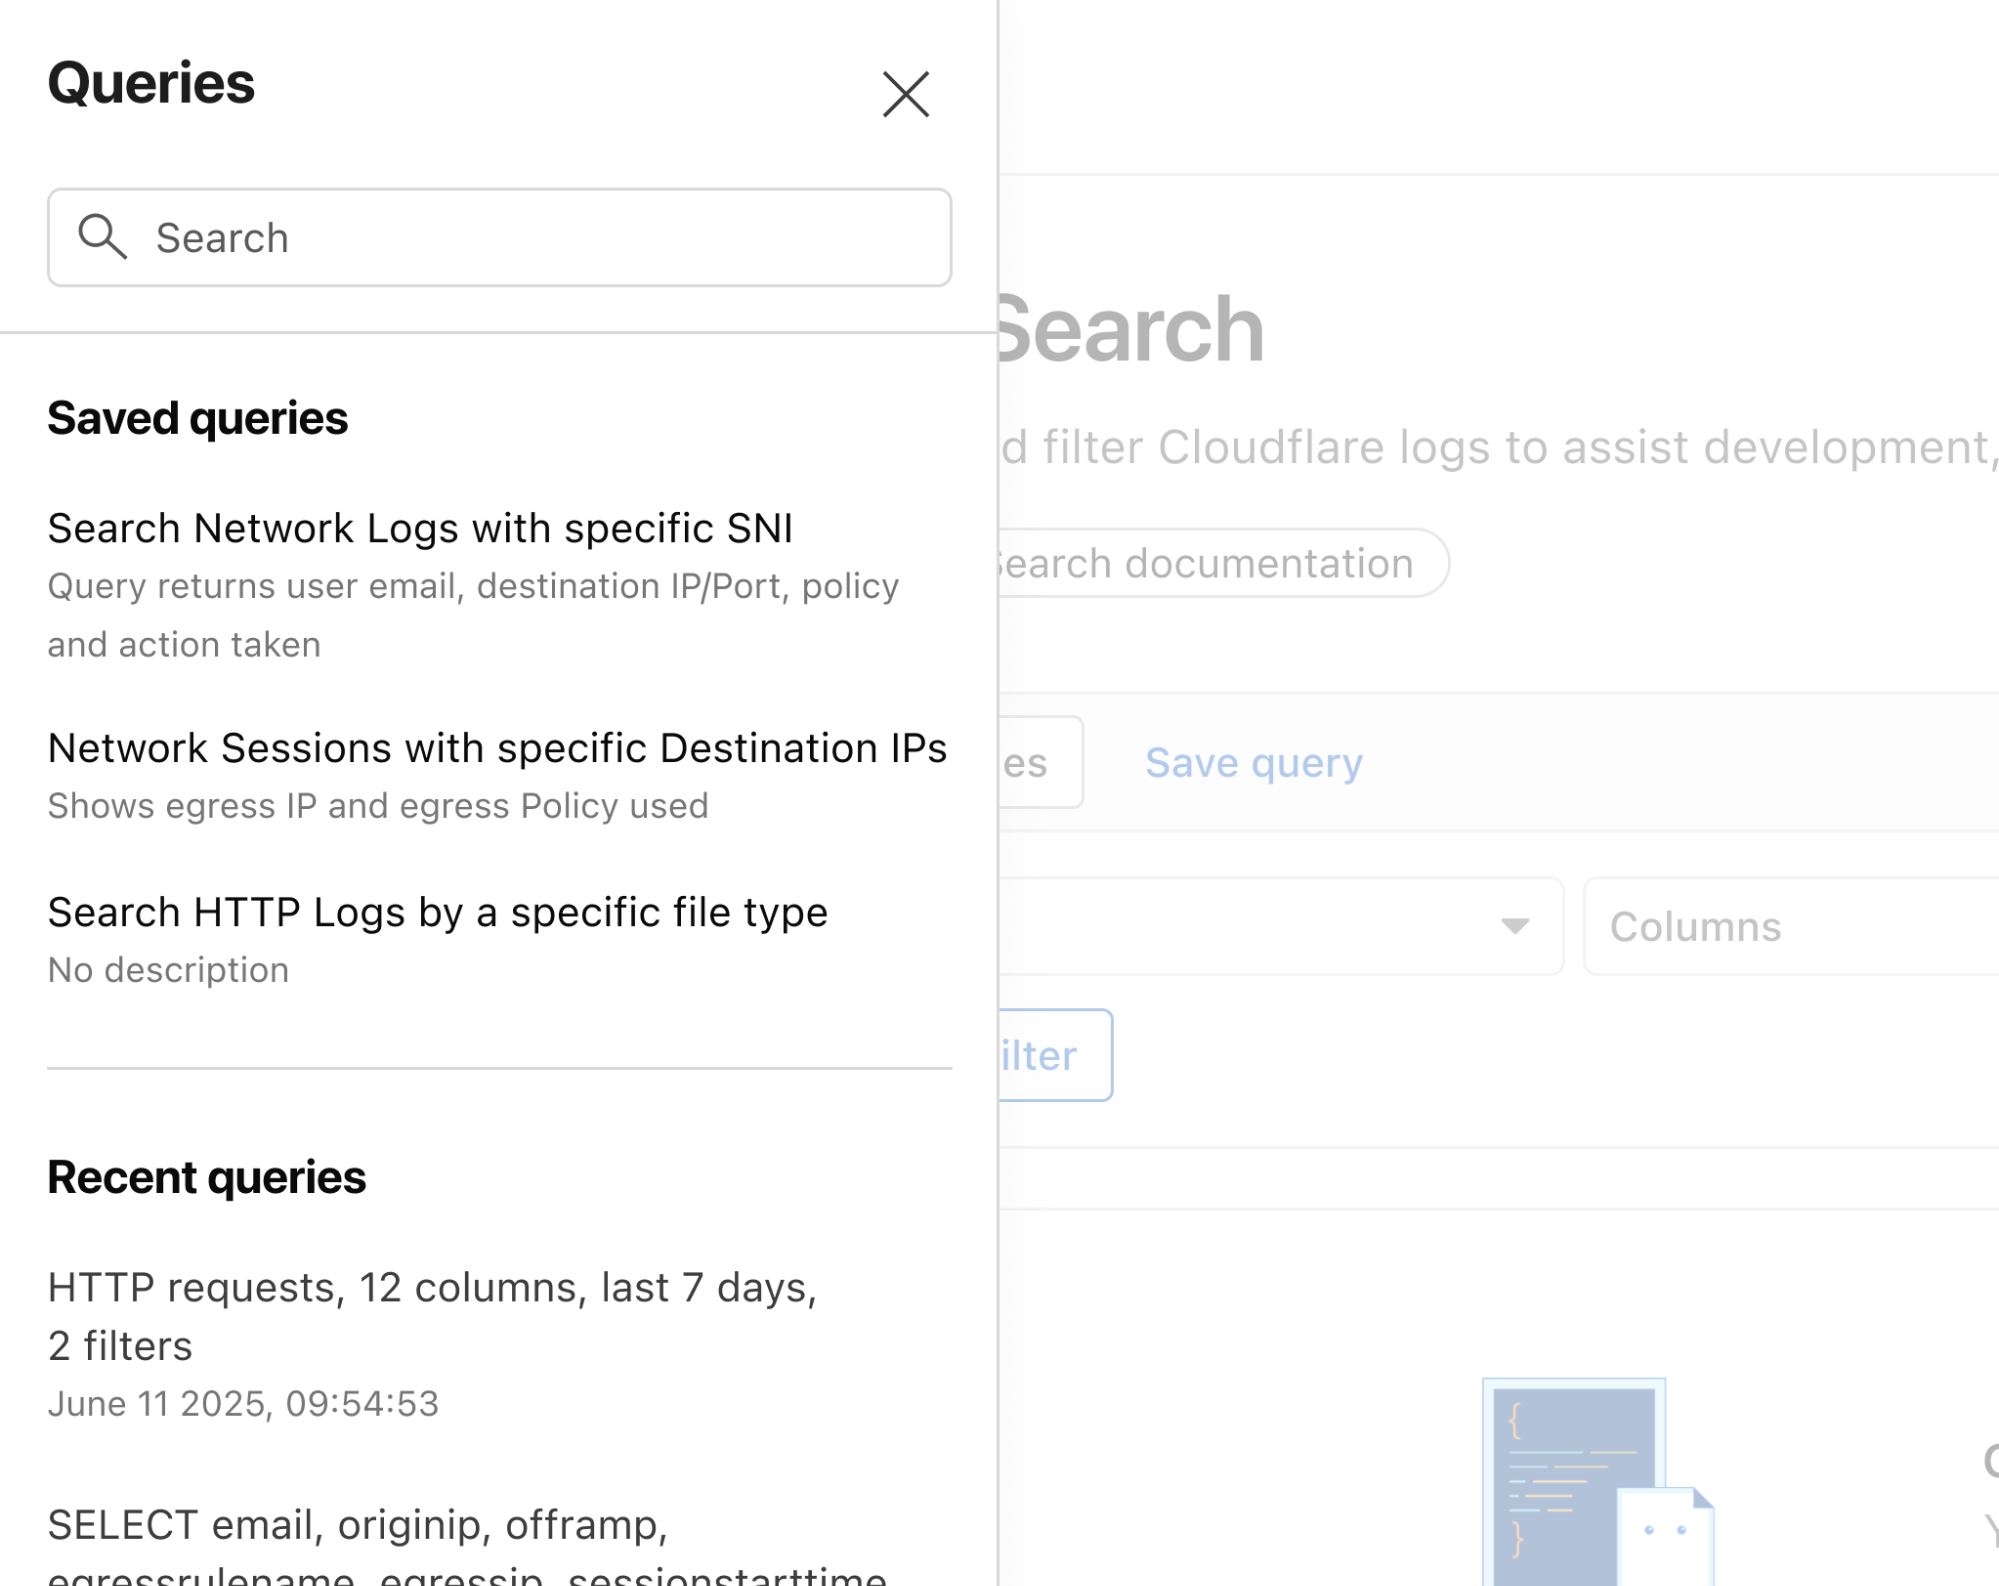
Save time and collaborate with saved queries
Queries built in Log Search can now be saved for repeated use and are accessible to other Log Explorer users in your account. This makes it easier than ever to investigate issues together.
Monitor proactively with Custom Alerting (coming soon)
With custom alerting, you can configure custom alert policies in order to proactively monitor the indicators that are important to your business.
Starting from Log Search, define and test your query. From here you can opt to save and configure a schedule interval and alerting policy. The query will run automatically on the schedule you define.
Tracking error rate for a custom hostname
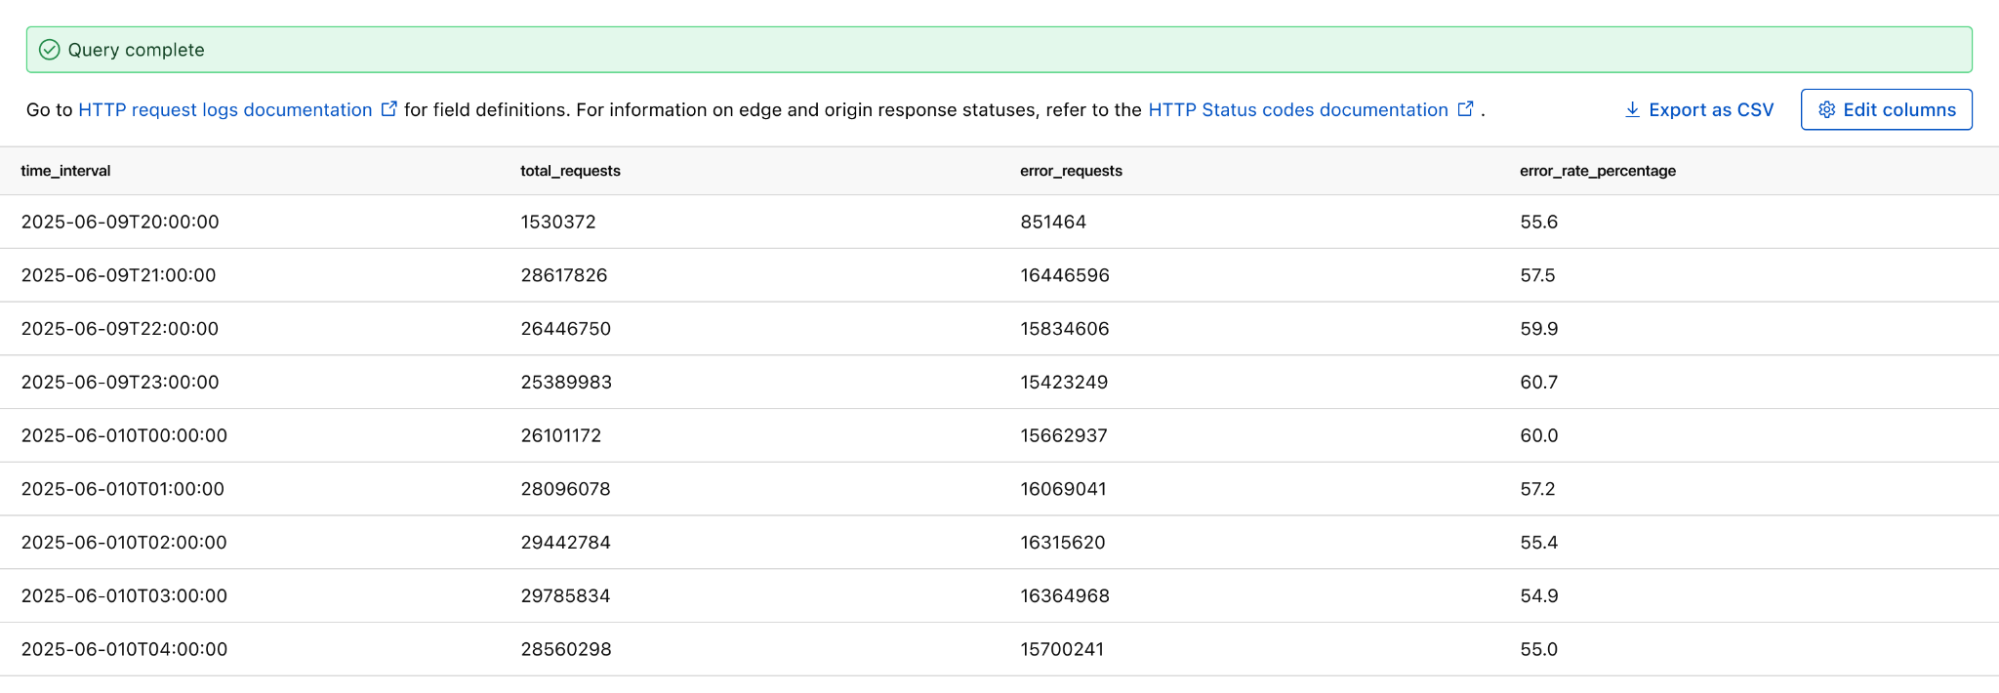
If you want to monitor the error rate for a particular host, you can use this Log Search query to calculate the error rate per time interval:
SELECT SUBSTRING(EdgeStartTimeStamp, 1, 14) || '00:00' AS time_interval,
       COUNT() AS total_requests,
       COUNT(CASE WHEN EdgeResponseStatus >= 500 THEN 1 ELSE NULL END) AS error_requests,
       COUNT(CASE WHEN EdgeResponseStatus >= 500 THEN 1 ELSE NULL END) * 100.0 / COUNT() AS error_rate_percentage
 FROM http_requests
WHERE EdgeStartTimestamp >= '2025-06-09T20:56:58Z'
  AND EdgeStartTimestamp <= '2025-06-10T21:26:58Z'
  AND ClientRequestHost = 'customhostname.com'
GROUP BY time_interval
ORDER BY time_interval ASC;
Running the above query returns the following results. You can see the overall error rate percentage in the far right column of the query results.
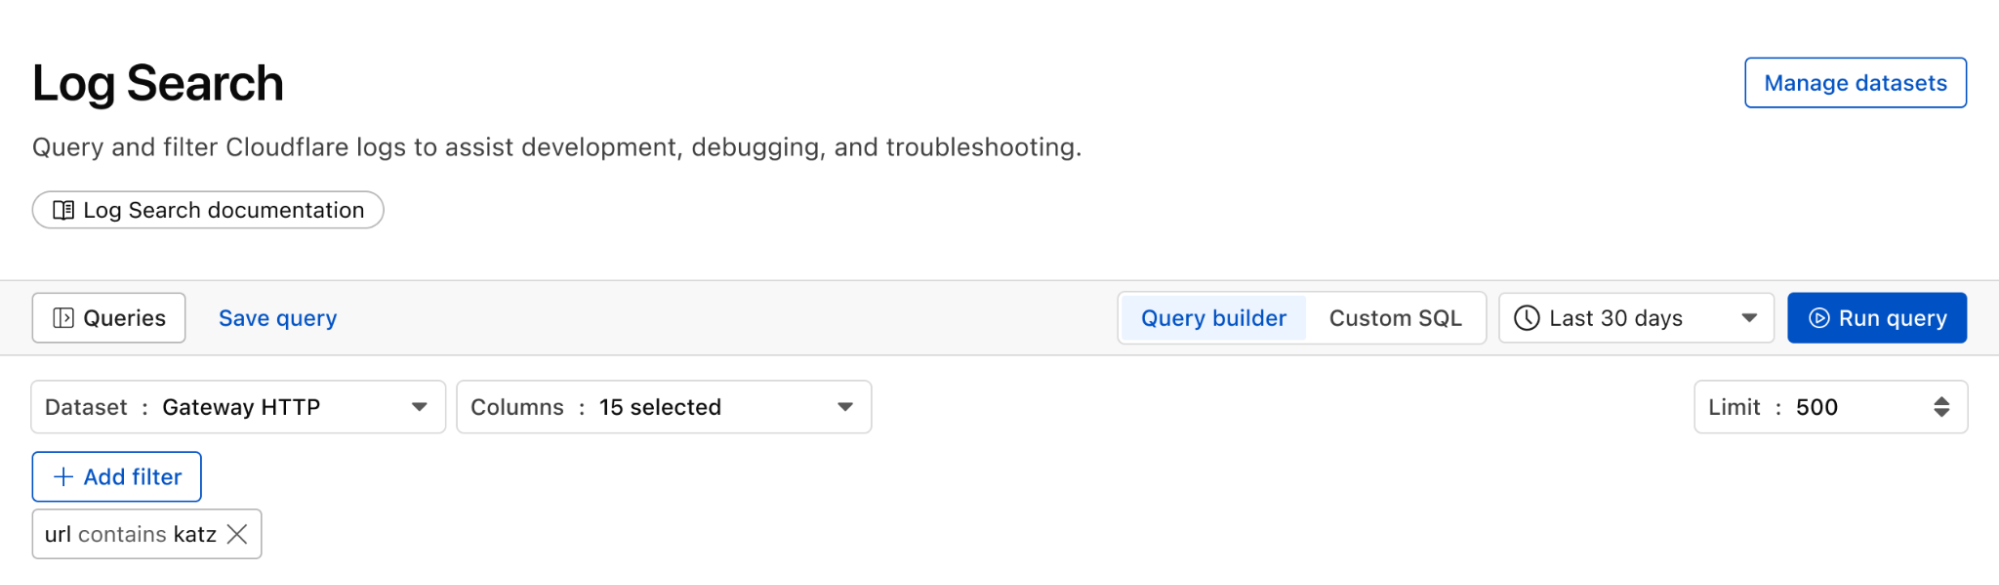
Proactively detect malware
We can identify malware in the environment by monitoring logs from Cloudflare Secure Web Gateway. As an example, Katz Stealer is malware-as-a-service designed for stealing credentials. We can monitor DNS queries and HTTP requests from users within the company in order to identify any machines that may be infected with Katz Stealer malware.
And with custom alerts, you can configure an alert policy so that you can be notified via webhook or PagerDuty.
Maintain audit & compliance with flexible retention (coming soon)
With flexible retention, you can set the precise length of time you want to store your logs, allowing you to meet specific compliance and audit requirements with ease. Other providers require archiving or hot and cold storage, making it difficult to query older logs. Log Explorer is built on top of our R2 storage tier, so historical logs can be queried as easily as current logs.
How we built Log Explorer to run at Cloudflare scale
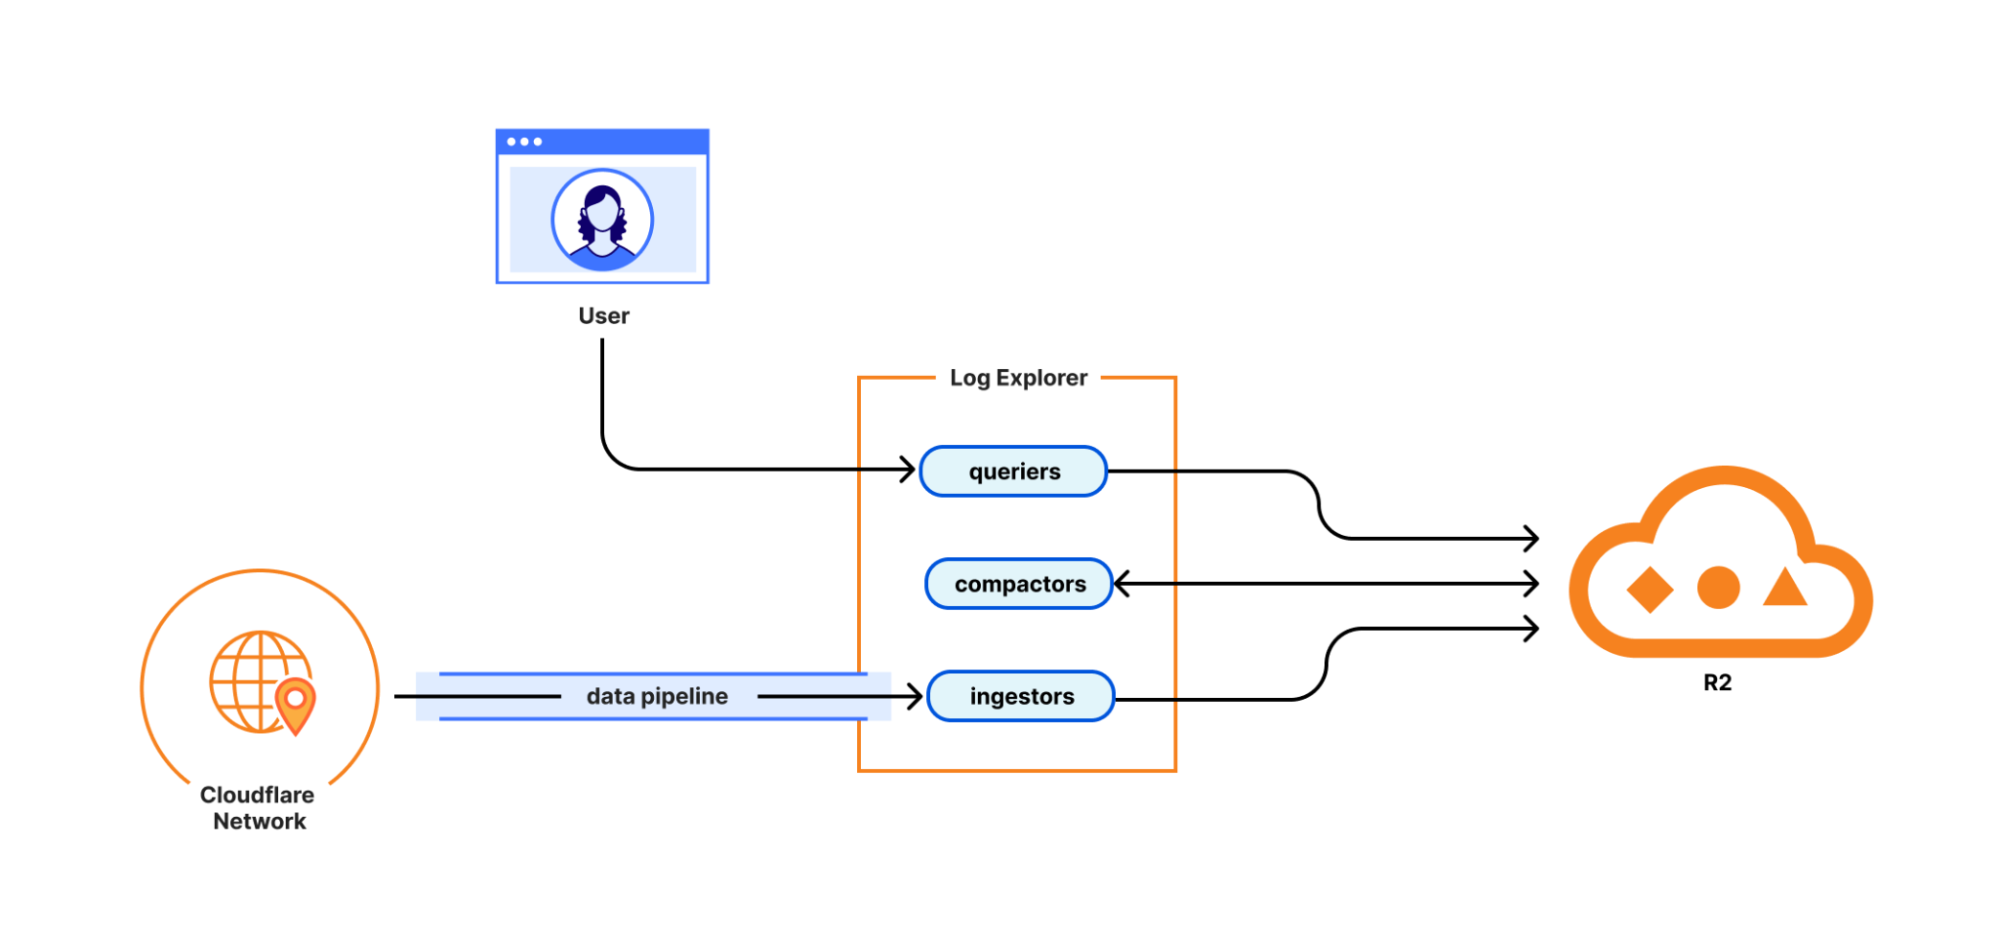
With Log Explorer, we have built a scalable log storage platform on top of Cloudflare R2 that lets you efficiently search your Cloudflare logs using familiar SQL queries. In this section, we’ll look into how we did this and how we solved some technical challenges along the way.
Log Explorer consists of three components: ingestors, compactors, and queriers. Ingestors are responsible for writing logs from Cloudflare’s data pipeline to R2. Compactors optimize storage files, so they can be queried more efficiently. Queriers execute SQL queries from users by fetching, transforming, and aggregating matching logs from R2.
During ingestion, Log Explorer writes each batch of log records to a Parquet file in R2. Apache Parquet is an open-source columnar storage file format, and it was an obvious choice for us: it’s optimized for efficient data storage and retrieval, such as by embedding metadata like the minimum and maximum values of each column across the file which enables the queriers to quickly locate the data needed to serve the query.
Log Explorer stores logs on a per-customer level, just like Cloudflare D1, so that your data isn't mixed with that of other customers. In Q3 2025, per-customer logs will allow you the flexibility to create your own retention policies and decide in which regions you want to store your data.
But how does Log Explorer find those Parquet files when you query your logs? Log Explorer leverages the Delta Lake open table format to provide a database table abstraction atop R2 object storage. A table in Delta Lake pairs data files in Parquet format with a transaction log. The transaction log registers every addition, removal, or modification of a data file for the table – it’s stored right next to the data files in R2.
Given a SQL query for a particular log dataset such as HTTP Requests or Gateway DNS, Log Explorer first has to load the transaction log of the corresponding Delta table from R2. Transaction logs are checkpointed periodically to avoid having to read the entire table history every time a user queries their logs.
Besides listing Parquet files for a table, the transaction log also includes per-column min/max statistics for each Parquet file. This has the benefit that Log Explorer only needs to fetch files from R2 that can possibly satisfy a user query. Finally, queriers use the min/max statistics embedded in each Parquet file to decide which row groups to fetch from the file.
Log Explorer processes SQL queries using Apache DataFusion, a fast, extensible query engine written in Rust, and delta-rs, a community-driven Rust implementation of the Delta Lake protocol. While standing on the shoulders of giants, our team had to solve some unique problems to provide log search at Cloudflare scale.
Log Explorer ingests logs from across Cloudflare’s vast global network, spanning more than 330 cities in over 125 countries. If Log Explorer were to write logs from our servers straight to R2, its storage would quickly fragment into a myriad of small files, rendering log queries prohibitively expensive.
Log Explorer’s strategy to avoid this fragmentation is threefold. First, it leverages Cloudflare’s data pipeline, which collects and batches logs from the edge, ultimately buffering each stream of logs in an internal system named Buftee. Second, log batches ingested from Buftee aren’t immediately committed to the transaction log; rather, Log Explorer stages commits for multiple batches in an intermediate area and “squashes” these commits before they’re written to the transaction log. Third, once log batches have been committed, a process called compaction merges them into larger files in the background.
While the open-source implementation of Delta Lake provides compaction out of the box, we soon encountered an issue when using it for our workloads. Stock compaction merges data files to a desired target size S by sorting the files in reverse order of their size and greedily filling bins of size S with them. By merging logs irrespective of their timestamps, this process distributed ingested batches randomly across merged files, destroying data locality. Despite compaction, a user querying for a specific time frame would still end up fetching hundreds or thousands of files from R2.
For this reason, we wrote a custom compaction algorithm that merges ingested batches in order of their minimum log timestamp, leveraging the min/max statistics mentioned previously. This algorithm reduced the number of overlaps between merged files by two orders of magnitude. As a result, we saw a significant improvement in query performance, with some large queries that had previously taken over a minute completing in just a few seconds.
Follow along for more updates
We're just getting started! We're actively working on even more powerful features to further enhance your experience with Log Explorer. Subscribe to the blog and keep an eye out for more updates in our Change Log to our observability and forensics offering soon.
In 2024, we announced Log Explorer, giving customers the ability to store and query their HTTP and security event logs natively within the Cloudflare network. Today, we are excited to announce that Log Explorer now supports logs from our Zero Trust product suite. In addition, customers can create custom dashboards to monitor suspicious or unusual activity.
Every day, Cloudflare detects and protects customers against billions of threats, including DDoS attacks, bots, web application exploits, and more. SOC analysts, who are charged with keeping their companies safe from the growing spectre of Internet threats, may want to investigate these threats to gain additional insights on attacker behavior and protect against future attacks. Log Explorer, by collecting logs from various Cloudflare products, provides a single starting point for investigations. As a result, analysts can avoid forwarding logs to other tools, maximizing productivity and minimizing costs. Further, analysts can monitor signals specific to their organizations using custom dashboards.
Zero Trust dataset support in Log Explorer
Log Explorer stores your Cloudflare logs for a 30-day retention period so that you can analyze them natively and in a single interface, within the Cloudflare Dashboard. Cloudflare log data is diverse, reflecting the breadth of capabilities available. For example, HTTP requests contain information about the client such as their IP address, request method, autonomous system (ASN), request paths, and TLS versions used. Additionally, Cloudflare’s Application Security WAF Detections enrich these HTTP request logs with additional context, such as the WAF attack score, to identify threats.
Today we are announcing that seven additional Cloudflare product datasets are now available in Log Explorer. These seven datasets are the logs generated from our Zero Trust product suite, and include logs from Access, Gateway DNS, Gateway HTTP, Gateway Network, CASB, Zero
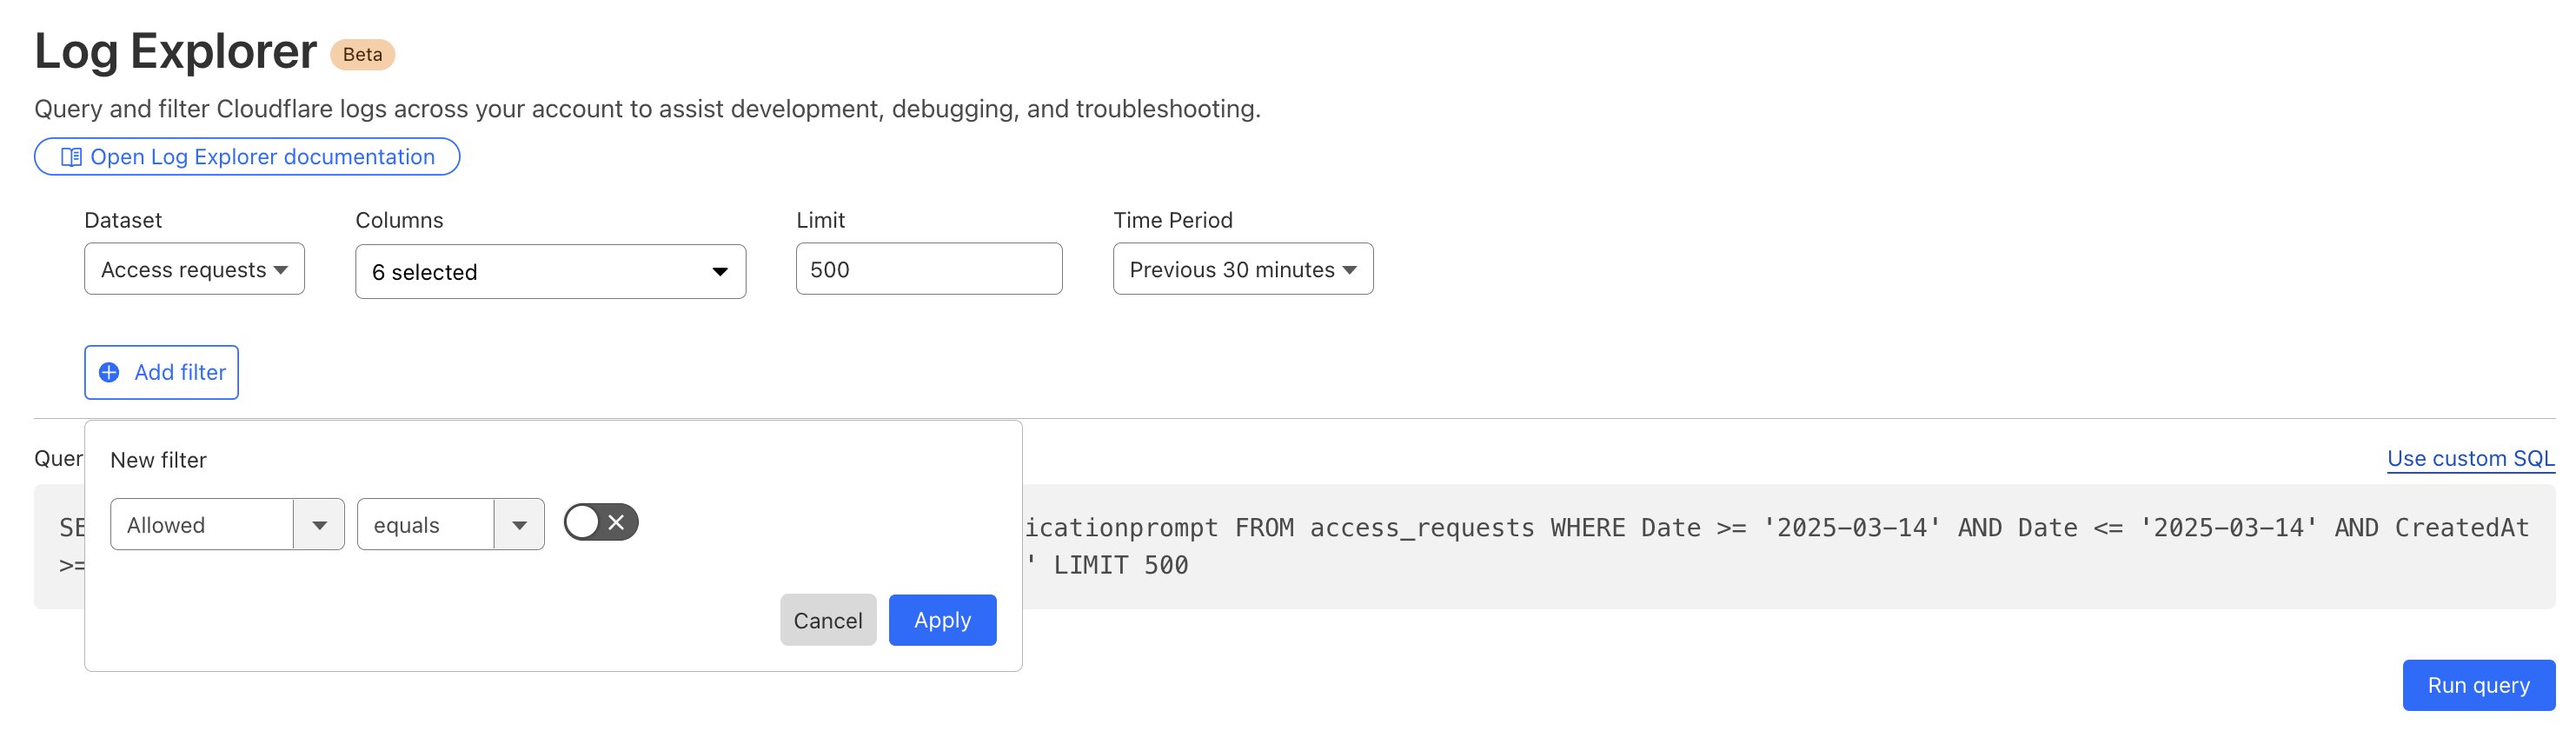
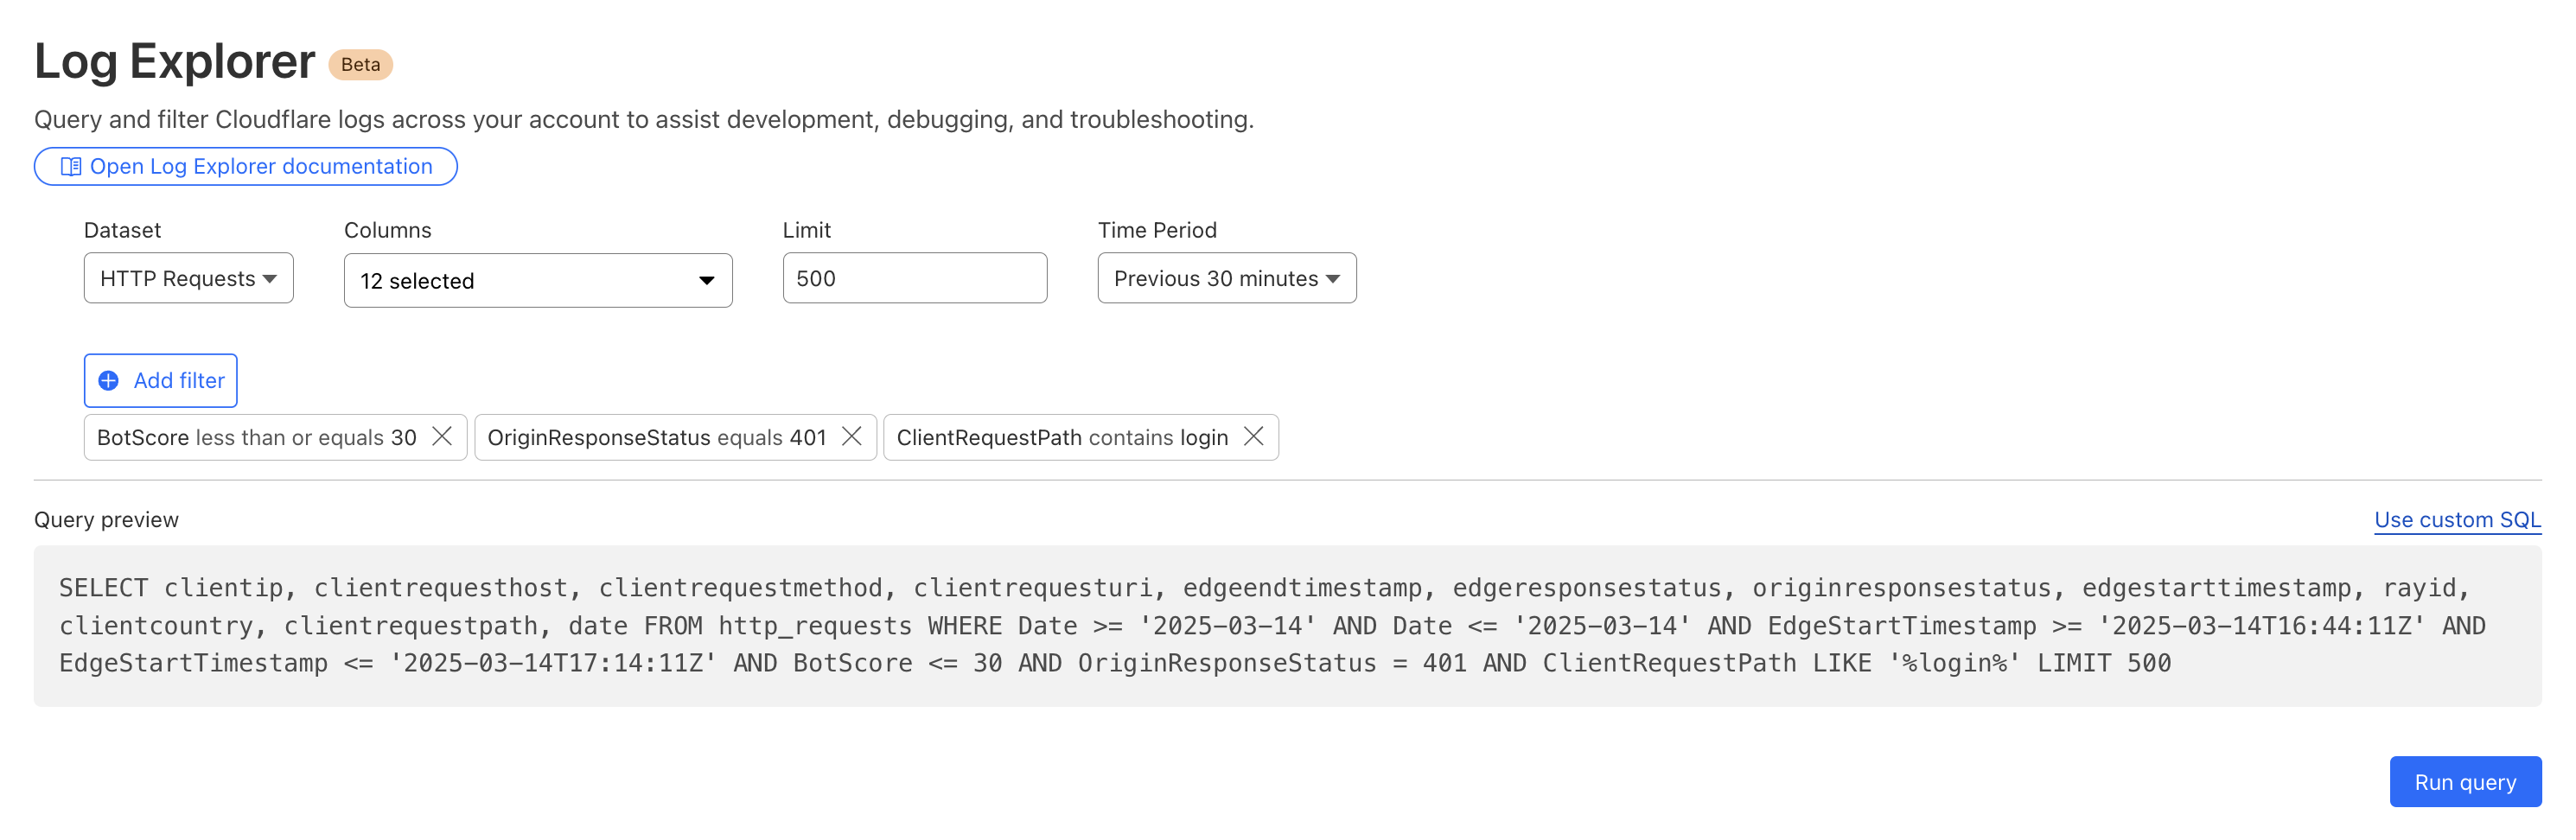
By reviewing Access logs and HTTP request logs, we can reveal attempts to access resources or systems without proper permissions, including brute force password attacks, indicating potential security breaches or malicious activity.
Below, we filter Access Logs on the Allowed field, to see activity related to unauthorized access.
By then reviewing the HTTP logs for the requests identified in the previous query, we can assess if bot networks are the source of unauthorized activity.
With this information, you can craft targeted Custom Rules to block the offending traffic.
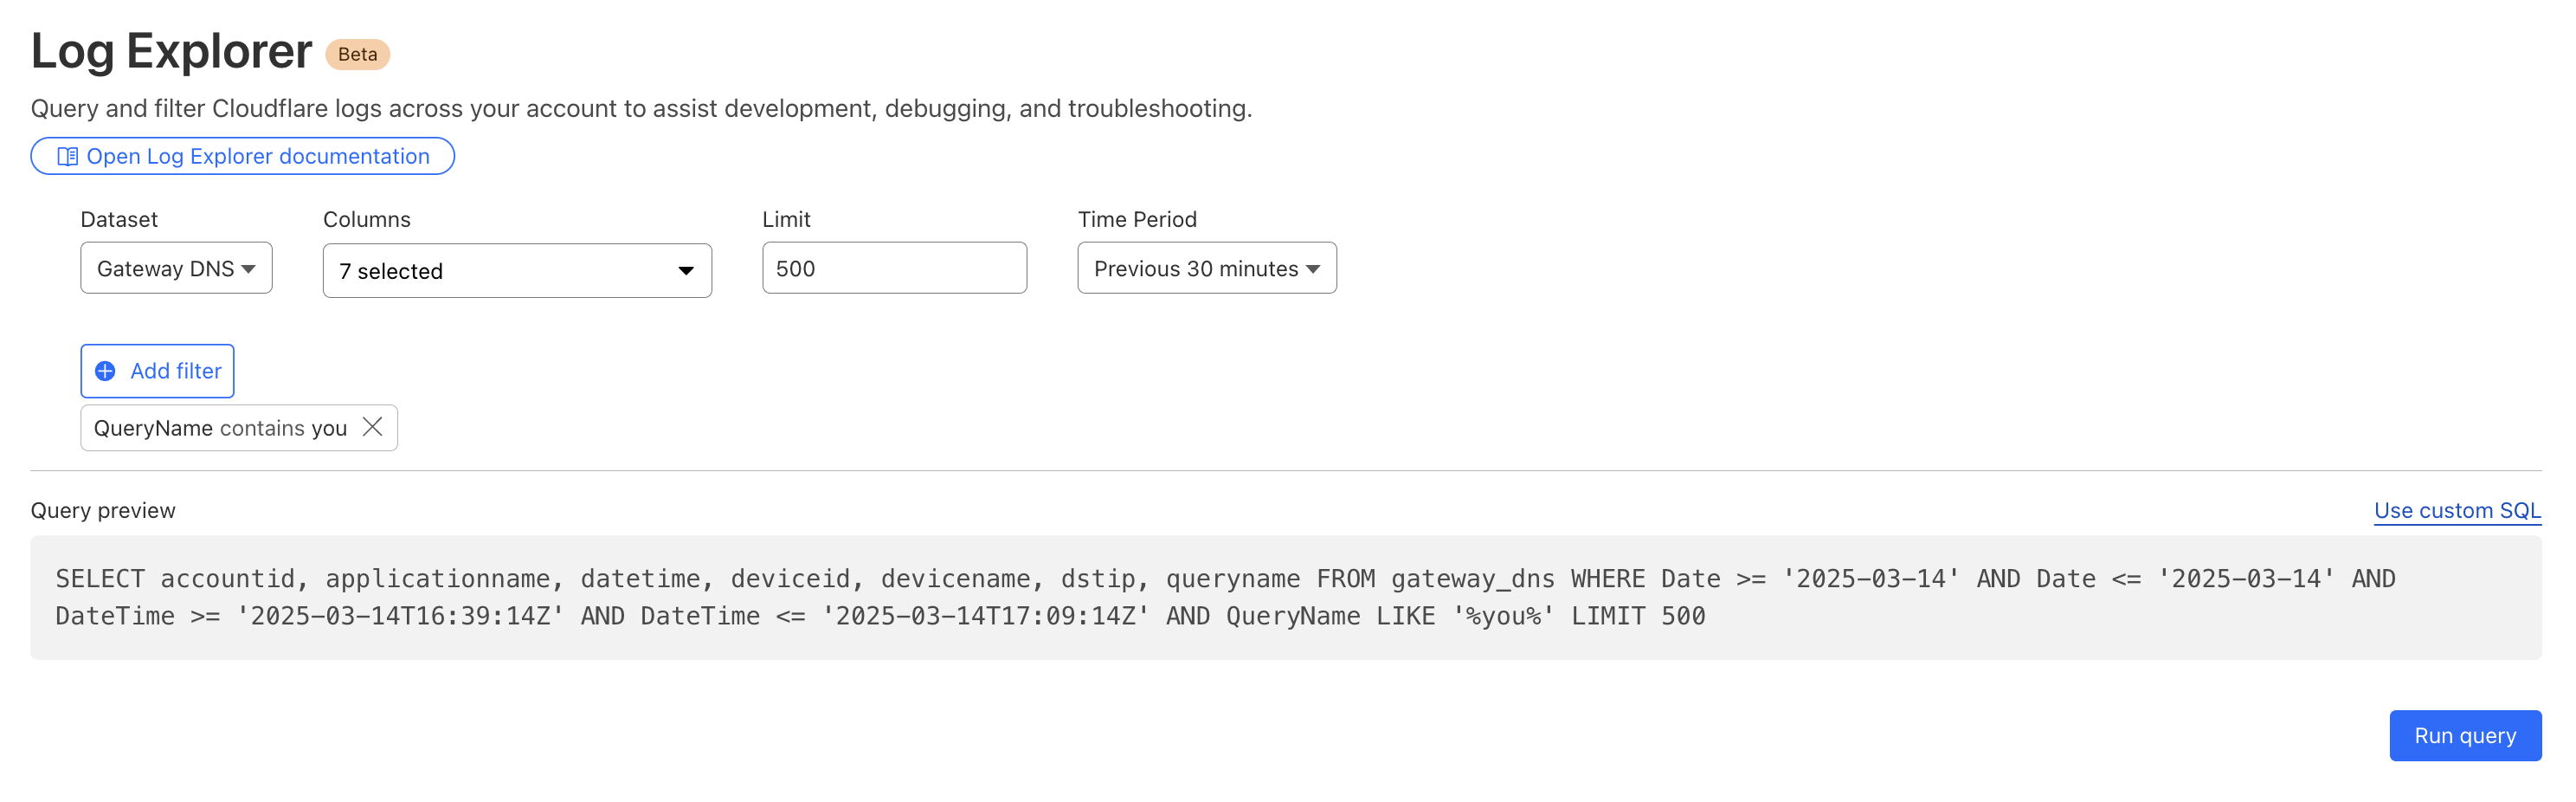
Detecting malware
Cloudflare's Web Gateway can track which websites users are accessing, allowing administrators to identify and block access to malicious or inappropriate sites. These logs can be used to detect if a user’s machine or account is compromised by malware attacks. When reviewing logs, this may become apparent when we look for records that show a rapid succession of attempts to browse known malicious sites, such as hostnames that have long strings of seemingly random characters that hide their true destination. In this example, we can query logs looking for requests to a spoofed YouTube URL.
Monitoring what matters using custom dashboards
Security monitoring is not one size fits all. For instance, companies in the retail or financial industries worry about fraud, while every company is concerned about data exfiltration, of information like trade secrets. And any form of personally identifiable information (PII) is a target for data breaches or ransomware attacks.
While log exploration helps you react to threats, our new custom dashboards allow you to define the specific metrics you need in order to monitor threats you are concerned about.
Getting started is easy, with the ability to create a chart using natural language. A natural language interface is integrated into the chart create/edit experience, enabling you to describe in your own words the chart you want to create. Similar to the AI Assistant we announced during Security Week 2024, the prompt translates your language to the appropriate chart configuration, which can then be added to a new or existing custom dashboard.
Use a prompt: Enter a query like “Compare status code ranges over time”. The AI model decides the most appropriate visualization and constructs your chart configuration.
Customize your chart: Select the chart elements manually, including the chart type, title, dataset to query, metrics, and filters. This option gives you full control over your chart’s structure.
Video shows entering a natural language description of desired metric “compare status code ranges over time”, preview chart shown is a time series grouped by error code ranges, selects “add chart” to save to dashboard.
For more help getting started, we have some pre-built templates that you can use for monitoring specific uses. Available templates currently include:
Bot monitoring: Identify automated traffic accessing your website
API Security: Monitor the data transfer and exceptions of API endpoints within your application
API Performance: See timing data for API endpoints in your application, along with error rates
Account Takeover: View login attempts, usage of leaked credentials, and identify account takeover attacks
Performance Monitoring: Identify slow hosts and paths on your origin server, and view time to first byte (TTFB) metrics over time
Templates provide a good starting point, and once you create your dashboard, you can add or remove individual charts using the same natural language chart creator.
Video shows editing chart from an existing dashboard and moving individual charts via drag and drop.
Example use cases
Custom dashboards can be used to monitor for suspicious activity, or to keep an eye on performance and errors for your domains. Let’s explore some examples of suspicious activity that we can monitor using custom dashboards.
Take, for example, our use case from above: investigating unauthorized access. With custom dashboards, you can create a dashboard using the Account takeover template to monitor for suspicious login activity related to your domain.
As another example, spikes in requests or errors are common indicators that something is wrong, and they can sometimes be signals of suspicious activity. With the Performance Monitoring template, you can view origin response time and time to first byte metrics as well as monitor for common errors. For example, in this chart, the spikes in 404 errors could be an indication of an unauthorized scan of your endpoints.
Seamlessly integrated into the Cloudflare platform
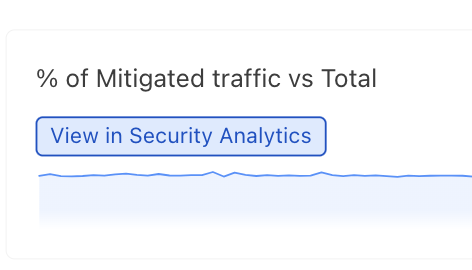
When using custom dashboards, if you observe a traffic pattern or spike in errors that you would like to further investigate, you can click the button to “View in Security Analytics” in order to drill down further into the data and craft custom WAF rules to mitigate the threat.
These tools, seamlessly integrated into the Cloudflare platform, will enable users to discover, investigate, and mitigate threats all in one place, reducing time to resolution and overall cost of ownership by eliminating the need to forward logs to third party security analysis tools. And because it is a native part of Cloudflare, you can immediately use the data from your investigation to craft targeted rules that will block these threats.
What’s next
Stay tuned as we continue to develop more capabilities in the areas of observability and forensics, with additional features including:
Custom alerts: create alerts based on specific metrics or anomalies
Scheduled query detections: craft log queries and run them on a schedule to detect malicious activity
More integration: further streamlining the journey between detect, investigate, and mitigate across the full Cloudflare platform.
How to get it
Current Log Explorer beta users get immediate access to the new custom dashboards feature. Pricing will be made available to everyone during Q2 2025. Between now and then, these features continue to be available at no cost.
Let us know if you are interested in joining our Beta program by completing this form, and a member of our team will contact you.