Visualização de leitura

Akira Ransomware Uses Safe Mode to Bypass EDR

Akira attackers used Safe Mode to disable EDR before deploying ransomware, but memory issues caused the encryptor to fail.

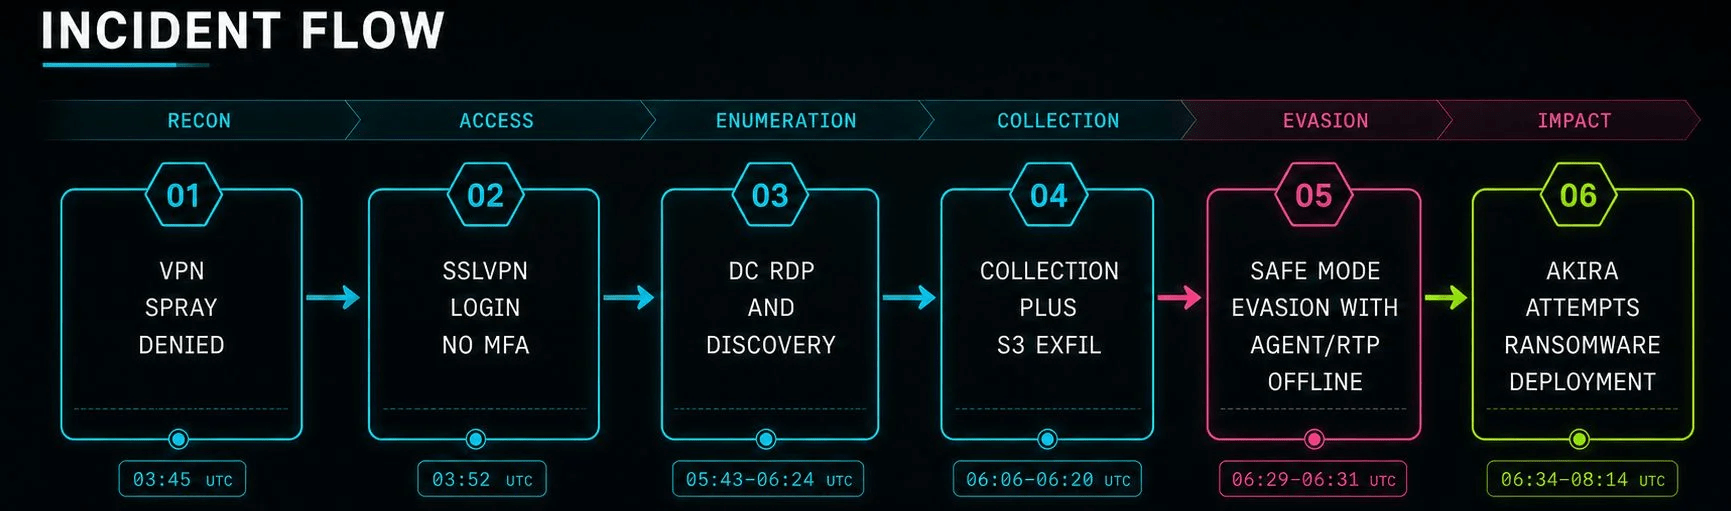
An Akira ransomware affiliate broke into a company through an MFA-less SonicWall VPN on August 4, stole credentials and file shares, and then rebooted the compromised host into Safe Mode with Networking to kill the security tools before launching the encryptor. The plan worked on the EDR. It did not work on the ransomware.

“After gaining access via an exposed SonicWall VPN, an Akira affiliate rebooted the victim host into Safe Mode with Networking to defeat EDR, a first for this ransomware variant in our telemetry.” reads the report published by Huntress.

“In this incident, Safe Mode also broke the ransomware. In its stripped-down memory environment, the Akira process tree hit an out-of-virtual-memory failure seconds after launching.”

The attacker also added AnyDesk to the Safe Mode registry before rebooting, so their remote access survived the restart even though everything else didn’t. For ten minutes, the host had no working EDR and Defender’s real-time protection was down.

The attack followed Akira’s standard playbook almost exactly: VPN credential spray resolved into a successful login at 03:52 UTC, then two hours of quiet before the operator RDP’d to the domain controller, dumped all Active Directory users and computers with a PowerShell enumeration that disabled truncation to capture every group membership, archived mapped file shares with WinRAR using the same flags documented in previous Akira campaigns, and uploaded the data to an attacker-controlled S3 bucket using s5cmd. Exfiltration happened before any encryption attempt, which matters, because it means the victim can still be extorted even when the ransomware fails.

The ransomware failed because Safe Mode limited available memory. About 13 seconds after launching, akira.exe triggered multiple memory errors, apparently overwhelming the stripped-down environment and causing the encryption process to fail.

akira.exe executed at 06:34:29 UTC and spawned its child-process burst at 06:36:21 UTC. About 13 seconds later, the host started throwing memory errors:” continues the report. “Safe Mode boots with a stripped-down environment and constrained virtual memory, and the Akira process tree appears to have starved it, getting the “Out of Virtual Memory” pop-up and the cascade of PowerShell hard errors line up exactly with the moment the payload tried to kick things off.”

Defender’s scheduled scan eventually detected akira.exe as Ransom:Win32/Akira.B!ibt, but couldn’t quarantine it while real-time protection was disabled in Safe Mode. The file was only removed after the attacker rebooted back to normal mode, restoring Defender’s protections, at which point their own anti-EDR move undid itself.

Huntress notes that Snatch and AvosLocker have abused Safe Mode for years, but this is the first time the company observed Akira using it. The more uncomfortable takeaway is that a host with more RAM or a larger page file might have given the encryptor enough memory to run successfully in Safe Mode. Akira’s developers could also reduce the payload’s memory footprint to make Safe Mode launches reliable, which means the same lucky failure won’t necessarily repeat.

The detection guidance is specific: alert on msconfig.exe or bcdedit activity, watch for Kernel-Boot Event ID 27 with a SAFEBOOT load option, Kernel-General Event ID 12 with BootMode=2, and third-party services stopping. Also watch for remote-access tools being added to the Safe Mode service registry, that’s the tell that the operator is planning to maintain access through the reboot.

“The takeaway is a little uncomfortable. While Safe Mode blinded our controls, it may also have prevented the encryption it was meant to enable. That’s a lucky side effect of the attacker’s own mistake in these circumstances, not a defence you can plan around.” concludes the report. “Ultimately, this could be a case of winning the battle, but not the war. It’s possible that a host with more physical memory or a larger page file might give akira.exe enough virtual memory to encrypt the endpoint in Safe Mode.  Akria’s developers or affiliates could retool the encryptor to reduce its memory demands or make its Safe Mode launch sequence more reliable, meaning that the same failure may not occur in a future intrusion.”

Follow me on Twitter: @securityaffairs and Facebook and Mastodon

Pierluigi Paganini

(SecurityAffairs – hacking, Akira Ransomware)

Inside GentleKiller: The EDR-Killer Powering The Gentlemen

The Gentlemen equips affiliates with a centralized EDR-killer suite, rapidly weaponizing BYOVD exploits to disable security tools before ransomware attacks.

ESET published a detailed breakdown of The Gentlemen‘s technical infrastructure on June 18, the result of months of incident-level investigation corroborated by the group’s own internal data leak from May 2026. Since emerging in late 2025, The Gentlemen has claimed 504 victims and established itself as one of the five most active ransomware operations in Q1 2026. What sets them apart isn’t the ransomware payload. It’s what they hand to affiliates before the payload ever runs.

Most ransomware-as-a-service operators leave affiliates to find their own tools for disabling endpoint security. The Gentlemen took a different approach.

“Gentlemen demonstrates an interesting approach: operator-managed EDR killers, ready to use by affiliates.” reads the report published by ESET. “While most ransomware gangs continue to delegate EDR killing to affiliates, Gentlemen has chosen to centralize this function by offering affiliates a ready-to-use, standardized EDR-killer suite. This decision makes Gentlemen an attractive operator for affiliates as it materially lowers the entry barrier for them, making their job consequently easier.”

The leaked internal data confirmed what ESET had hypothesized since February 2026: the group’s leader, operating under the handle zeta88, openly discussed maintaining and distributing EDR killer packages to affiliates.

The centerpiece of that suite is GentleKiller, an in-house framework with at least eight distinct variants. Each one impersonates a different legitimate product and abuses a different vulnerable or malicious kernel driver through a technique called Bring Your Own Vulnerable Driver, or BYOVD.

“GentleKiller is by far the most prevalent EDR killer observed in the Gentlemen ecosystem. At the time of writing, we are aware of at least eight distinct variants, each impersonating a different legitimate product and abusing a different vulnerable or malicious driver.” states ESET.

“When abstracting away the impersonation layer and the specific drivers used, the underlying code reveals numerous structural and behavioral commonalities that strongly suggest the use of a shared development template. This template is reused across variants, with only minimal modifications.”

The eight variants target drivers from Kaspersky, FACEIT Anti-Cheat, Valorant, Javelin, Safetica, Zemana, Qihoo 360, IObit, and the PoisonX rootkit. Across all variants, GentleKiller hunts for over 400 processes belonging to 48 distinct security products, including CrowdStrike, SentinelOne, Microsoft Defender, Sophos, Carbon Black, and ESET itself.

The researchers pointed out that the speed of adaptation is the other defining characteristic.

“This design prioritizes ease of deployment and operational flexibility for affiliates, while minimizing development effort for the operators.” continues the reèprt- “It allows the Gentlemen operators to integrate abused drivers into their toolset very soon after an EDR killer PoC is disclosed. This was the case with UnknownKiller and PoisonKiller, which were adopted within a matter of days.”

ESET measured this in days. The UnknownKiller and PoisonKiller proof-of-concepts were both adopted within days of their public release.

Beyond GentleKiller, the suite incorporates three third-party tools. HexKiller, previously associated exclusively with the Warlock ransomware gang, uses a Baidu Antivirus driver and appeared in Gentlemen intrusions staged in the same GentlemenCollection directory as GentleKiller. ThrottleBlood, more commonly seen in MedusaLocker and DragonForce affiliate attacks, uses a TechPowerUp driver. HavocKiller, disclosed publicly by Huntress in March 2026, was already active in Gentlemen intrusions dating back to January 23rd. ESET’s assessment is that all three were acquired externally by the operators and then standardized with the same defense evasion layer applied to GentleKiller: binary protection via Enigma or Themida, filenames mimicking security vendors, fabricated version information, copied digital signatures, and matching icons.

The victimology breaks a pattern that defines most major ransomware operations. Where Qilin, DragonForce, and Akira all show heavy US concentration, often around half their victims, The Gentlemen’s list skews toward Southeast Asia, South America, and Western Europe. The leaked data suggests this isn’t random: the group selects victims primarily based on FortiGate misconfiguration rather than geography, and centrally distributes targets to affiliates. That’s a structured selection process rather than affiliates each picking their own prey.

ESET also found a Rust-based credential stealer called OxideHarvest, also tracked as buildx641, linked to one of the group’s affiliates. It targets Chrome, Edge, Firefox, Brave, Opera, OperaGX, Vivaldi, Waterfox, and a dozen other browsers, using supplied credentials to log into specified hosts, pull browser credentials, and write them to an output file. Unlike GentleKiller, which shows clear evidence of in-house development, OxideHarvest is attributed to an affiliate named quant rather than the core operators.

Brian Krebs published evidence on June 10 of the true identity of hastalamuerte, the group’s founder, identified as 36-year-old Russian national Alexander Andreevich Yapaev, a former affiliate of Qilin, Embargo, LockBit, Medusa, and BlackLock.

“The breach tracking service Constella Intelligence reports that Hastalamuerte’s Telegram ID is connected to another username — “bu4vs” — and to the Russian phone number 79127650004.” wrote Krebs. “Pivoting on this phone number in Constella fetches multiple records from hacked Russian government databases showing it is assigned to one Alexander Andreevich Yapaev, a 36-year-old from Izhevsk.”

According to the report, The Gentlemen rapidly weaponizes newly disclosed BYOVD proof-of-concepts, often incorporating vulnerable driver exploits into operations within days of public release.

For defenders, the ESET report’s practical implication is this: GentleKiller’s process targeting list is now public, which means defenders can use it to design monitoring and detection strategies that remain effective even against variants that haven’t been built yet.

“Gentlemen demonstrates an interesting approach: operator-managed EDR killers, ready to use by affiliates. While most ransomware gangs continue to delegate EDR killing to affiliates, Gentlemen has chosen to centralize this function by offering affiliates a ready-to-use, standardized EDR-killer suite.” concludes the report. “This decision makes Gentlemen an attractive operator for affiliates as it materially lowers the entry barrier for them, making their job consequently easier.”

Follow me on Twitter: @securityaffairs and Facebook and Mastodon

Pierluigi Paganini

(SecurityAffairs – hacking, The Gentlemen)

DetectFlow: Deploying Detections at Scale Without the Engineering Overhead

DetectFlow Cuts SIEM Costs and Speeds Threat Detection

The Problem: Achieving Threat Detections at Scale  

At SOC Prime, we have spent over a decade making detection engineering easier for organizations of every size. Each year, as threats multiply and environments grow more complex, the traditional approach puts SOC Managers in an impossible position — responsible for coverage they cannot achieve with the tools and team they have. DetectFlow offers a path to deploying detections at scale without the engineering overhead. Here is what it solves:

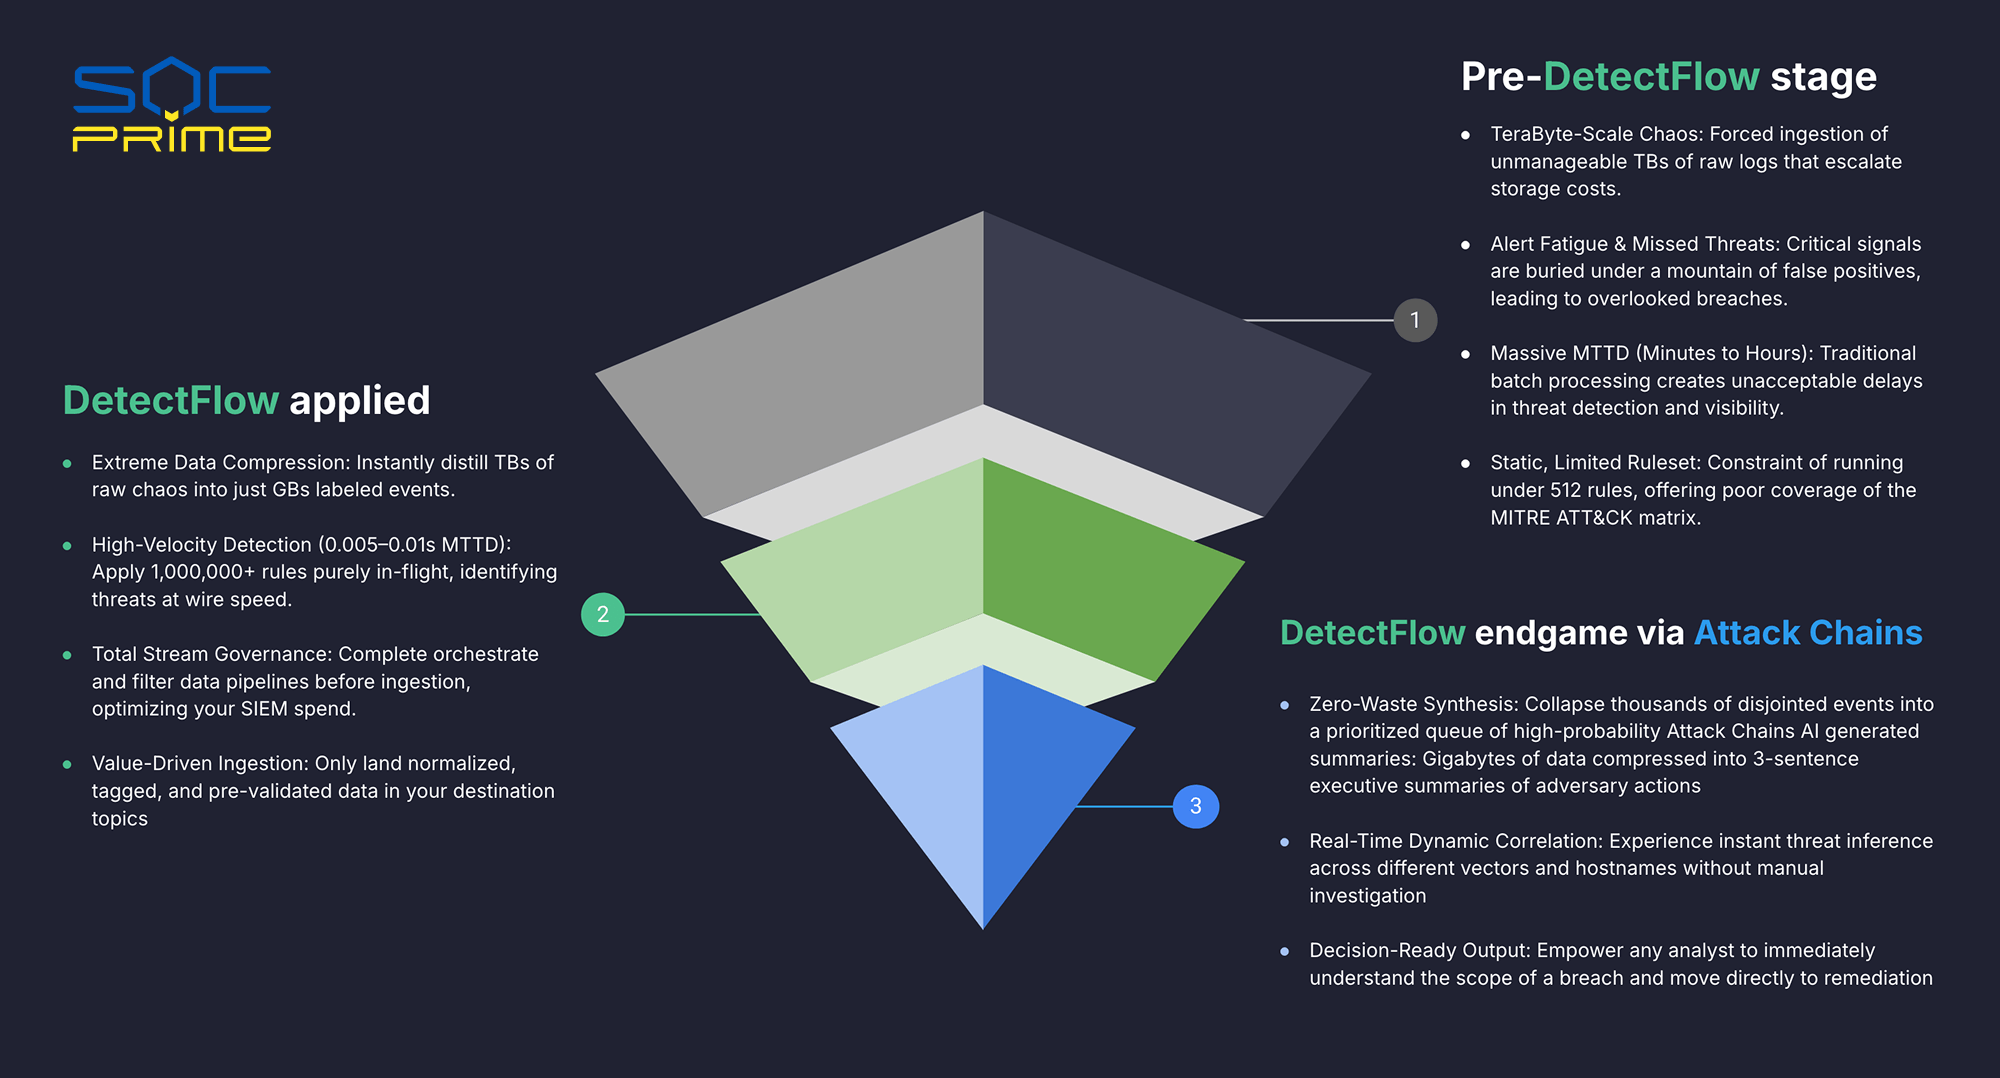
  • Your team is drowning in noise, not finding threats: False positives overwhelm analysts and real signals get missed. Alert fatigue isn’t a people problem, it’s a systems problem
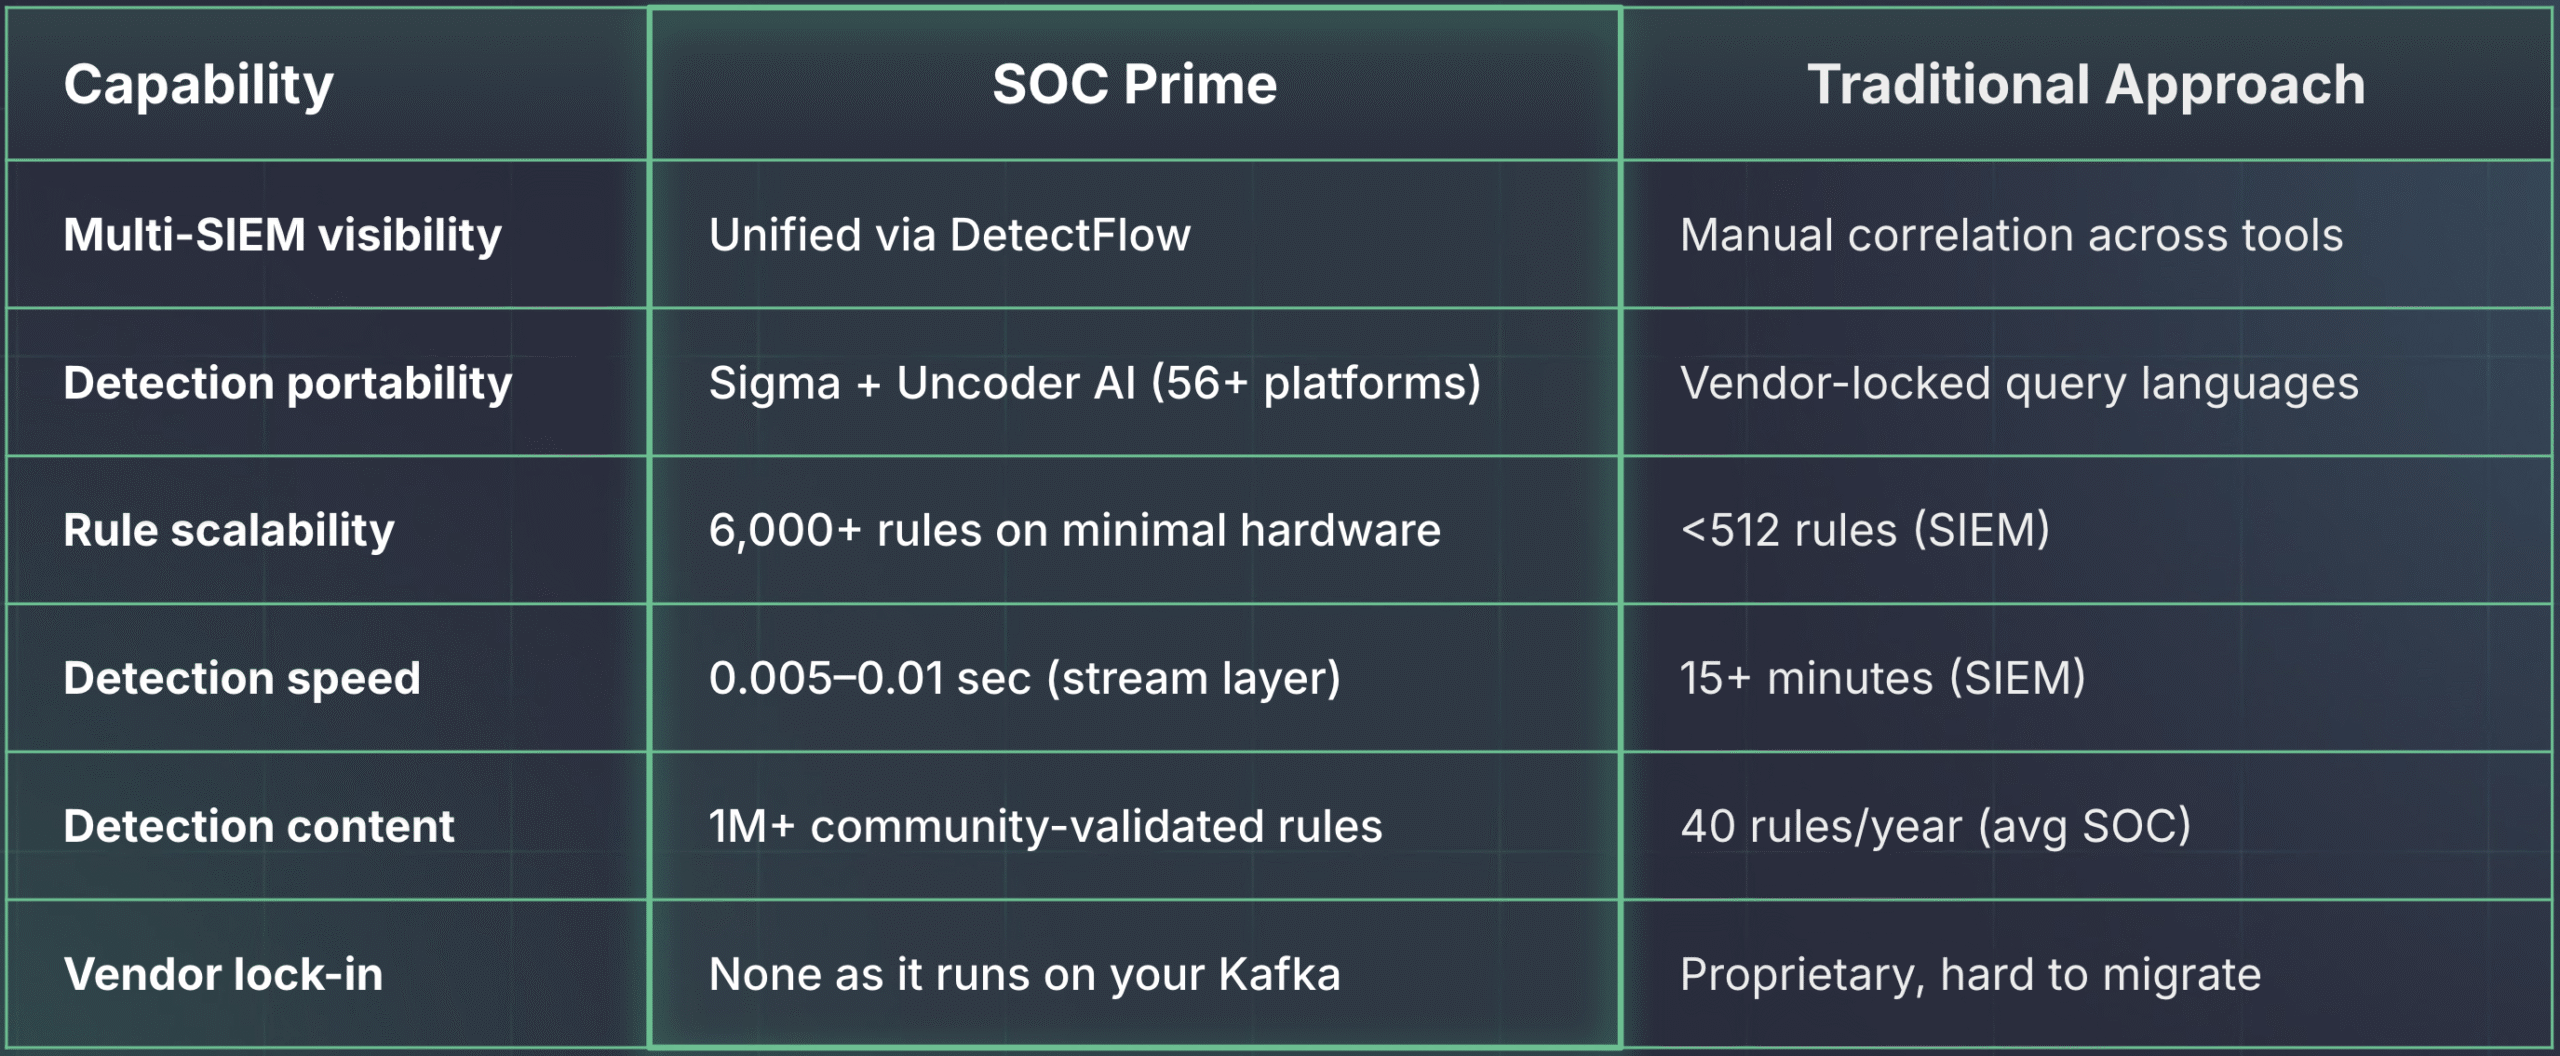
  • Your detection coverage has hard limits you can’t engineer around: Running under 512 rules means your team has blind spots across the MITRE ATT&CK matrix that no amount of headcount can close
  • By the time your team sees a threat, the attacker has already moved: Batch processing creates detection delays measured in minutes to hours, turning a containable incident into a breach
  • Your SIEM budget is consumed by data you never needed: Forced ingestion of raw logs at terabyte scale drives storage costs that are impossible to justify to leadership


DetectFlow Applied: Cut Costs and add Speed

DetectFlow fundamentally changes the economics and speed of threat detection. Rather than ingesting raw chaos and sorting it out later, DetectFlow:

  • compresses terabytes of raw log data into gigabytes of clean, labeled events (instantly, before anything touches your SIEM). 
  • detection happens in-flight, at wire speed, applying 50,000+ in real time and driving mean time to detect down to 0.005–0.01 seconds
  • the entire data pipeline is governed and filtered before ingestion, so your SIEM only receives normalized, tagged, and pre-validated events resulting in dramatic optimization of your SIEM spend: you’re paying to store and analyze signal, not noise.


The Endgame: Attack Chains That Tell the Full Story

Where DetectFlow truly separates itself is in how it surfaces what matters. Instead of handing analysts thousands of disjointed, low-context alerts to manually correlate, DetectFlow: 

  • collapses that noise into a prioritized queue of high-probability Attack Chains, complete with AI-generated executive summaries that condense gigabytes of adversary activity into a clear brief. 
  • Threat inference happens in real time, automatically correlating activity across different vectors and hostnames without requiring any manual investigation. 
  • The output isn’t a list of alerts: it’s a decision. Any analyst, regardless of experience level, can immediately understand the full scope of a breach and move directly to remediation.

 To learn more about DetectFlow head to our overview page.

FAQ

How does DetectFlow reduce SIEM costs?

DetectFlow sits upstream of your SIEM, processing raw event streams before they are ever ingested. It compresses terabytes of raw log data down to roughly 7% of the original volume, filtering out the noise and passing only normalized, threat-tagged events into your SIEM. The result is that your SIEM licensing and storage costs are calculated against signal, not raw volume. For organizations ingesting at scale, that shift alone can be the difference between a sustainable security budget and one that is impossible to defend to a CFO.

What is MTTD and how does DetectFlow improve it?

MTTD (Mean Time to Detect) is the measure of how long it takes your team to identify an active threat after it begins. Traditional SIEM architectures rely on batch processing, which means detection queries run on a delay, often 15 minutes or more after an event occurs. DetectFlow applies detection rules in real time, directly against the live data stream, reducing MTTD to between 0.005 and 0.01 seconds. In practical terms, that is the difference between catching an attacker in the first move and discovering a breach after lateral movement has already occurred.

Why can’t we just add more detection rules to our SIEM?

Most enterprise SIEMs have a hard operational ceiling on how many rules can run simultaneously. Microsoft Sentinel, for example, caps at 512. Beyond the rule limit, every additional rule adds query overhead, slows detection, and increases costs. DetectFlow runs detection at the pipeline layer using Apache Flink, where it can apply tens of thousands of Sigma rules simultaneously without those constraints. That is what allows your team to close MITRE ATT&CK coverage gaps that are simply not addressable inside a SIEM architecture.

Does DetectFlow replace our existing SIEM?

No. DetectFlow integrates with your existing SIEM, it does not replace it. It sits in the Kafka pipeline layer before ingestion, and your SIEM receives cleaner, pre-enriched, threat-tagged events through the same connectors it already uses. Your analysts continue working in familiar dashboards. The change they notice is better data quality, fewer false positives, and faster investigations, not a new tool to learn.

What does “Attack Chains” mean and why does it matter for my team?

Attack Chains is how DetectFlow surfaces correlated threats rather than individual alerts. Instead of passing thousands of isolated events to your analysts for manual investigation, DetectFlow uses AI to collapse related activity across different vectors and hostnames into a single prioritized queue, with a three-sentence executive summary of what the adversary is doing. For a SOC Manager, that means your team is triaging a coherent story about an attack in progress, not a pile of disconnected signals that require hours of investigation before the picture becomes clear.


The post DetectFlow: Deploying Detections at Scale Without the Engineering Overhead appeared first on SOC Prime.

Securing the Supply Chain: How SentinelOne®’s AI EDR Stops the Axios Attack Autonomously

A guide to the suspected North Korean cyber attack—and how SentinelOne defends against it at machine speed

On March 31, 2026, a North Korean state actor hijacked the npm credentials of the primary Axios maintainer and published two backdoored releases that deployed a cross-platform remote access trojan (RAT) to Windows, macOS, and Linux systems. Axios is the most widely used HTTP client in the JavaScript ecosystem, with approximately 100 million weekly downloads and a presence in roughly 80% of cloud and code environments. The malicious versions were live for approximately three hours. An estimated 600,000 downloads occurred during that window with no user interaction required beyond a routine npm install.

SentinelOne protects against this attack, demonstrating why autonomous, layered defense at machine speed is not optional when adversaries operate at this velocity. In this attack, the first infection was observed 89 seconds after publication. At that pace, manual workflows do not have a response window. They have a spectator seat.

For SentinelOne’s customers and partners, here’s a quick overview of the compromise, SentinelOne’s response, and steps you can take to further protect your environment.

What Happened: The Anatomy of a State-Level Supply Chain Weapon

The attacker, tracked as UNC1069 by Google Threat Intelligence and Sapphire Sleet by Microsoft, compromised maintainer credentials and published axios@1.14.1 (tagged “latest”) and axios@0.30.4 (tagged “legacy”). Each version introduced a single new dependency: plain-crypto-js@4.2.1, a purpose-built trojan. The malicious package’s postinstall hook silently deployed a cross-platform RAT communicating over HTTP to C2 infrastructure at sfrclak[.]com (142.11.206[.]73), commonly being referred to as WAVESHAPER.V2.

The operational sophistication was striking. The attacker pre-staged a clean version of plain-crypto-js 18 hours before detonation to evade novelty-based detection. Publication occurred just after midnight UTC on a Sunday to maximize the response window. The malware self-deleted after execution, swapping its malicious package.json for a clean stub, leaving forensic evidence only in lockfiles and audit logs.

Most critically, Axios had adopted OIDC Trusted Publishing, the post-Shai-Hulud hardening measure npm promoted as the solution to credential-based attacks. But the OIDC configuration coexisted with a long-lived npm access token. npm’s authentication logic prioritizes environment variable tokens over OIDC when both are present. The attacker stole the legacy token and bypassed every modern control the project had in place.

The issue is architectural: security controls that coexist with the mechanisms they are meant to replace provide a false sense of protection. Axios had Trusted Publishing, SLSA provenance, and GitHub Actions workflows. None of it mattered because the old key was still under the mat.

How SentinelOne Is Protecting Customers

Behavioral Detection via the Lunar Engine

SentinelOne’s Lunar behavioral engine detects the renamed binary execution technique central to the Windows attack chain, in which PowerShell is copied to %PROGRAMDATA%\wt.exe and executed under a disguised process. The RenamedBinExecution logic catches this behavior regardless of the specific payload hash, providing durable detection against variants.

Global Hash Blocklist

All known stage payloads, malicious npm package tarballs, and RAT binaries across Windows, macOS, and Linux have been added to the SentinelOne Cloud blocklist with a globally blocked reputation status. This provides immediate protection for all customers with cloud-connected agents.

Wayfinder Threat Hunting

The Wayfinder Threat Hunting team executed proactive hunts across all MDR regions and operating systems using Axios-specific IOCs, including DNS queries to sfrclak[.]com, file artifacts (com.apple.act.mond, /tmp/ld.py, wt.exe), and consolidated hash sets. All true positive findings generate console alerts, with MDR customers receiving direct analyst engagement and escalation.

Sustained Research on This Threat Actor

SentinelLABS has tracked BlueNoroff, the DPRK-linked threat cluster with significant overlap to UNC1069, across multiple campaigns targeting macOS and credential theft operations. The WAVESHAPER.V2 macOS binary recovered from the Axios compromise carries the internal project name “macWebT,” a direct lineage marker to BlueNoroff’s documented webT module. SentinelLABS published detailed analysis of this tooling family in 2023 when RustBucket first emerged as a macOS-targeted campaign, and again in 2024 when BlueNoroff shifted to fake cryptocurrency news as a delivery mechanism with novel persistence techniques.

The initial access vector matters here, too. In March 2026, Google Threat Intelligence reported that UNC1069 leverages ClickFix, a social engineering technique that weaponizes user verification fatigue, as an initial access vector for credential harvesting. SentinelLABS had already published a detailed analysis of ClickFix techniques and their use in delivering RATs and infostealers before Google’s attribution dropped.

The behavioral detections that caught the Axios compromise were built on this accumulated intelligence, not written after the fact.

Live Security Updates (LSU)

Customers with LSU enabled receive real-time detection updates without waiting for agent releases, ensuring coverage evolves as fast as the threat intelligence does. This is critical for rapidly evolving supply chain campaigns where new IOCs emerge hourly.

What You Should Do Now

Supply chain compromise exploits the inherent trust enterprises place in their software delivery infrastructure. When that trust is weaponized by a state-level actor, the response must be both immediate and structural.

  1. Audit and contain. Search all environments for axios@1.14.1 and axios@0.30.4. Treat any system that installed either version during the exposure window as fully compromised. Rebuild from known-good images rather than attempting in-place cleanup.
  2. Rotate every credential the endpoint could reach. npm tokens, SSH keys, CI/CD secrets, cloud provider keys, and API tokens accessible from impacted systems must be rotated immediately. The RAT was designed to harvest exactly these credential types.
  3. Pin dependencies and enforce lockfiles. Use npm ci (not npm install) in all CI/CD pipelines. Commit and audit lockfiles. Organizations using strict lockfile discipline were protected even during the three-hour exposure window. This is the single most actionable control.
  4. Eliminate legacy npm tokens. Inventory all long-lived tokens across the organization. Migrate to OIDC Trusted Publishing and revoke legacy tokens entirely. Do not leave them as fallbacks. The coexistence of old and new authentication is what this attack exploited.
  5. Harden detection policy. Ensure Behavioral AI and Documents & Scripts engines are set to Protect (On Execute). Avoid broad exclusions for developer tools like node.exe or npm. Enable LSU for real-time detection updates.
  6. Extend endpoint coverage to developer workstations and CI runners. These environments have access to production secrets, deployment credentials, and code signing infrastructure. They are typically less monitored than production servers. DPRK has recognized this asymmetry and is systematically exploiting it.
  7. Hunt proactively. Use Deep Visibility to search for DNS queries to sfrclak[.]com, connections to 142.11.206[.]73, and the presence of plain-crypto-js in any node_modules directory. SentinelOne’s 2025 Annual Threat Report documents how supply chain attacks are part of a broader pattern where adversaries are “shifting left” to subvert the build process itself, compromising software before it ever reaches production.

Practitioner Investigative Guide

In addition to the strategic recommendations above, here are some specific queries, file paths, and commands you can execute now to protect your environment.

Determine Blast Radius

Your first job is to answer one question: did any system in my environment pull a compromised Axios version during the March 31 exposure window (00:21 – 03:25 UTC)?

In the SentinelOne Console:

  • Open the Wayfinder alert queue. Look for the alert name “Axios NPM Supply Chain Compromise” (Wayfinder retroactive rule). If these alerts are not visible under default filters, switch the alert type from “EDR” to “All”, as these surface as Custom/STAR alerts.
  • For each alert, review the Storyline and process tree. The typical chain looks like this:
    • Developer process (VS Code, Electron, Node, Yarn, npx) → nodesetup.js under plain-crypto-jscurl download from sfrclak[.]com:8000/6202033 → OS-specific payload execution
  • Classify the affected asset: developer workstation, CI/CD runner, or production server. This drives urgency. Shared CI runners imply wider blast radius because multiple teams and credential sets may be exposed.

Deep Visibility / Event Search hunts to run immediately:

What You’re Looking For Query Pattern
C2 DNS resolution #dns contains:anycase 'sfrclak.com'
C2 IP connection #ip contains '142.11.206.73'
Malicious dependency on disk File path contains

node_modules/plain-crypto-js/ or */plain-crypto-js/setup.js

macOS RAT binary File path: /Library/Caches/com.apple.act.mond
Linux loader File path: /tmp/ld.py
Windows payload File path: %PROGRAMDATA%\wt.exe
Renamed PowerShell execution Lunar detection: RenamedBinExecution

Run hash hunts against consolidated IOC lists even if the global blocklist is already active. Historic hits help you quantify which systems were exposed and when.

Contain and Kill

For every system with confirmed Axios-related activity:

  • Mark the Storyline as Threat in the SentinelOne Console. Confirm that remediation commands (Kill + Quarantine) executed successfully.
  • Network-isolate the endpoint if the C2 connection succeeded (outbound to sfrclak[.]com or 142.11.206[.]73). Check for any secondary tooling or persistence beyond the initial RAT.
  • Block at the perimeter. Add the following to your firewall, proxy, and DNS blocklists:
    • Domain: sfrclak[.]com
    • IP: 142.11.206[.]73
    • Port: 8000
  • Check for persistence mechanisms:
    • Windows: Registry key “Microsoft Update” (used by the RAT for persistence), presence of 6202033.vbs or 6202033.ps1
    • macOS: Any process spawned from /Library/Caches/com.apple.act.mond, AppleScript execution from /var/folders/.../6202033
    • Linux: Active python3 processes running /tmp/ld.py, nohup wrappers

Credential Rotation and Dependency Cleanup

Assume every credential accessible from a confirmed-compromised endpoint is stolen. The RAT was built to harvest them.

Credential rotation checklist:

  • npm access tokens (revoke and reissue)
  • SSH keys (regenerate keypairs, update authorized_keys on all targets)
  • CI/CD pipeline secrets (GitHub Actions secrets, GitLab CI variables, Jenkins credentials)
  • Cloud provider keys (AWS access keys, GCP service account keys, Azure SPN secrets)
  • API keys and .env file contents
  • Git signing keys and code signing certificates if accessible from the endpoint

Dependency cleanup (all environments):

  • Pin Axios to known-good versions: axios@1.14.0 (1.x branch) or axios@0.30.3 (legacy branch)
  • Delete node_modules/plain-crypto-js/ wherever it exists
  • Run npm cache clean --force (or equivalent for Yarn/pnpm) on all affected build environments
  • Reinstall cleanly using npm ci --ignore-scripts during the cleanup period to prevent any other postinstall hooks from executing
  • Audit your package-lock.json / yarn.lock / pnpm-lock.yaml for any reference to plain-crypto-js. Its presence in a lockfile is a forensic indicator that the compromised version was resolved, even if the malware self-deleted.

Harden and Validate

Policy hardening:

  • Confirm Behavioral AI engine is set to Protect (On Execute), not Detect-only
  • Confirm Documents & Scripts engine is set to Protect (On Execute)
  • Review and remove any broad exclusions for node.exe, npm, yarn, python3, or developer IDEs
  • Verify LSU (Live Security Updates) is enabled. Customers on Fed/OnPrem environments without LSU access should confirm they are on the latest Service Pack
  • Confirm the SentinelOne agent is deployed on all developer workstations and CI/CD runners, not just production servers

Validation sweep:

  • Run a full disk scan on every endpoint that was in the blast radius
  • Verify no new users, services, or scheduled tasks were created during the exposure window
  • Confirm that network blocks for C2 infrastructure are active and logging hits
  • Re-run the Deep Visibility hunts from Hour 0-1 to verify no new activity has appeared

Key IOC Reference Card

Keep this card accessible for your team during the response.

Malicious packages:

Package SHA-1
axios@1.14.1 2553649f2322049666871cea80a5d0d6adc700ca
axios@0.30.4 d6f3f62fd3b9f5432f5782b62d8cfd5247d5ee71
plain-crypto-js@4.2.1 07d889e2dadce6f3910dcbc253317d28ca61c766

C2 infrastructure:

Indicator Value
Domain sfrclak[.]com
IP 142.11.206[.]73
Port 8000
URL pattern hxxp[://]sfrclak[.]com:8000/6202033
RAT User-Agent mozilla/4.0 (compatible; msie 8.0; windows nt 5.1; trident/4.0)

File artifacts by OS:

OS Artifact Path
macOS RAT binary /Library/Caches/com.apple.act.mond
macOS Temp script /var/folders/.../6202033
Windows Renamed PowerShell %PROGRAMDATA%\wt.exe
Windows Stage 1 system.bat
Windows Stage 2 6202033.ps1
Windows VBS launcher 6202033.vbs
Linux Python loader /tmp/ld.py

RAT beacon behavior: HTTP POST every 60 seconds, Base64-encoded JSON, two-layer obfuscation (reversed Base64 + XOR with key OrDeR_7077, constant 333). The IE8/Windows XP User-Agent string is anachronistic and serves as a strong network-level detection indicator.

SentinelLABS Expanded Indicators:

Indicator Value Note
Email nrwise@proton[.]me Involved in supply chain compromise.
Email ifstap@proton[.]me Involved in supply chain compromise.
Domain callnrwise[.]com Domain overlaps with email scheme and infrastructure design from confirmed C2 domain.
Domain focusrecruitment[.]careers Overlapping domain registration details and timeline. Medium Confidence
Domain chickencoinwin[.]website Overlapping domain registration details and timeline. Medium Confidence

The Structural Problem Is Bigger Than Axios

The progression from event-stream (2018, individual actor) to Shai-Hulud (2025, self-replicating worm across 500+ packages) to Axios (2026, DPRK state actor with multi-vendor attribution from SentinelOne, Google, and Microsoft) is not a series of isolated incidents. It is a clear escalation in adversary sophistication and strategic intent. North Korean threat actors stole $2.02 billion in cryptocurrency in 2025 alone, a 51% increase year-over-year, and the Axios RAT harvests exactly the credential types that feed that revenue pipeline.

Developer environments are now a Tier 1 attack surface. The organizations that treat them as anything less are operating with a structural blind spot that state-level adversaries have already mapped.

SentinelOne’s Autonomous Security Intelligence framework delivers what this moment requires: AI-native protection that detects and contains threats at machine speed, human expertise through Wayfinder MDR that translates alerts into confident action, and a unified platform that eliminates the fragmented visibility where supply chain attacks hide. When the next three-hour window opens, the question is whether your defense moves faster than the attacker. With SentinelOne, it does.

Disclaimer: All third-party product names, logos, and brands mentioned in this publication are the property of their respective owners and are for identification purposes only. Use of these names, logos, and brands does not imply affiliation, endorsement, sponsorship, or association with the third party.

Expose the AI & Cloud Secrets That Put Your Data & Systems at Risk
This report draws on 11K+ customer environments. It shows how AI and cloud adoption are increasing secrets exposure and putting data at risk.

How SentinelOne’s AI EDR Autonomously Discovered and Stopped Anthropic’s Claude from Executing a Zero Day Supply Chain Attack, Globally

Host-based Behavioral Autonomous AI Detection is by far the most effective way to generically see, and stop both Human and/or machine-speed AI Agent based rogue or malicious activities.

On March 24, 2026, SentinelOne’s autonomous detection caught what manual workflows never could have: a trojaned version of LiteLLM, one of the most widely used proxy layers for LLM API calls, executing malicious Python across multiple customer environments. The package had been compromised hours earlier. No analyst wrote a query. No SOC team triaged an alert. The Singularity Platform identified and blocked the payload before it could run, across every affected environment, on the same day the attack was launched.

The LiteLLM supply chain compromise is not an anomaly. It is the new pattern: multi-stage, multi-surface, designed to evade manual workflows at every turn. A compromised security tool led to a compromised AI package, which led to data theft, persistence, Kubernetes lateral movement, and encrypted exfiltration, all within a window measured in hours.

SentinelOne detected and blocked this attack autonomously, on the same day it was launched, across multiple customer environments. No manual triage. No signature update. No analyst in the loop for the initial containment. This is what autonomous, AI-native defense looks like when it meets a real-world threat at machine speed.

The gap between the velocity of this attack and the capacity of human-driven investigation is the gap where organizations get compromised. Closing that gap is not a feature request. It is an architectural decision. This is what happens when AI infrastructure gets targeted by a multi-stage supply chain campaign, and what it looks like when autonomous, AI-native defense is already in position.

Here is what we detected, how the attack was structured, and why this is the class of threat that the Singularity Platform was built to stop.

Autonomous Detection at Machine Speed

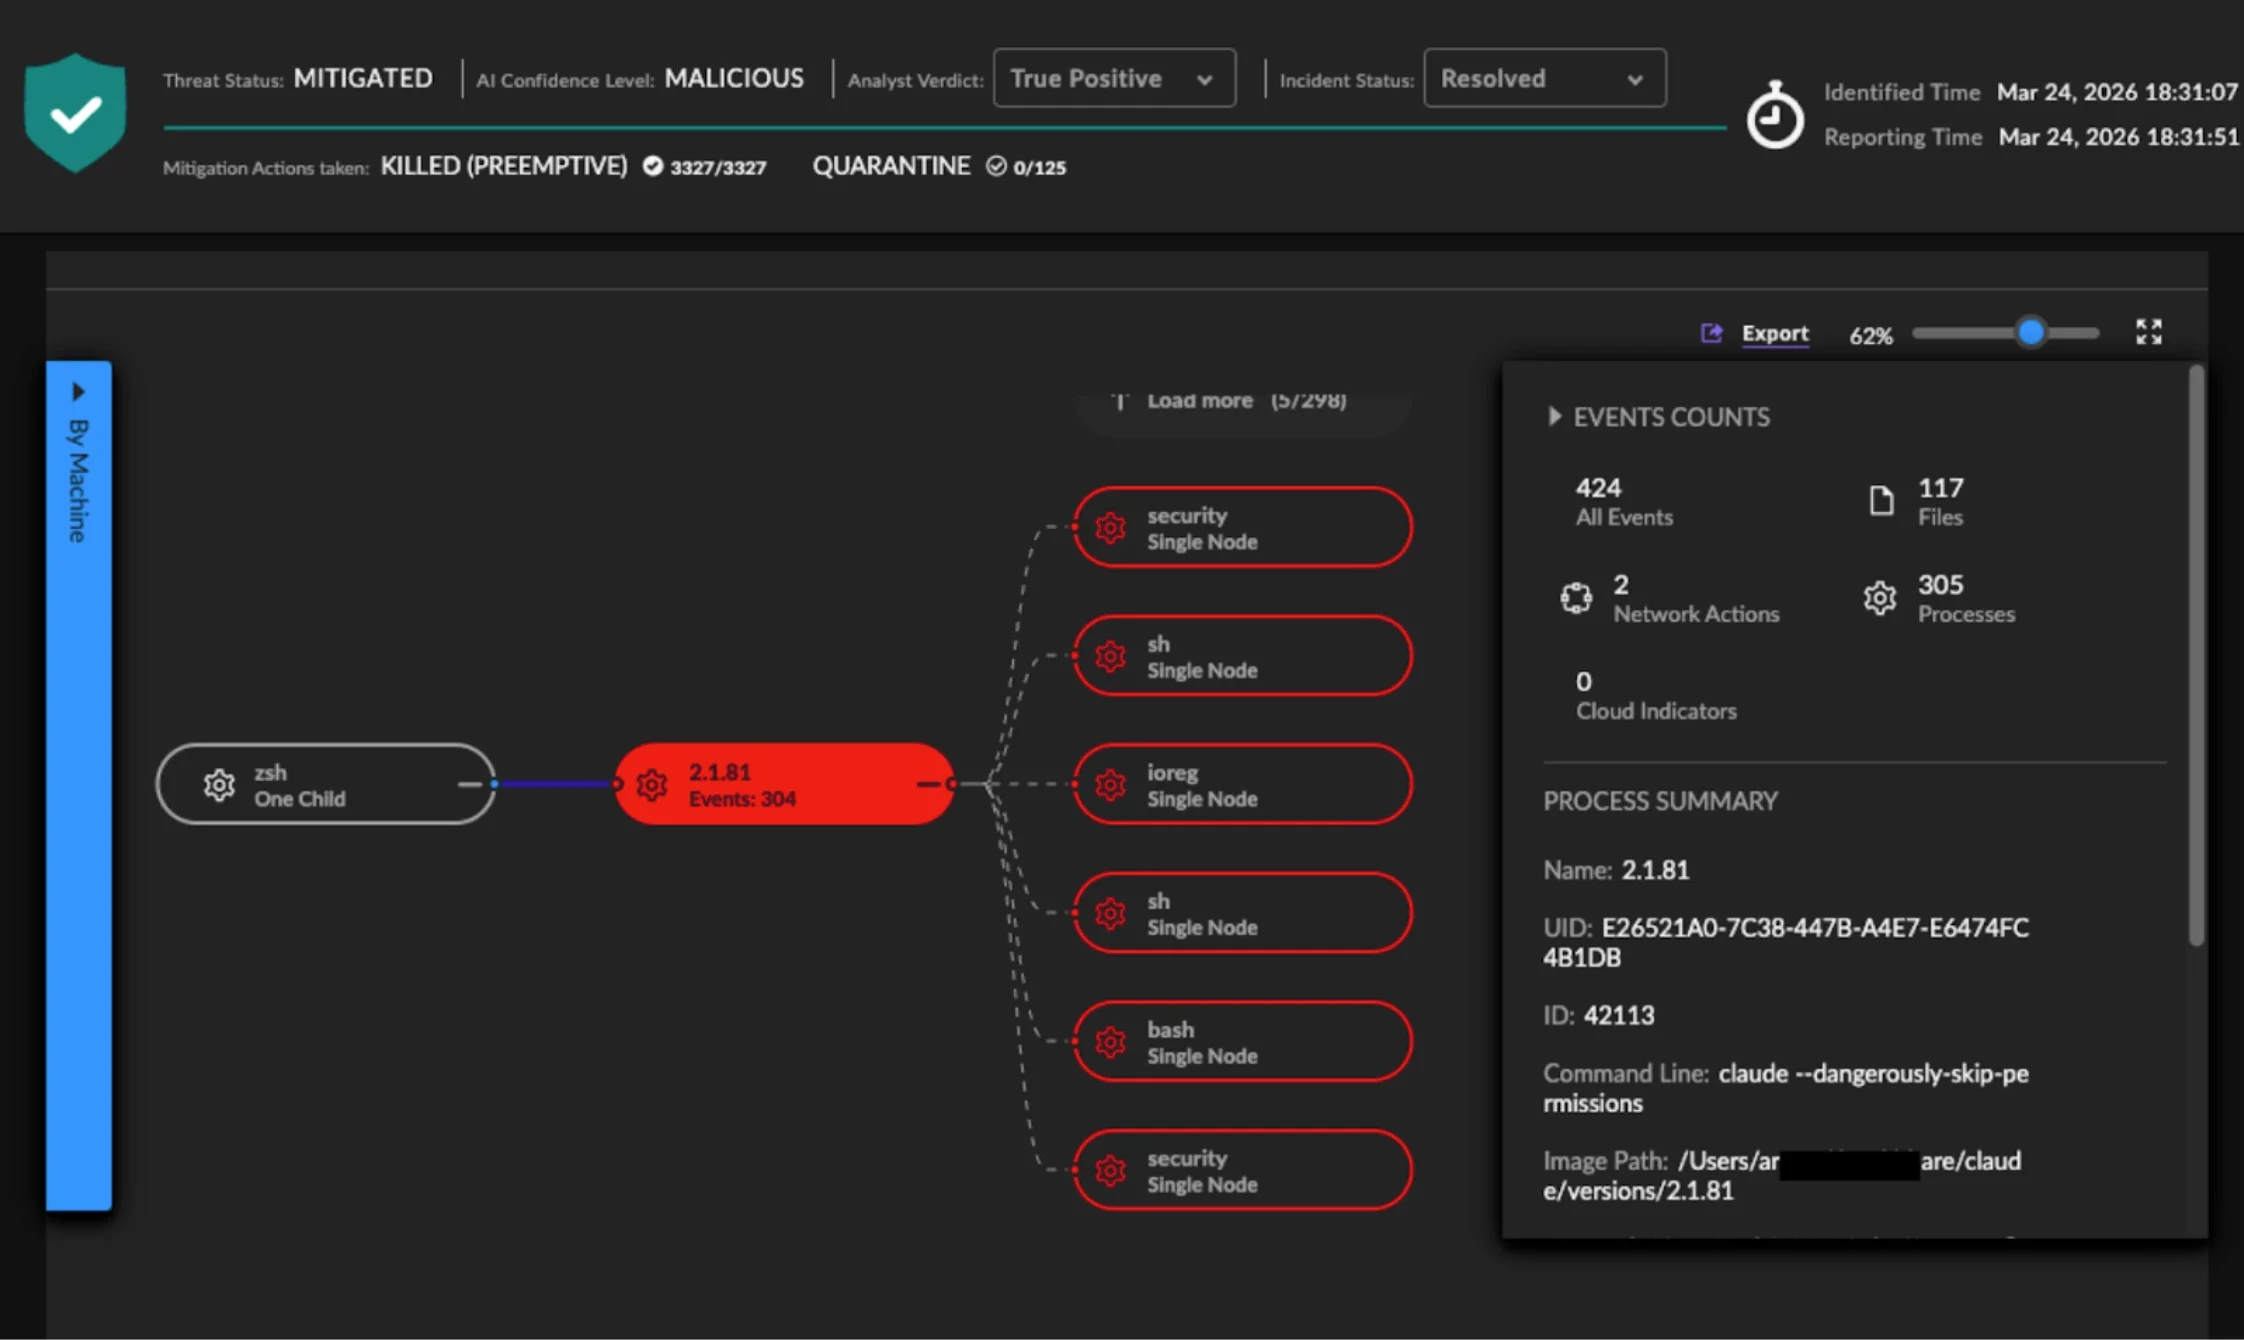
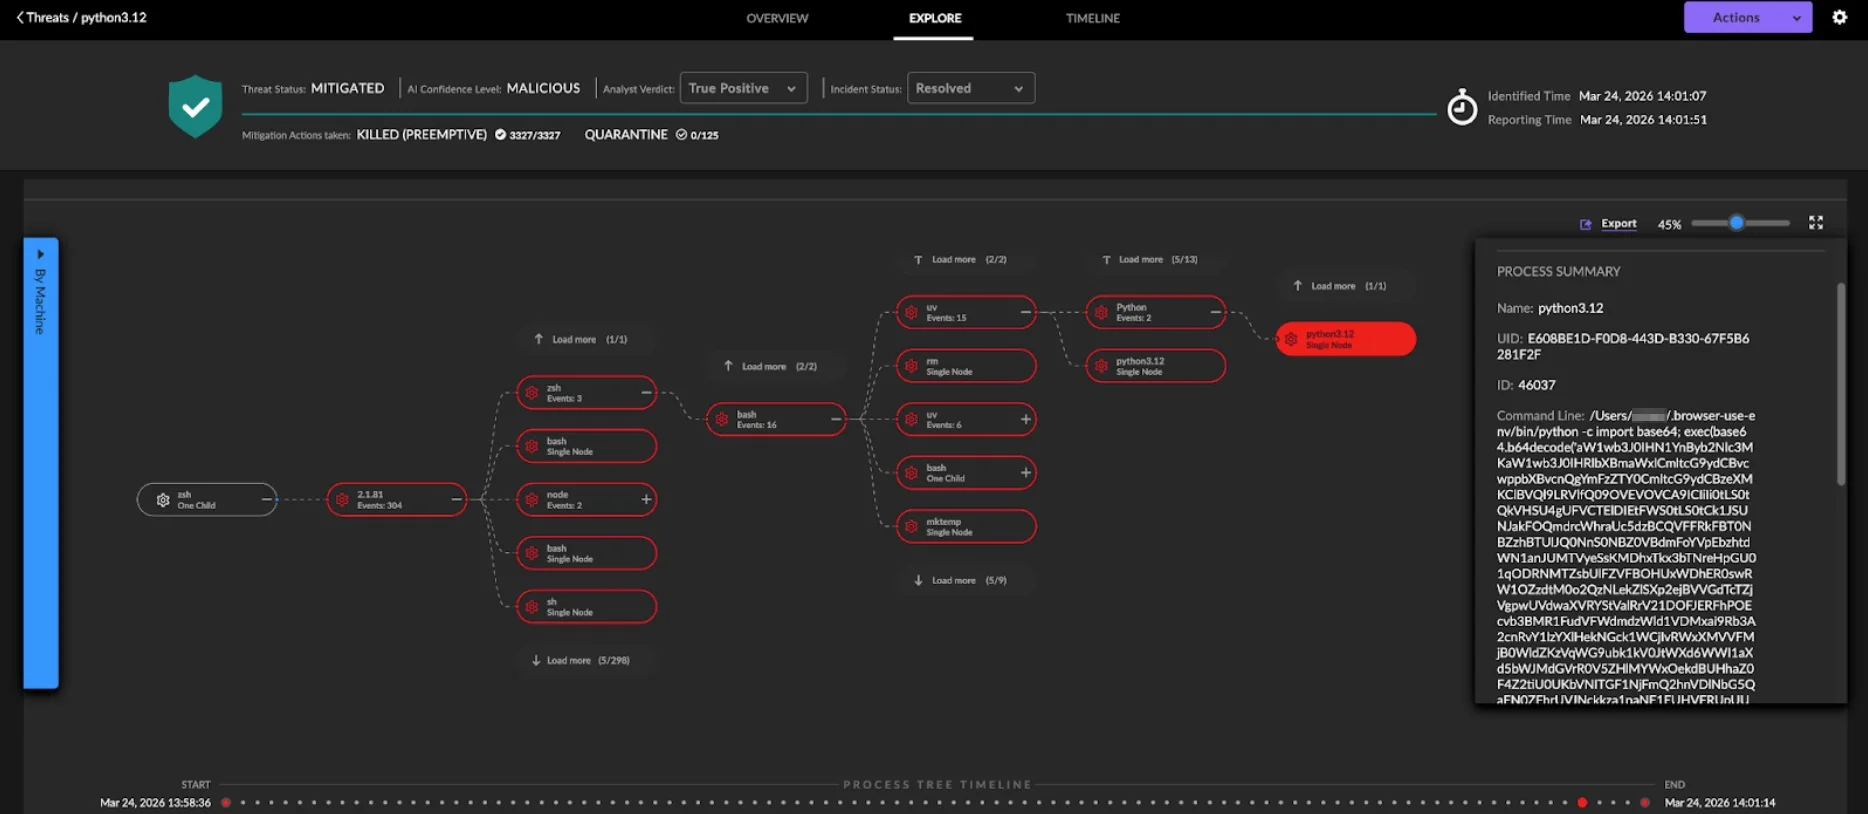
SentinelOne’s macOS agent identified and preemptively killed a malicious process chain originating from Anthropic’s Claude Code running with unrestricted permissions (claude --dangerously-skip-permissions). No human developer ran pip install, an autonomous AI coding assistant updated LiteLLM to the compromised version as part of its normal workflow.

The AI engine classified the behavior as MALICIOUS and took immediate action: KILLED (PREEMPTIVE) across 424 related events in under 44 seconds. The agent didn’t need to know the package was compromised, it watched what the process did and stopped it based on behavior, regardless of what initiated the install.

Catching the Payload in the Act

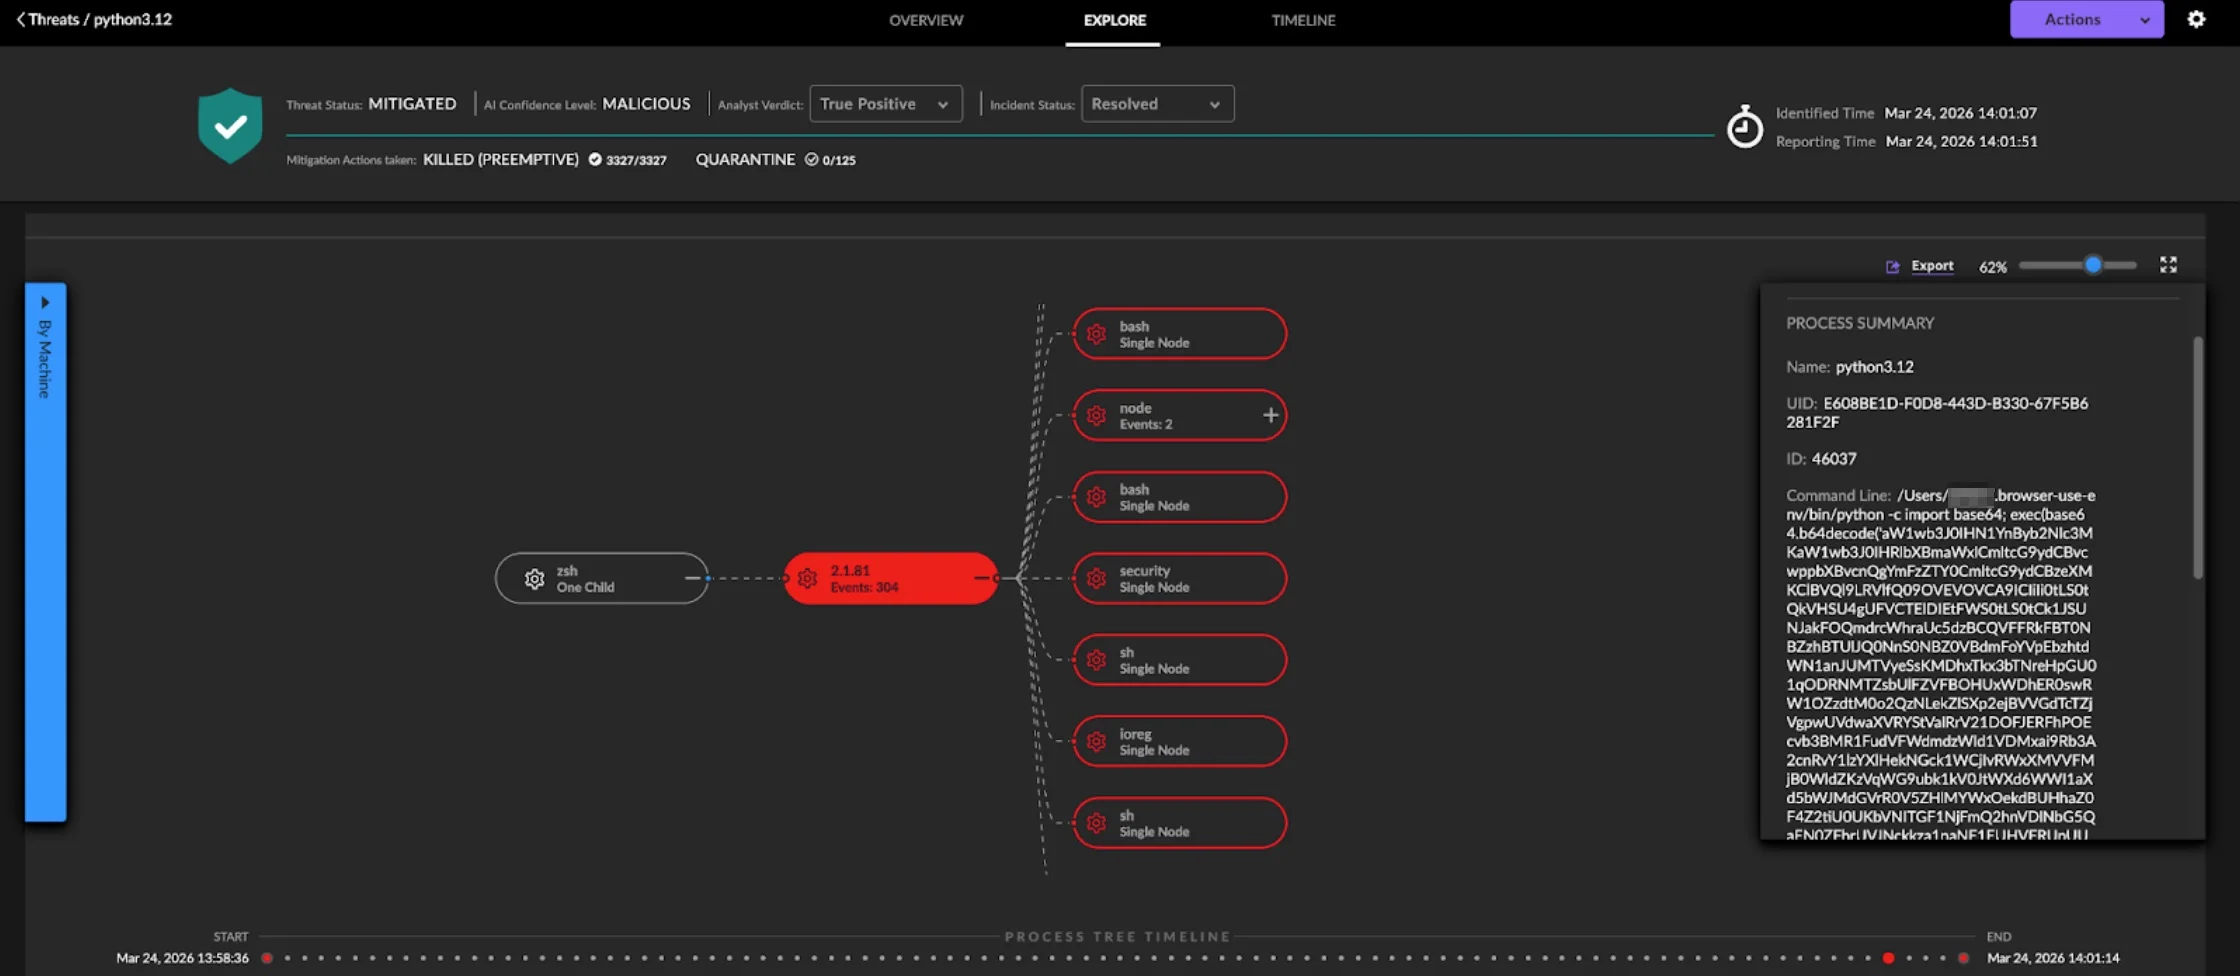
The macOS agent caught the trojaned LiteLLM package mid-execution. The process summary tells the story: python3.12 launching with a command line containing import base64; exec(base64.b64decode(... , the exact bootstrap mechanism described in the attack’s first stage, decoding and executing the obfuscated payload in a child process.

The agent didn’t need a signature for this specific package. It recognized the behavioral pattern, a Python interpreter executing base64-decoded code in a spawned subprocess, classified it as MALICIOUS, and killed it preemptively before the stealer, persistence, or lateral movement stages could deploy.

The Full Process Tree: Containing the Blast Radius

Zooming out on the same detection reveals the full scope of what the autonomous AI agent was doing when the payload fired. The process tree expands from Claude Code (2.1.81) into a sprawling chain: zsh, bash, node, uv, ssh, rm, python3.12, mktemp, with hundreds of child events still loadable (304 events captured). This is what unrestricted AI agent activity looks like at the endpoint level: a single command spawning an entire dependency management workflow that pulled, installed, and attempted to execute the trojaned package.

The SentinelOne macOS agent traced every branch of this tree, correlated the events back to the root cause, and killed the malicious execution; all while preserving the full forensic record for investigation.

The Compromise Was Indirect. That’s What Makes It Dangerous.

The attacker, operating under the alias TeamPCP, never attacked LiteLLM directly. They first compromised Trivy, a widely trusted open-source security scanner, on March 19. From there, they obtained the LiteLLM maintainer’s PyPI credentials and used them to publish two malicious versions: 1.82.7 and 1.82.8.

A security tool, built to find vulnerabilities, became the vector that enabled the compromise of an AI infrastructure package used by thousands of organizations. The same actor went on to compromise Checkmarx KICS and AST on March 23, and Telnyx on March 27. This was not a smash-and-grab. It was a coordinated campaign that exploited the transitive trust woven through open-source supply chains.

For security leaders asking, “Could this have reached us?” the more pressing question is: “How fast could we have answered that?”

A New Attack Surface: AI Agents With Unrestricted Permissions

In one customer environment, SentinelOne detected the infection arriving through an unexpected vector: an AI coding assistant running with unrestricted system permissions autonomously updated LiteLLM to the trojaned version without human review. The update pulled the infected package, and the payload attempted to execute. Our agent blocked it.

This is a new class of attack surface that most organizations have not yet scoped. AI coding agents operating with full system permissions can become unwitting vectors for supply chain compromises. The speed and automation that make these tools valuable are the same properties that make them dangerous when the packages they pull have been weaponized. Organizations that have not yet established governance policies for AI assistant permissions are carrying risks they cannot see.

SentinelOne’s behavioral detection operates below the application layer. It does not matter whether a malicious package is installed by a human, a CI pipeline, or an AI agent. The platform monitors process behavior via the Endpoint Security Framework, which is why this detection fired regardless of how the infected package arrived.

Two Infection Vectors, One Designed to Run Without You

Version 1.82.7 embedded its payload in proxy_server.py, which executes every time the litellm.proxy module is imported. For anyone using LiteLLM as a proxy layer for LLM API calls, this fires constantly during normal operations.

Version 1.82.8 escalated. The attacker placed the payload in a .pth file, litellm_init.pth. Files with the .pth extension are processed by the Python interpreter at startup, regardless of which modules are imported. Any Python script running on a system with this version installed would trigger the malicious code, even if that script had nothing to do with LiteLLM.

If version 1.82.7 was a targeted shot, version 1.82.8 was a blast radius expansion. The attacker removed the requirement that the victim actually use the compromised library.

What the Payload Did Once Inside

The attack was structured as a multi-stage delivery system, each stage decoding, decrypting, and executing the next. The first stage was a minimal bootstrap, a single line of base64-decoded Python launched in a detached subprocess with stdout and stderr suppressed. Lightweight enough to slip past signature-based tools. Quiet enough to avoid raising flags.

The second stage was a comprehensive data stealer. It harvested system and user information, cryptocurrency wallets, cloud credentials, application secrets, and system configurations. For practitioners wondering what the blast radius looks like if a developer workstation is compromised, this is the answer: the attacker collects everything needed to move from a laptop to production infrastructure.

The third stage established persistence through a systemd user service at ~/.config/systemd/user/sysmon.service, executing a script at ~/.config/sysmon/sysmon.py. The naming convention, “sysmon,” was deliberately chosen to mimic legitimate system monitoring tools. It is designed to survive casual inspection and blend into environments where dozens of services run as expected background noise. This is precisely the kind of evasion that signature-based detection misses and behavioral AI catches: the process looks normal until you observe what it actually does.

The persistence mechanism included a 5-minute initial delay before any network activity, a technique specifically designed to outlast automated sandbox analysis. After that, the script contacted its C2 server every 50 minutes, fetching dynamic payload URLs. This sparse communication pattern makes behavioral detection through network monitoring significantly harder, and gives the attacker the ability to push new tooling without ever re-compromising the target.

It Moved Laterally Through Kubernetes

The attack did not stop at the workstation. It created privileged pods across Kubernetes cluster nodes in the kube-system namespace, using standard container images like alpine:latest, with hostPID, hostNetwork, and a privileged security context. By mounting the host filesystem directly, these pods gained root-level access to underlying nodes.

Each pod deployed persistent backdoors as systemd services on the host system. The pods operated in legitimate namespaces, used standard images, and ran with privileges that many production workloads legitimately require. For SOC practitioners asking whether their admission control and runtime detection would have caught this: the attack was designed specifically so they might not. Detecting this requires runtime visibility into container behavior after deployment, not just policy enforcement at the admission gate. This is the difference between cloud security that checks configuration and cloud security that watches execution.

Exfiltration Was Encrypted and Camouflaged

Stolen data was encrypted using a hybrid RSA and AES-256-CBC scheme. A random 32-byte AES session key encrypted the data, then the session key itself was protected with RSA encryption using a hardcoded public key. This meant the malware could encrypt and exfiltrate without first communicating with the C2 server. The encrypted payload was packaged as tpcp.tar.gz and transmitted via a single HTTP POST to models.litellm.cloud, a domain chosen to blend with legitimate LiteLLM API traffic and slip past network monitoring that whitelists expected destinations.

What This Attack Proves

The LiteLLM supply chain compromise is not an anomaly. It is the new pattern: multi-stage, multi-surface, designed to evade manual workflows at every turn. A compromised security tool led to a compromised AI package, which led to data theft, persistence, Kubernetes lateral movement, and encrypted exfiltration, all within a window measured in hours.

SentinelOne detected and blocked this attack autonomously, on the same day it was launched, across multiple customer environments. No manual triage. No signature update. No analyst in the loop for the initial containment. This is what autonomous, AI-native defense looks like when it meets a real-world threat at machine speed.

The gap between the velocity of this attack and the capacity of human-driven investigation is the gap where organizations get compromised. Closing that gap is not a feature request. It is an architectural decision.

Why This Detection Worked: Architecture, Not Luck

The LiteLLM detection wasn’t a one-off. It’s what happens when autonomous, behavioral AI is built into the foundation, not bolted on after the fact. The Singularity Platform’s visibility across endpoint, cloud, identity, and AI workloads is why the agent saw this regardless of whether the install came from a human, a CI pipeline, or an AI coding assistant.

For teams that need the human expertise layer on top, Wayfinder MDR extends that autonomous detection with 24/7 investigation and response, closing the gap between detection and resolution.

This is the Autonomous Security Intelligence (ASI) framework in practice: AI that acts at machine speed, backed by human expertise when it matters, across every surface the attack can reach. See how the Singularity Platform protects AI infrastructure and request a demo today.

Protect Your Endpoint
See how AI-powered endpoint security from SentinelOne can help you prevent, detect, and respond to cyber threats in real time.

Telemetry Pipeline: How It Works and Why It Matters in 2026

Delemetry Data Pipeline

A telemetry pipeline has become a core layer in modern security operations because teams no longer send data from applications, infrastructure, and cloud services straight into a single backend and hope for the best. In 2026, most environments are distributed across cloud, hybrid, and on-prem systems, which means more services, more data sources, more formats, and more operational complexity for teams that already struggle to keep visibility, control costs, and respond quickly. 

Splunk’s State of Security 2025 found that 46% of security professionals spend more time maintaining tools than defending the organization. Cisco’s research adds that 59% deal with too many alerts, 55% face too many false positives, and 57% lose valuable investigation time because of gaps in data management. When too much raw telemetry flows into the stack without filtering, enrichment, or routing, the result is higher bills, slower investigations, and more noise for already stretched teams.

That is why telemetry pipelines are gaining momentum. They give organizations a control layer to normalize, enrich, route, and govern telemetry before it reaches SIEM, observability, or storage platforms. What began primarily as a way to control volume and cost is quickly becoming a must for modern security operations. Gartner suggests that by 2027, 40% of all log data will be processed through telemetry pipeline products, up from less than 20% in 2024.

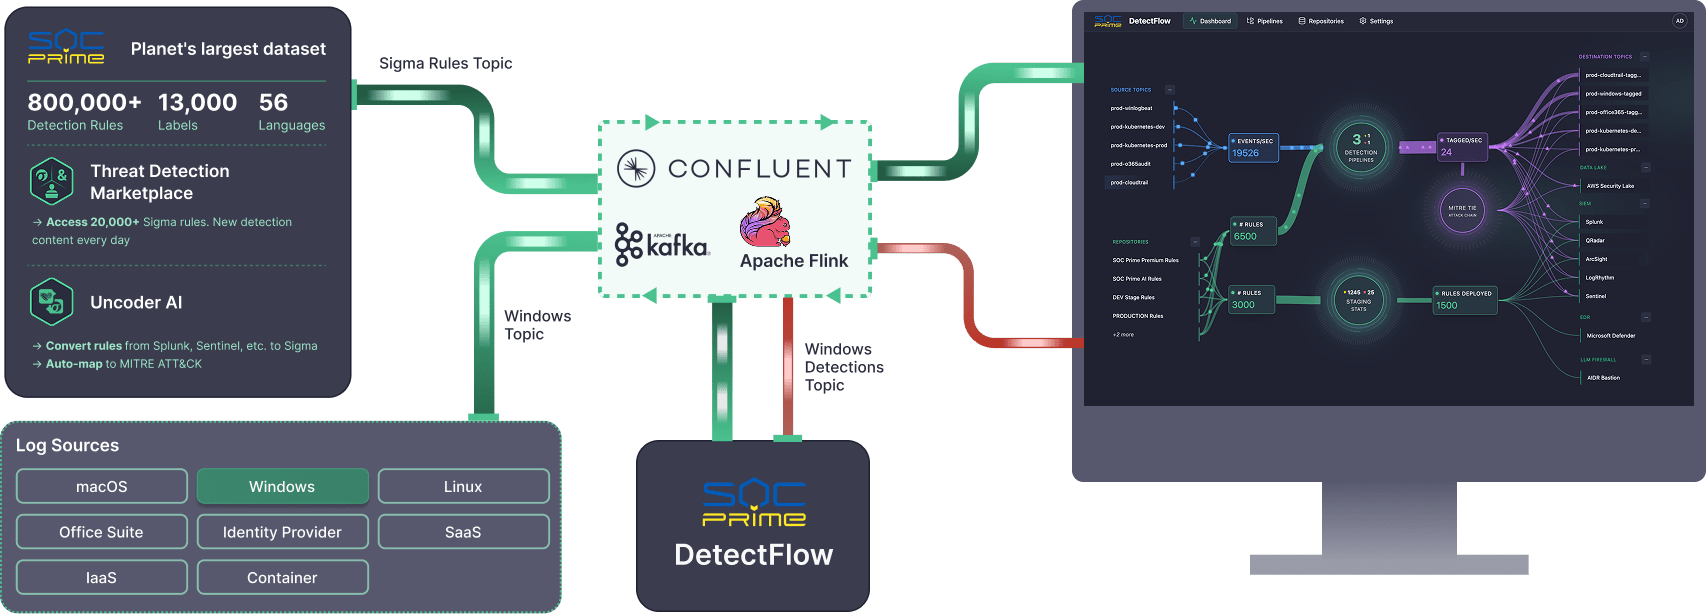
As that model matures, the next logical step is not just to manage telemetry better, but to make it useful earlier. If teams are already adding a pipeline to reduce noise, control spend, and improve routing, it makes sense to move part of the detection process closer to the stream itself rather than waiting for every event to land in downstream tools first. Solutions like SOC Prime’s DetectFlow act as an additional detection layer running directly on the stream. Instead of using the pipeline only for transport and optimization, DetectFlow applies tens of thousands of Sigma rules on live Kafka streams with Apache Flink, tags and enriches events in flight, and helps teams act on higher-value signals much earlier in the flow.

What Is Telemetry?

Before talking about telemetry pipelines, it is important to define telemetry itself.

Telemetry is the evidence systems leave behind while they run. It shows how applications, infrastructure, and services behave in real time, including performance, failures, usage, and health. 

For enterprises, that evidence is valuable because it shows what users are actually experiencing, where bottlenecks form, when failures begin, and where suspicious activity starts to flicker. For security teams, telemetry is even more important because it becomes the raw material for detection, investigation, hunting, and response.

Put differently, telemetry is the trail of digital footprints your environment leaves behind. Useful on its own, but much more powerful when it is organized before the tracks disappear into the mud.

What Are the Main Types of Telemetry Data?

Most teams work with four main telemetry categories grouped under the MELT model: Metrics, Events, Logs, and Traces.

Metrics

Metrics are numerical measurements collected over time, such as CPU usage, memory consumption, latency, throughput, request volume, and error rate. They help teams track system health, identify trends, and spot anomalies before they become visible outages.

Events

Events capture notable actions or state changes inside a system. They usually mark something important that happened, such as a user login, a deployment, a configuration update, a purchase, or a failover. Events are especially useful because they often connect technical activity to business activity.

Logs

Logs are timestamped records of discrete activity inside an application, system, or service. They provide detailed evidence about what happened, when it happened, and often who or what triggered it. Logs are essential for debugging, troubleshooting, auditing, and security investigations.

Traces

Traces show the end-to-end path of a request as it moves across different services and components. They help teams understand how systems interact, how long each step takes, and where delays or failures occur. Traces are especially valuable in distributed systems and microservices environments.

Some platforms also break telemetry into more specific categories, such as requests, dependencies, exceptions, and availability signals. These help teams understand incoming operations, external service calls, failures, and uptime. 

Telemetry Data Pros and Cons

Telemetry data can be one of the most valuable assets in modern operations, but only when it is managed with purpose. Done well, it gives teams a real-time view of how systems behave, how users interact with services, and where risks or inefficiencies begin to form. Done poorly, it becomes just another stream of noisy, expensive data.

Telemetry Data Benefits

The biggest advantage of telemetry is visibility. By collecting and analyzing metrics, logs, traces, and events, teams can see what is happening across applications, infrastructure, and services in real time.

Key benefits include:

  • Real-time visibility into system health, performance, and user activity
  • Proactive issue detection by spotting anomalies before they turn into outages or incidents
  • Improved operational efficiency through automated monitoring and faster workflows
  • Faster troubleshooting by giving teams the context needed to identify root causes quickly
  • Better decision-making through data-backed insights for product, operations, and security teams

To get the full value, telemetry needs to be consolidated and handled consistently. A unified telemetry layer helps reduce mess across tools, improves scalability, and makes data easier to analyze and act on.

Telemetry Data Challenges

Telemetry also comes with real challenges, especially as data volumes grow. The most common ones include:

  • Security and privacy risks when sensitive data is collected or stored without strong controls
  • Legacy system integration across different formats, sources, and older technologies
  • Rising storage and ingestion costs when too much low-value data is kept in expensive platforms
  • Tool fragmentation makes correlation and investigation harder
  • Interoperability issues when systems do not follow consistent standards or schemas

This is exactly why telemetry strategy matters. The goal is not to collect more data for the sake of it, but to collect the right data, shape it early, and route it where it creates the most value. In cybersecurity, that difference is critical. The right telemetry can speed up detection and response, while unmanaged telemetry can bury important signals under cost and noise.

How to Analyze Telemetry Data 

The best way to analyze telemetry data is to stop treating analysis as the last step. In practice, good analysis starts much earlier, with clear goals, structured collection, smart routing, and storage policies that keep useful data accessible without flooding downstream tools. 

Define Goals

Start with the question behind the data. Are you trying to improve performance, reduce MTTR, monitor customer experience, detect security threats, or control SIEM costs? Once that is clear, decide which signals matter most and which KPIs will show progress. For a product team, that may be latency and error rate. For a SOC, it may be detection coverage, false positives, and investigation speed. This is also the stage to set privacy and compliance boundaries so teams know what data should be collected, masked, or excluded from the start. 

Configure Collection

Once goals are clear, configure the tools that will collect the right telemetry from the right places. That usually means deciding which applications, hosts, cloud services, APIs, endpoints, and identity systems should send logs, metrics, traces, and events. It also means setting practical rules for sampling, field selection, filtering, and schema consistency.

Shape and Route the Data 

Before data reaches SIEM, observability, or storage platforms, it should be shaped to fit the goal. That can mean normalizing records into consistent schemas, enriching events with identity or asset context, filtering noisy data, redacting sensitive fields, and routing each signal to the destination where it creates the most value.

Store Data With Intent

Not all telemetry needs the same retention period, storage tier, or query speed. High-value operational and security data may need to stay hot for rapid search and alerting, while bulk historical data can move to cheaper long-term storage. The key is to align retention with investigation needs, compliance obligations, and cost tolerance. 

Analyze, Alert, and Refine

Only after that foundation is in place does analysis become truly useful. Dashboards, alerts, anomaly detection, and visualizations work much better when the underlying telemetry is already clean, consistent, and routed with purpose. Machine learning and AI can make this process more effective by helping teams spot unusual patterns, detect anomalies faster, and identify changes that may be easy to miss in high-volume environments.

That is especially important in security operations, where the real challenge is turning telemetry into better decisions with less noise. This is exactly why a pipeline-based approach becomes so valuable. When telemetry is already being normalized, enriched, and routed upstream, analysis can start earlier, before raw events pile up in costly SIEM platforms.

Solutions like DetectFlow placе detection logic, threat correlation, and Agentic AI capabilities directly in the pipeline. At the pre-SIEM stage, DetectFlow can correlate events across log sources from multiple systems, while Flink Agent and AI help surface the attack chains that matter in real time and reduce false positives. In practice, that means teams can move detection left and deliver cleaner, richer, and more actionable signals downstream.

Telemetry and Monitoring: Main Difference

Telemetry and monitoring are closely related, but they are not the same thing. Telemetry is the process of collecting and transmitting data from systems and applications. It captures raw signals such as metrics, logs, traces, and events, then sends them to a central place for analysis. Monitoring is what teams do with that data to understand system health, performance, and availability. It turns telemetry into dashboards, alerts, and reports that help people act on what they see.

The difference matters because many organizations still build their strategy around dashboards and alerts alone. Monitoring is important, but it is only one use of telemetry. Security teams also rely on telemetry for investigation, hunting, root-cause analysis, and detection engineering. In other words, telemetry is the foundation, while monitoring is one of the ways that foundation is used.

In fact, telemetry is like the nervous system, constantly gathering signals from every part of the body. Monitoring is like the brain, interpreting those signals and deciding what needs attention. Telemetry feeds monitoring. Without telemetry, there is nothing to monitor. Without monitoring, telemetry remains a raw signal with no clear action attached.

What Is a Telemetry Pipeline?

A telemetry pipeline is the operating layer between telemetry sources and telemetry destinations. It collects signals from applications, hosts, cloud platforms, APIs, identity systems, endpoints, and networks, then processes that data before sending it onward.

The easiest way to think about it is that telemetry sources produce data, but the pipeline gives that data direction. Without a pipeline, downstream tools become catch-all warehouses. With a pipeline, telemetry can be standardized, routed by value, and governed according to policy. That is especially important for security operations, where one class of data may need real-time detection while another belongs in lower-cost retention or long-term investigation storage.

From a business perspective, the value is straightforward:

  • Lower cost by reducing unnecessary downstream ingestion
  • Better signal quality through normalization and enrichment
  • Less analyst fatigue by cutting noisy, low-value events earlier
  • More flexibility to send each data type where it creates the most value
  • Stronger governance through filtering, redaction, and policy-based routing


How Does the Telemetry Pipeline Work?

At a high level, a telemetry pipeline works through three core stages: ingest, process, and route. Together, these stages turn raw telemetry from many sources into clean, useful data to act on.

Ingest

The first stage is ingestion. This is where the pipeline collects telemetry from across the environment: applications, cloud services, containers, endpoints, identity systems, network tools, and infrastructure components. In modern environments, this stage must handle multiple signal types at once, including logs, metrics, traces, and events, often arriving at very different volumes and speeds.

Process

The second stage is processing, and this is where most of the value is created. Data is cleaned, normalized, enriched, filtered, and optimized before it reaches downstream systems. That can include removing duplicates, standardizing schemas, enriching records with identity or threat context, redacting sensitive fields, or reducing noisy data that creates cost without adding much value.

This is also where optimization and governance come in. Instead of treating all telemetry as equally important, teams can shape data according to business and security priorities. High-value signals can be enriched and preserved. Low-value records can be reduced, tiered, or dropped. Sensitive information can be handled according to the compliance policy. In other words, processing is where the pipeline stops being a transport mechanism and becomes a control mechanism. 

Route

The final stage is routing. Once telemetry has been shaped, the pipeline sends it to the right destinations. Security-relevant events may go to a SIEM or an in-stream detection layer. Operational metrics may go to observability tooling. Bulk logs may go to lower-cost storage. Archived data may be retained for compliance or long-term investigation. The point is that the same data no longer has to go everywhere in the same form.

By integrating collection, processing, and routing into one flow, a telemetry pipeline turns data from a flood into a controlled stream. It does not just move telemetry. It makes telemetry usable.

What Kind of Companies Need Telemetry Data Pipelines?

Any company running modern digital systems needs telemetry. The real difference is how urgently it needs to manage that telemetry well. Telemetry pipelines become especially important when blind spots are expensive, which usually means complex infrastructure, regulated data, customer-facing services, or constant security pressure. AWS’s observability guidance is explicitly built for cloud, hybrid, and on-prem environments, which already describes most enterprise estates.

That need shows up across many industries. Technology and SaaS companies rely on telemetry pipelines to protect uptime and customer experience. Financial institutions use them to monitor transactions, improve fraud detection, and keep audit data under control. Healthcare organizations use them to balance reliability with privacy and compliance. Retailers, telecom providers, manufacturers, logistics firms, and public-sector agencies need them because scale and continuity leave very little room for guesswork.

For security teams, the case is even sharper. Telemetry becomes the evidence layer behind detection, triage, investigation, and response. That is why the better question is no longer whether a company needs telemetry, but whether it is still treating telemetry like raw exhaust, or finally managing it like the strategic asset it has become.

How SOC Prime Turns Telemetry Pipelines Into Detection Pipelines

Telemetry pipelines started as a smarter way to move, shape, and control data before it reached expensive downstream platforms. SOC Prime extends that idea further with DetectFlow, which turns the pipeline into an active detection layer instead of using it only for transport and optimization. 

DetectFlow can run tens of thousands of Sigma detections on live Kafka streams, chain detections at line speed, drastically reduce the volume of potential alerts, and surface attack chains that are then further correlated and pre-triaged by Agentic AI before they hit the SIEM. It also brings real-time visibility, in-flight tagging and enrichment, and ensures infrastructure scalability that goes beyond traditional SIEM limits. That moves detection left, closer to the data, earlier in the flow, and far less dependent on costly downstream solutions.

For cybersecurity teams, that is the larger takeaway. Telemetry pipelines are not just an observability upgrade or a cost-control tactic. They are becoming a core part of modern cyber defense. And when detection logic, correlation, and AI move into the pipeline itself, telemetry stops being just something teams store and search later, instead acting on it in real time.


The post Telemetry Pipeline: How It Works and Why It Matters in 2026 appeared first on SOC Prime.

Observability Pipeline: Managing Telemetry at Scale

Observability began as a visibility problem. Yet, today it is framed just as much as a control challenge because teams have to manage the floods of telemetry moving daily through the business environment. Most organizations already collect large volumes of logs, metrics, events, and traces. The issue now lies in managing tons of that data before it reaches expensive downstream tools. Gartner defines observability platforms as systems that ingest telemetry to help teams understand the health, performance, and behavior of applications, services, and infrastructure. That matters because when systems slow down or fail, the impact reaches far beyond the technical side, affecting revenue, customer sentiment, and brand perception.

This creates a familiar paradox. Complex environments require broad telemetry coverage, yet large data volumes can quickly become expensive and difficult to manage. When every signal is forwarded by default, useful insight gets mixed with duplication, low-value data, and rising storage and processing costs. Gartner reports observability spend rising around 20% year over year, with many organizations already spending more than $800,000 annually. The trend shows that by 2028, 80% of enterprises without observability cost controls will overspend by more than 50%.

The pressure is pushing teams to look for more control earlier in the flow. Observability pipelines answer that need by giving teams a practical way to filter, enrich, transform, and route data before it turns into noise, waste, and operational drag downstream.

The same logic is starting to shape cybersecurity operations as well. This is where tools like SOC Prime’s DetectFlow enter the picture. DetectFlow moves the detection layer directly into the pipeline, enabling SOC teams to run tens of thousands of Sigma rules to live Kafka streams using Apache Flink, tagging, enriching, and chaining events at the pre-SIEM stage to scale without the usual vendor caps on speed, capacity, or cost.

What Is an Observability Pipeline?

An observability pipeline is the solution that moves telemetry from sources to destinations while performing tasks like transformation, enrichment, and aggregation. Specifically, it takes in logs, metrics, traces, and events, then prepares that data before it reaches monitoring platforms, SIEMs, data lakes, or long-term storage. Along the way, observability pipelines can filter noisy data, enrich records with context, aggregate high-volume streams, secure sensitive fields, and route each data type to the destination where it makes the most sense.

This becomes important as telemetry grows across microservices, containers, cloud services, and distributed systems. Without a pipeline, teams often forward everything by default, which increases cost, adds noise, and makes data handling harder to manage across multiple tools and environments.

Observability pipelines help solve several common challenges:

  • Data overload. High telemetry volume makes it harder to separate useful signals from low-value data, especially when logs, metrics, and traces arrive from many different systems at once.
  • Rising storage and processing costs. Sending all data to downstream platforms drives up ingest, indexing, and retention costs, even when much of that data adds little value.
  • Noisy data. Duplicate, low-priority, or low-context telemetry can overwhelm the signals that actually matter for troubleshooting, security, and performance analysis.
  • Compliance & security risks. Logs and telemetry streams may contain personal or regulated data, which increases compliance and privacy risks when it is forwarded or stored without proper masking or redaction.
  • Complex Infrastructure. Teams often need to send different data sets to different destinations, such as monitoring tools, SIEMs, and lower-cost storage, which becomes difficult to manage without a central control plane.
  • Migration and vendor flexibility. Pipelines make it easier to reshape and reroute telemetry for new tools or parallel destinations without rebuilding collection from scratch.

In simple terms, an observability pipeline gives teams more control over telemetry. It helps organizations keep the useful signals, improve context, and send each stream where it fits.

How Observability Pipelines Work

At a practical level, observability pipelines create a single flow for handling telemetry data. Instead of managing multiple handoffs between sources and destinations, teams can work through one control layer that prepares data for different operational and security use cases.

Collect

The first step is gathering data from across the organizational environment. That can include application logs, infrastructure metrics, cloud events, container data, and security records. Bringing those inputs into one pipeline gives teams a more consistent starting point and reduces the need for separate connections between every source and every tool.

Process

Once data enters the pipeline, it can be adjusted to match the needs of the business. Teams may standardize formats, enrich records with metadata, remove duplicate events, mask sensitive fields, or reduce unnecessary detail. This step helps make the data more usable, whether the goal is troubleshooting, compliance, long-term retention, or security analysis.

Route

After processing, the pipeline sends data to the right destination. High-priority records may go to a monitoring platform or SIEM for immediate visibility, while other data can be archived, stored in a data lake, or routed to lower-cost storage. This makes it easier to support different teams without forcing every system to handle the same data in the same way.

Benefits of Using Observability Pipeline

An observability pipeline helps teams to manage growing telemetry volumes, improve data quality, and control how information is used across operations and security. As environments become more distributed, that kind of control matters more for cost, performance, and faster decision-making.

Some of the main benefits include:

  • Lower storage and processing costs. An observability pipeline helps reduce unnecessary spend by filtering low-value events, deduplicating records, and sending only the right data to high-cost platforms. This keeps teams from paying top price for data that adds little value.
  • Better signal quality. When noisy or incomplete telemetry is cleaned up earlier, the data that reaches downstream tools becomes easier to search, analyze, and act on. That helps teams focus on what actually matters instead of sorting through clutter.
  • Faster troubleshooting and investigations. Better-prepared data speeds up incident response. Operations teams can identify performance issues faster, while security teams can get cleaner and more relevant records into SIEMs and other detection tools without overwhelming analysts with noise.
  • Stronger compliance and data protection. Logs and telemetry may contain sensitive or regulated information. A pipeline makes it easier to mask, redact, or route that data properly before it is stored or shared, which supports compliance and reduces risk.
  • More flexibility across tools and teams. Different teams need different views of the same data. An observability pipeline makes it easier to route specific streams to monitoring platforms, data lakes, SIEMs, or lower-cost storage without rebuilding collection every time requirements change.
  • Better scalability for modern environments. As infrastructure grows across cloud, containers, and distributed systems, pipelines help organizations scale telemetry handling in a more controlled and sustainable way.

In its essence, the value of an observability pipeline comes down to control. It helps teams cut waste, improve signal quality, support security and compliance, and make better use of telemetry across the business.

Observability Pipeline in the Cloud

Cloud environments make observability harder because they add more motion, more dependencies, and far more telemetry to manage. Microservices, containers, Kubernetes, and short-lived workloads all produce signals that change quickly and accumulate quickly. In Chronosphere’s cloud-native observability research summary, 87% of engineers said cloud-native architectures have made discovering and troubleshooting incidents more complex, and 96% said they feel stretched to their limits.

That complexity creates a practical problem for the business. Teams need broad visibility to understand what is happening across cloud services, applications, and infrastructure, but forwarding everything by default quickly becomes expensive and hard to manage. Experts describe the market shift as a move from volume to value, driven by rising telemetry costs, AI workloads, and the need for more disciplined visibility.

This is where observability pipelines become especially useful in the cloud. A pipeline gives teams a control layer between data sources and downstream tools, so they can filter noisy records, enrich important ones, and route each stream to the right destination. That means less waste in premium platforms, better-quality signals for troubleshooting, and more flexibility across monitoring, storage, and security tools. In cloud-native environments, that kind of control is no longer a nice extra.

The cloud angle also matters for cybersecurity. Security teams rely on the same cloud telemetry for threat detection, investigation, and compliance, but raw volume can overwhelm SIEMs and bury the events that matter. An observability pipeline helps earlier in the flow by reducing noise, improving context, and sending higher-value records to the right systems. That is also where SOC Prime’s DetectFlow fits naturally, moving detection closer to ingestion so teams can evaluate, enrich, and correlate events before they become downstream overload.

Observability Pipeline: A Smarter Layer for Security Operations

An observability pipeline gives teams something they increasingly need across modern environments: control before data turns into cost, noise, and slow decision-making. The more telemetry organizations collect, the more important it becomes to filter, enrich, transform, and route it with purpose. That makes observability pipelines useful far beyond monitoring alone. They help improve data quality, keep downstream platforms efficient, and create a stronger foundation for both operations and security.

Notably, security teams face the same telemetry problem, but with higher stakes. SIEMs have practical limits, rule counts do not scale forever, and too much raw data can put enourmous burned onto security analysis. This is where DetectFlow adds a meaningful value layer, extending observability pipeline logic into threat detection by moving detection closer to the ingestion layer.

DetectFlow runs tens of thousands of Sigma detections on live Kafka streams using Apache Flink, correlates events across multiple log sources at the pre-SIEM stage, and uses Flink Agent plus active threat context for AI-powered analysis. In practice, that means SOC teams can reduce noise earlier, surface attack chains faster, and improve investigative clarity before downstream tools get overwhelmed.

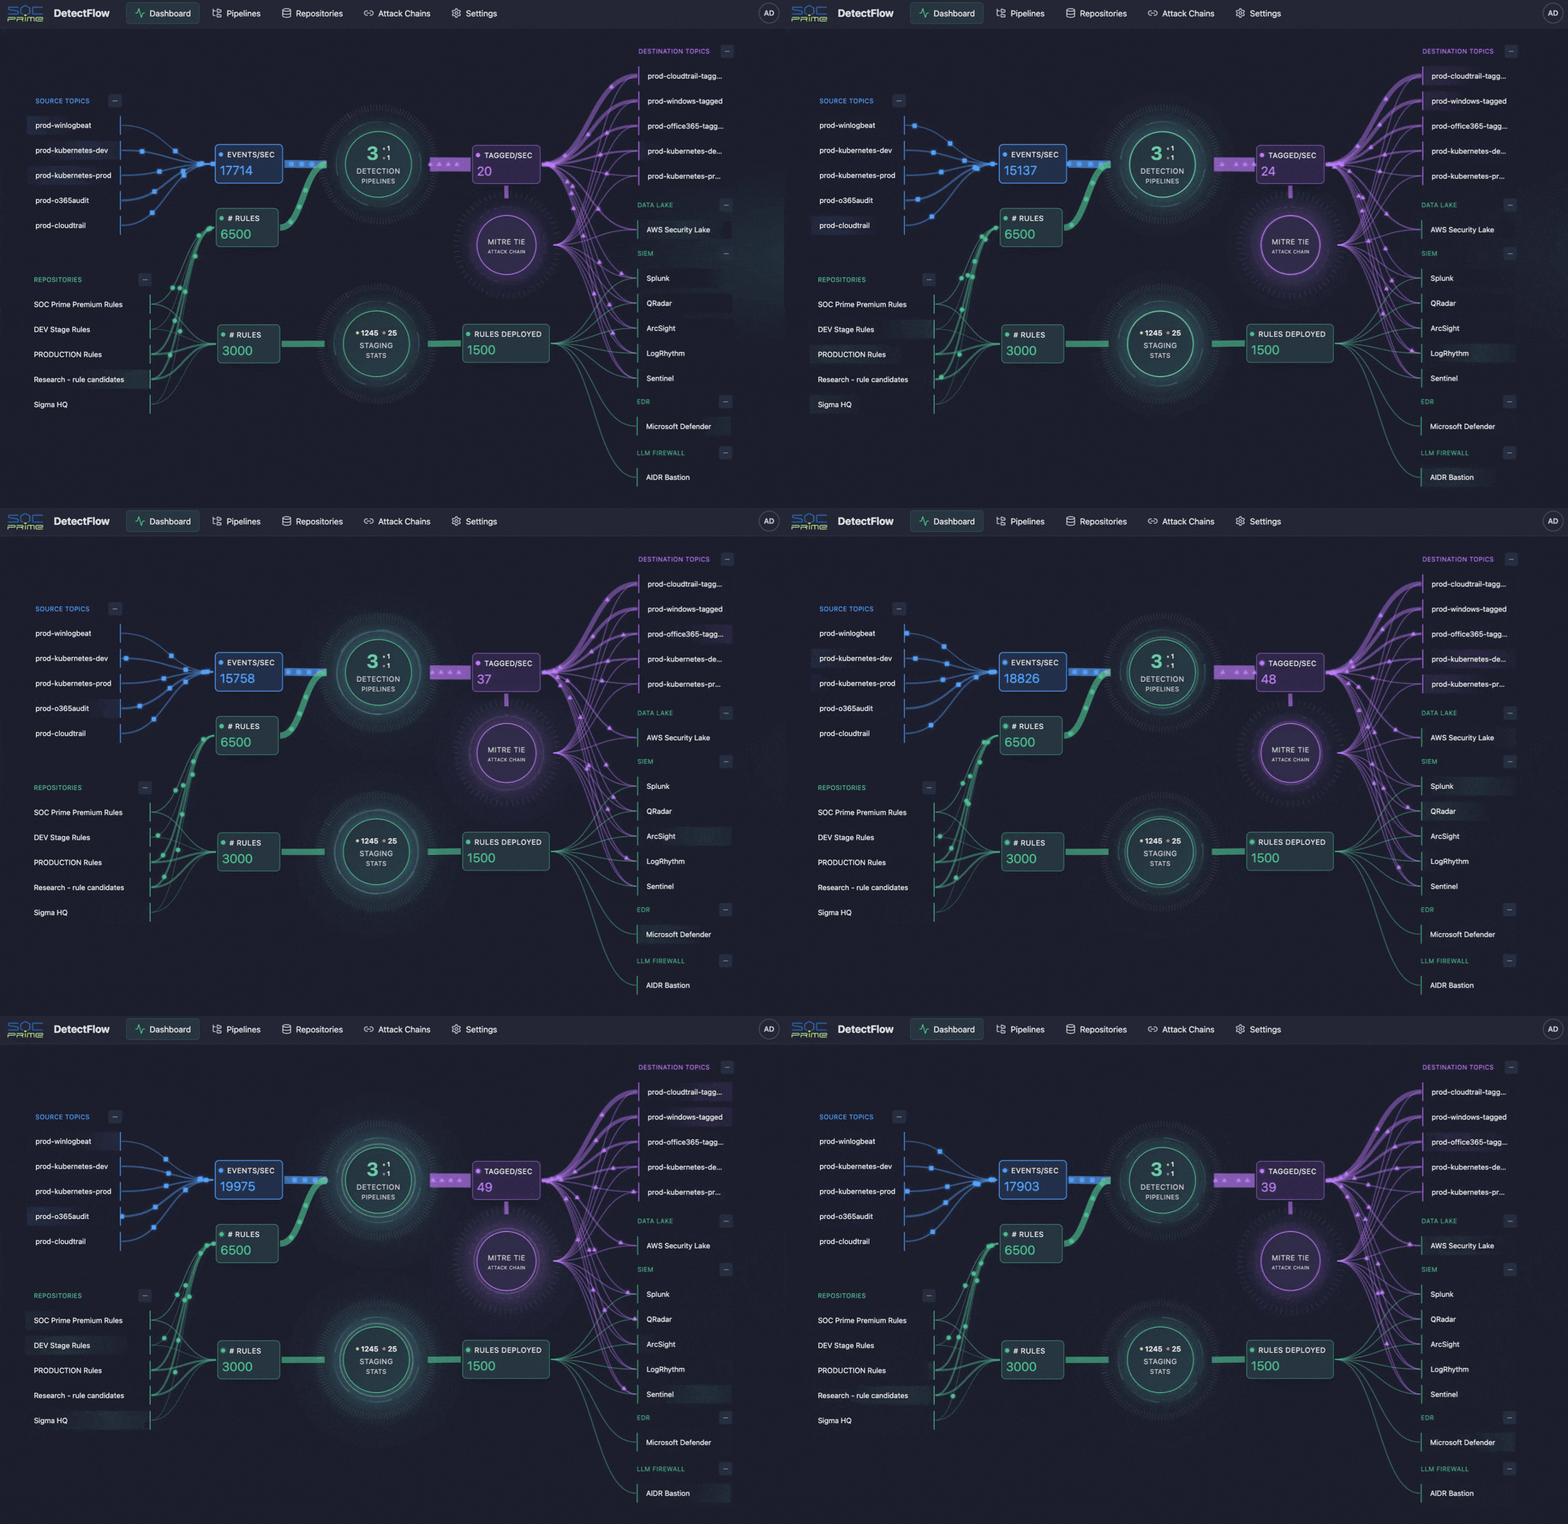
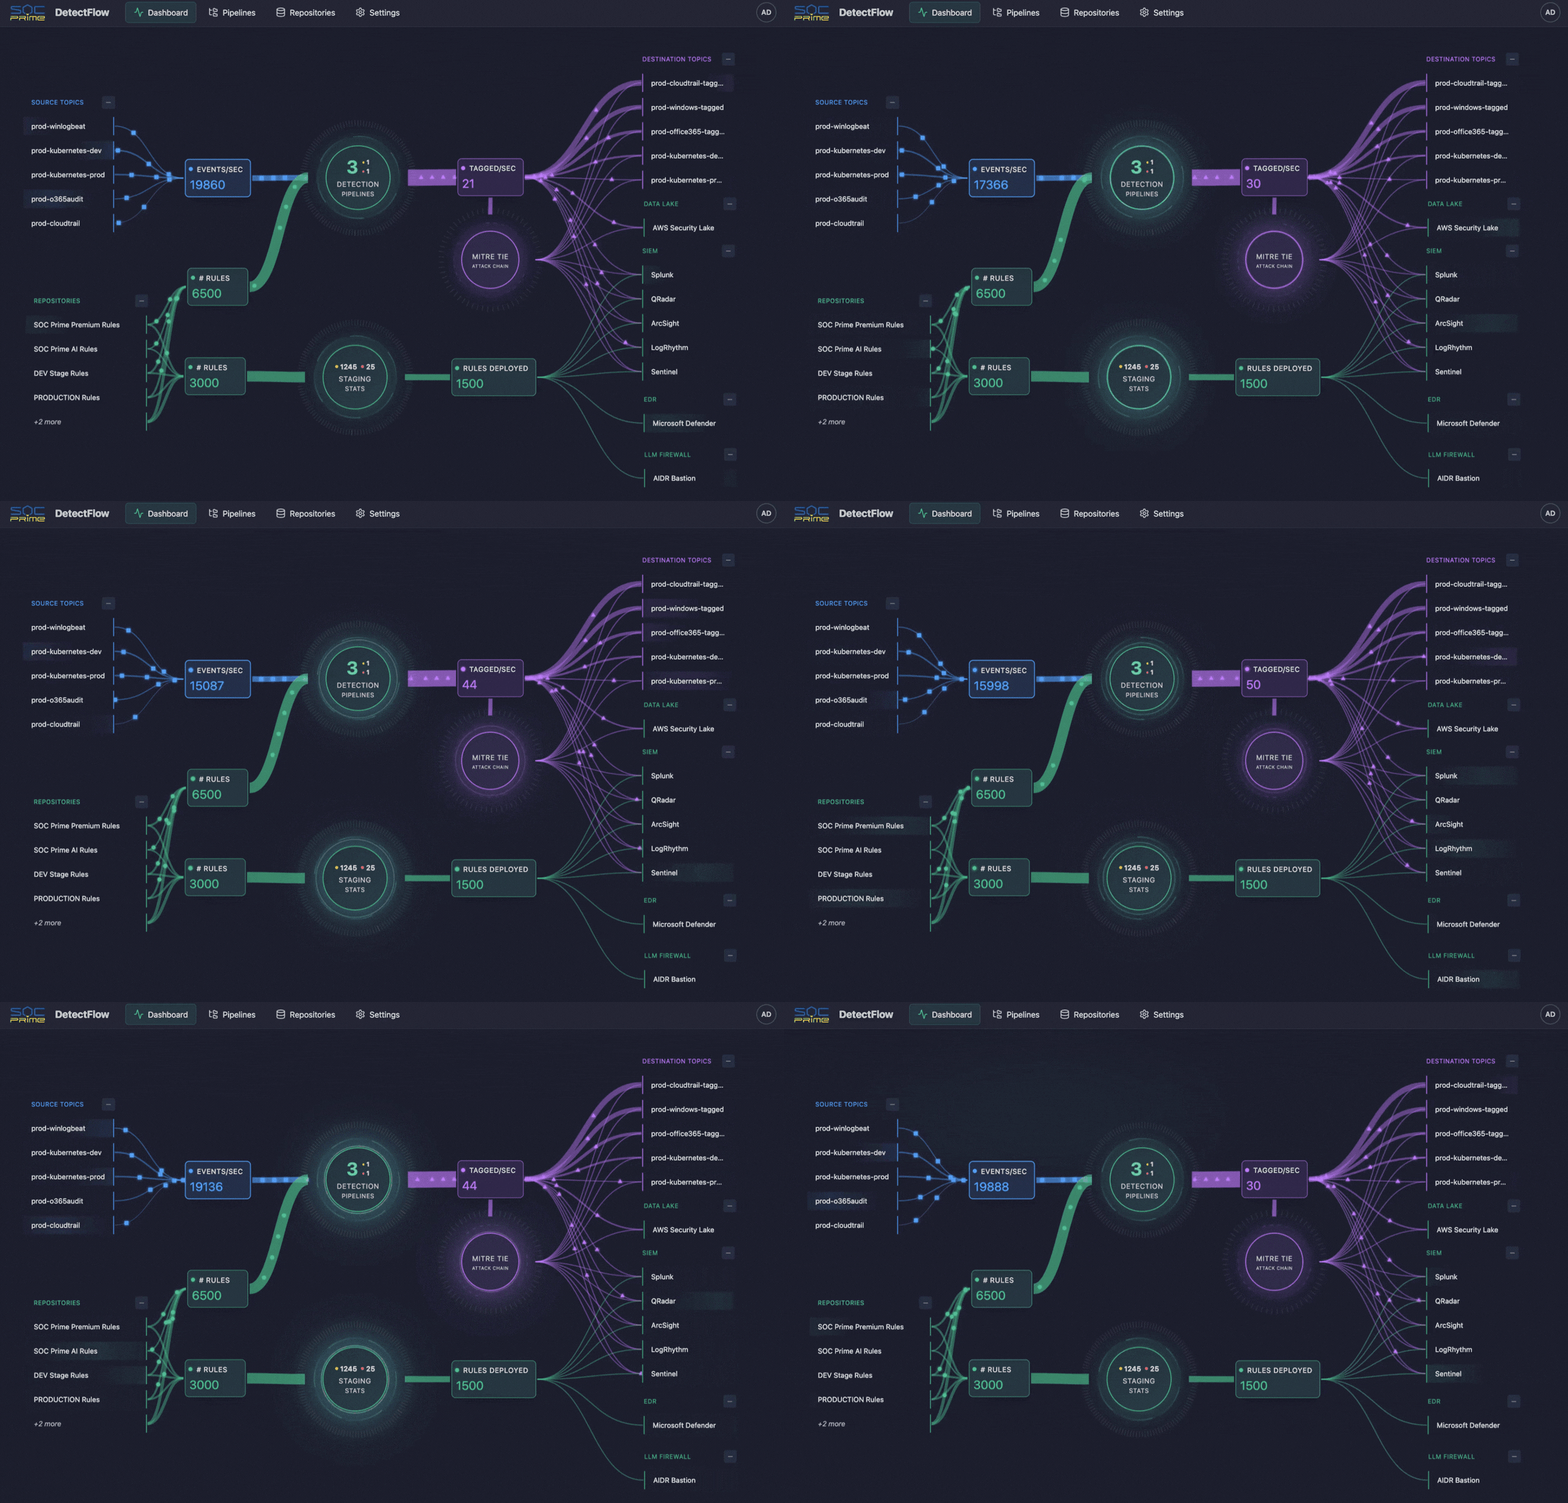
SOC Prime DetectFlow Dashboard


The post Observability Pipeline: Managing Telemetry at Scale appeared first on SOC Prime.

SIEM vs Log Management: Observability, Telemetry, and Detection

SIEM vs Log Management: Rethinking Security Data Workflows

Security teams are no longer short on data. They are drowning in it. Cloud control plane logs, endpoint telemetry, identity events, SaaS audit trails, application logs, and network signals keep expanding, while the SOC is still expected to deliver faster detection and cleaner investigations. That is why SIEM vs log management is not just a tooling debate. It is a telemetry strategy question about what to retain as evidence, what to analyze for real-time detection, and where to do the heavy lifting.

Observability programs accelerate the flood. More telemetry can mean better visibility, but only if the SOC can trust it, normalize it, enrich it, and query it fast enough to keep pace with active threats. At scale, the cost and operational burden show up quickly across both SIEM and log management. PwC highlights how rising data volumes and cost models can push teams to limit ingestion and create blind spots, while alert overload and performance constraints make it harder to separate real threats from noise. Speed is also unforgiving. Verizon reports the median time for users to fall for phishing is less than 60 seconds, while breach lifecycles remain measured in months.

That is why many SOCs are adopting a security data pipeline mindset. It means processing telemetry before it lands in your tools, so you control what gets stored, what gets indexed, and what gets analyzed. Solutions like SOC Prime’s DetectFlow add even more value by turning a data pipeline into a detection pipeline through in-flight normalization and enrichment, running thousands of Sigma rules on streaming data, and supporting value-based routing. Low-signal noise can stay in lower-cost log storage for retention, search, and forensics, while only enriched, detection-tagged events flow into the SIEM for triage and response. The outcome is lower SIEM ingestion and alert noise costs without sacrificing investigation history.

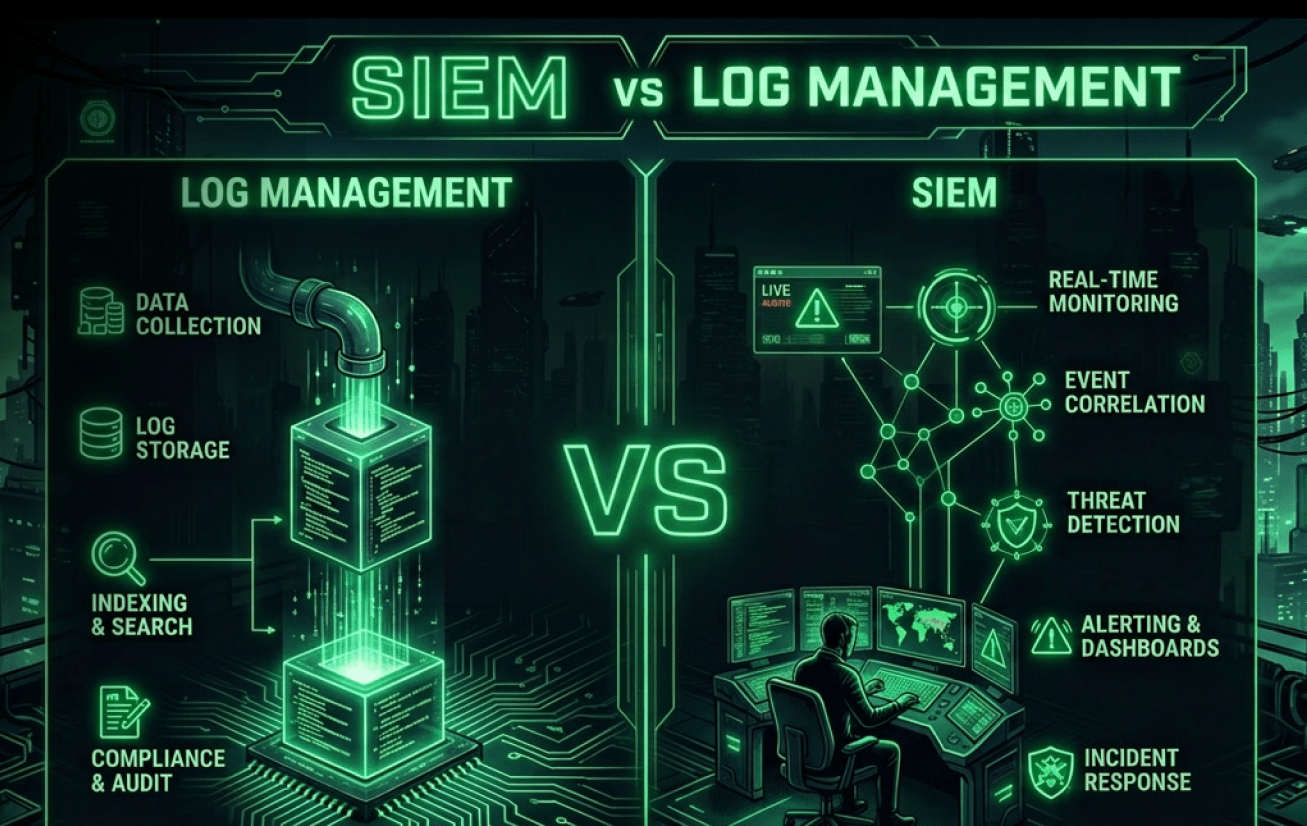
SIEM vs Log Management: Definitions

Before comparing tools, it helps to align on what each category is designed to do, because overlapping feature checklists can hide fundamentally different objectives.

Gartner defines SIEM around a customer need to analyze event data in real time for early detection and to collect, store, investigate, and report on log data for detection, investigation, and incident response. In other words, SIEM is a security-focused system of record that expects heterogeneous data, correlates it, and supports security operations workflows.

Log management has a different center of gravity. NIST describes log management as the process and infrastructure for generating, transmitting, storing, analyzing, and disposing of log data, supported by planning and operational practices that keep logging consistent and reliable. In fact, log management is how you keep the raw evidence searchable and retained at scale, while SIEM is where you operationalize security analytics and response.

The practical difference shows up when you ask two questions:

  • What is the unit of value? For log management, it is searchable records and operational visibility. For SIEM, it’s detection fidelity and incident context.
  • Where does analytics happen? In log management, analytics often supports exploration and troubleshooting. In SIEM, analytics is built for threat detection, alerting, triage, and case management


What Is a Log Management System?

A log management system is the operational backbone for ingesting and organizing logs, so teams can search, retain, and use them to understand what happened.

Log management is often the first place teams see the economics of telemetry. Many organizations don’t need to run expensive correlation on every log line. Instead, they store more data cheaply and retrieve it quickly when an incident demands it. That’s why log management is frequently paired with data routing and filtering approaches that reduce noise before it reaches higher-cost analytics layers.

For security teams, log management becomes truly valuable when it produces high-integrity, well-structured telemetry that downstream detections can rely on, without forcing the SIEM to act as a catch-all storage sink.

What Is a SIEM?

A SIEM stands for Security Information and Event Management. It is designed to centralize security-relevant telemetry and turn it into detections, investigations, and reports. Normally, SIEM is described as supporting threat detection, compliance, and incident management through the collection and analysis of security events, both near real-time and historical, across a broad scope of log and contextual data sources.

But SIEMs face structural pressures as telemetry grows. Common pain points in traditional SIEM approaches include skyrocketing data volumes and cost, alert overload, and scalability and performance constraints when searching and correlating large datasets in real time. Those pressures matter because defenders already operate on unfavorable timelines. IBM’s Cost of a Data Breach report shows breach lifecycles still commonly span months, which makes efficient investigation and reliable telemetry critical.

So while SIEM remains central for security analytics and response, many teams now treat it as the destination for curated, detection-ready data, not the place where all telemetry must land first.

SIEM vs Log Management: Main Features

A useful way to compare SIEM and log management is to map them to the security data lifecycle: collect, transform, store, analyze, and respond. Log management does most of the work in collect through store, with fast search to support investigations. SIEM concentrates on analyzing through response, where correlation, enrichment, alerting, and case management are expected to work under pressure.

Log management features typically cluster around collect, transform, store, and search:

  • Ingestion at scale: agents, syslog, API pulls, cloud-native integrations
  • Parsing and field extraction: schema mapping, pipeline transforms, enrichment for searchability
  • Retention and storage controls: tiering, compression, cost governance, access policies
  • Search and exploration: fast queries for troubleshooting and forensic hunting

SIEM features concentrate on analyzing and responding:

  • Security analytics and correlation: rules, detections, behavioral patterns, cross-source joins
  • Context and enrichment: identity, asset inventory, threat intel, entity resolution
  • Alert management: triage workflows, suppression, prioritization, reporting
  • Case management: investigations, evidence tracking, compliance reporting


SOC Prime vs Log Management

In other words, log management optimizes for retention and retrieval, and SIEM optimizes for detection and action. Yet, traditional SIEM approaches strain when the platform becomes both the telemetry lake and the correlation engine, especially under rising ingestion costs and alert noise. That is why many teams treat log management as the evidence layer, SIEM as the decision layer, and a pipeline layer as the control plane that shapes what flows into each.

Benefits of Using Log Management and SIEMs

Log management and SIEM are most effective when they’re treated as complementary layers in a single security data strategy.

Log management delivers depth and durability. It helps teams retain more raw evidence, troubleshoot operational issues that look like security incidents, and preserve the grounds needed for later forensics. This becomes essential when threat hypotheses emerge after the fact (for example, learning a new indicator days later and needing to search back in time).

SIEM delivers security outcomes: detection, prioritization, and incident workflows. A well-tuned SIEM program can reduce “needle-in-a-haystack” work by correlating events across identities, endpoints, networks, and cloud control planes.

The best security programs get three benefits from combining both:

  • Cost control: store more, analyze less expensively by default, and route high-value data to SIEM.
  • Better investigations: keep deep history in log platforms while SIEM tracks detections and cases.
  • Higher signal quality: normalize and enrich logs so detections fire on consistent fields rather than brittle strings.


How SOC Prime Can Improve the Work of SIEM & Log Management

SOC Prime brings the SIEM and log management story together as a single end-to-end workflow.

You start with Attack Detective to audit your SOC and map gaps to MITRE ATT&CK, so you know which telemetry and techniques you are missing. Then, Threat Detection Marketplace becomes the sourcing layer where you pull context-enriched detections aligned to those gaps and the latest TTPs. Uncoder AI acts as a detection-engineering booster, making the content operational and portable to any native formats your SIEM, EDR, or Data Lake actually runs, while also helping refine and optimize the logic so it performs at scale.

DetectFlow is the final layer that turns a data pipeline into a detection pipeline and enables full detection orchestration. Running tens of thousands of Sigma rules on live Kafka streams with sub-second MTTD using Apache Flink, DetectFlow tags and enriches events in flight before they reach your security stack and routes outcomes by value. This removes the need for SIEM min-maxing around rule limits and performance tradeoffs, because detection scale shifts to the stream layer, where it grows with your infrastructure, not vendor caps. For SIEM, it delivers cleaner, enriched, detection-tagged signals for triage and response. For log management, it preserves deep retention while making searches and investigations faster through normalized fields and attached detection context.

SOC Prime DetectFlow


The post SIEM vs Log Management: Observability, Telemetry, and Detection appeared first on SOC Prime.

What Is a Security Data Pipeline Platform: Key Benefits for Modern SOC

Security teams are drowning in telemetry: cloud logs, endpoint events, SaaS audit trails, identity signals, and network data. Yet many programs still push everything into a SIEM, hoping detections will sort it out later.

The problem is that “more data in the SIEM” doesn’t automatically translate into better detection. It often translates into chaos. Many SOCs admit they don’t even know what they’ll do with all that data once it’s ingested. The SANS 2025 Global SOC Survey reports that 42% of SOCs dump all incoming data into a SIEM without a plan for retrieval or analysis. Without upstream control over quality, structure, and routing, the SIEM becomes a dumping ground where messy inputs create messy outcomes: false positives, brittle detections, and missing context when it matters most.

That pressure shows up directly in the analyst experience. A Devo survey found that 83% of cyber defenders are overwhelmed by alert volume, false positives, and missing context, and 85% spend substantial time gathering and connecting evidence just to make alerts actionable. Even the mechanics of SIEM-based detection can work against you. Events must be collected, parsed, indexed, and stored before they’re reliably searchable and correlatable.

Cost is part of the same story. Forrester notes that “How do we reduce our SIEM ingest costs?” is one of the top inquiry questions it gets from clients. The practical answer is data pipeline management for security: route, reduce, redact, enrich, and transform logs before they hit the SIEM. Done well, this reduces spend and makes telemetry usable by enforcing consistent fields, stable schemas, and healthier pipelines so data turns into detections.

The demand pushes security teams to borrow a familiar idea from the data world. ETL stands for Extract, Transform, Load. It pulls data from multiple sources, transforms it into a consistent format, and then loads it into a target system for analytics and reporting. IBM describes ETL as a way to consolidate and prepare data, and notes that ETL is often batch-oriented and can be time-consuming when updates need to be frequent. Security increasingly needs the real-time version of this concept because a security signal loses value when it arrives late.

That is why event streaming has become so relevant. Apache Kafka sees event streaming as capturing events in real time, storing streams durably, processing them in real time or later, and routing them to different destinations. In security terms, this means you can normalize and enrich telemetry before detections depend on it, monitor telemetry health so the SOC does not go blind, and route the right data to the right place for response, hunting, or retention.

This is where Security Data Pipeline Platforms (SDPP) enter the picture. An SDPP is the solution located between sources and destinations that turns raw telemetry into governed, security-ready data. It handles ingestion, normalization, enrichment, routing, tiering, and data health so downstream systems can rely on clean and consistent events instead of compensating for broken schemas and missing context.

What Is a Security Data Pipeline Platform (SDPP)?

A Security Data Pipeline Platform (SDPP) is a centralized system that ingests security telemetry from many sources, processes it in-flight, and delivers it to one or more destinations, including SIEM, XDR, SOAR, and Data Lakes. The SDPP job is to take raw security data as it arrives, shape it properly, and deliver it downstream in a form that is consistent, enriched, and ready for detection and response. The shift is subtle but important. Instead of treating log management as “collect and store,” an SDPP treats it as “collect, improve, then distribute.”

In practice, SDPPs commonly support:

  • Collection from agents, APIs, syslog, cloud streams, and message buses
  • Parsing and normalization to consistent schemas (e.g., OCSF-style concepts)
  • Enrichment with asset, identity, vulnerability, and threat intel context
  • Filtering and sampling to reduce noise and control spend
  • Routing to multiple destinations (and different formats per destination)

Unlike legacy data pipelines that mainly move data from point A to point B, an SDPP adds intelligence and governance. It treats security data as a managed capability that can be standardized, observed, and adapted as environments change. That matters as teams adopt hybrid SIEM plus Data Lake strategies, scale cloud infrastructure for detection & response, and standardize telemetry for correlation & automation.

What Are the Key Capabilities of a Security Data Pipeline?

A security data pipeline turns raw telemetry into something usable before it hits your security stack. The most effective pipelines do two things at once. They improve data quality, and they control where data goes, how long it stays, and what it looks like when it arrives.

Ingest at Scale

A modern security data pipeline must collect continuously, not occasionally. That means cloud logs, SaaS audit feeds, endpoint telemetry, identity signals, and network data, pulled via APIs, agents, and streaming transports.

Transform in Flight

In-flight transformation is where the pipeline earns its value. As data flows, fields are parsed, key attributes are extracted, and formats are normalized into stable schemas. This reduces errors from inconsistent data and keeps correlation logic portable across tools. At the same time, noise can be filtered, events sampled, and privacy or redaction rules applied in a controlled, measurable, and reversible way. The result is clean, reliable data that’s ready for detection and action as it moves through the system.

Enrich With Context

Enrichment transforms daily SOC work by bringing context to the data before it reaches analysts. Instead of spending time manually gathering information, the pipeline adds identity and asset details, environment tags, vulnerability insights, and threat intelligence so events are ready for triage and correlation.

Route and Tier

Routing is where telemetry becomes truly governed. Instead of sending all data to a single destination, the pipeline applies policies to deliver the right events to SIEM, XDR, SOAR, and Data Lakes. Data is stored by value, with clear hot, warm, and cold retention paths, and can be accessed quickly when investigations require it. By handling different formats and subsets for each tool, routing keeps the pipeline organized, consistent, and fully managed across environments, turning raw streams into reliable, actionable telemetry.

Monitor Data Health

Pipelines need their own observability. Missing data, unexpected schema changes, or sudden spikes and drops can create blind spots that may only be noticed during an incident. A strong Security Data Pipeline Platform provides observability across the system, making these issues visible early and supporting safe rerouting if a destination fails.

AI Assistance

Teams are increasingly comfortable with relevant AI assistance in pipelines, especially for repetitive tasks like parser generation when formats change, drift detection, clustering similar events, and QA. The goal is not autonomous decision-making. It is a faster, more consistent pipeline operation with human control.

Detect in Stream

Some teams are now running detections directly in the data stream, turning their pipelines into active detection layers. Tools like SOC Prime’s DetectFlow enable this by applying tens of thousands of Sigma rules to live Kafka streams using Apache Flink, tagging and enriching events in real time before they reach systems like SIEM. The goal is not to replace centralized analytics, but to prioritize critical events earlier, improve routing, and reduce mean time to detect (MTTD).

What Challenge SDPPs Help to Solve?

Security Data Pipeline Platforms exist because modern SOC pain is not only “too many logs.” It is the friction between data collection and real detection outcomes. When telemetry is late, inconsistent, expensive to store, and hard to query at scale, the SOC ends up working around the data instead of working on threats. The main challenges SDPPs help solve are the following:

  • Data arrives too late to be useful. SIEM-based detection is not instant. Events must be collected, parsed, ingested, indexed, and stored before they are reliably searchable and correlatable. In real environments, correlation can take 15+ minutes depending on ingestion and processing load. SDPPs reduce this gap by shaping telemetry in-flight so downstream systems receive cleaner, normalized events sooner, and by routing high-priority data on faster paths when needed.
  • “Store everything” breaks the budget. Event data growth makes the default approach unaffordable. Even if you can pay to ingest everything, you still end up indexing and retaining huge volumes that do not improve detection outcomes. SDPPs help teams set clear policies, so high-value security events go to real-time systems, while bulk or long-retention logs are routed to cheaper tiers with predictable rehydration during investigations.
  • Detection logic can’t keep up with log volume. Average SOCs deploy roughly 40 rules per year, while practical SIEM rule programs and performance limits often cap usable coverage in the hundreds. More telemetry lands, but detection content does not scale at the same pace. SDPPs close the gap by reducing noise, stabilizing schemas, and preparing data so each rule has a higher signal value and works more consistently across environments.
  • ETL is not enough on its own. ETL is great for extracting, transforming, and loading data for analytics and reporting, often in batch. Security needs the continuous version of that idea. Telemetry arrives as a stream, formats change frequently, and detections need consistent schemas plus health monitoring to stay reliable. SDPPs complement ETL-style workflows by providing security-specific processing for streaming logs, schema drift handling, and operational observability.
  • Threats iterate faster than your query budget. AI-driven campaigns can evolve malicious payloads in minutes, which punishes workflows that depend on slow query cycles and manual evidence stitching. SIEMs also impose practical ceilings, including hard caps like under 1,000 queries per hour, depending on platform and licensing. SDPPs help by making each query more effective through normalization and enrichment, and by reducing the need for brute-force querying via smart routing, filtering, and tagging upstream.

What Are the Benefits of a Security Data Pipeline Platform?

When security teams talk about “too much data,” they rarely mean they want less visibility. They mean the work has become inefficient. Analysts waste time stitching context together, detections break when schemas drift, and leaders end up paying for ingest that does not move risk down.

A Security Data Pipeline Platform changes the day-to-day reality by putting one layer in charge of how telemetry is prepared and where it goes. For SOC teams, that means events arrive cleaner, more consistent, and easier to investigate. For the business, it means you can scale detection and retention without turning SIEM spend and operational noise into a permanent paycheck.

Therefore, key benefits of using Security Data Pipeline Platforms include the following:

  • Less noise, more signal. By filtering low-value events, deduplicating repeats, and adding context before events reach alerting systems, the SDPP helps analysts focus on what actually matters.
  • Lower SIEM and storage spend. The pipeline controls what gets sent to expensive destinations, routing high-value events to real-time systems while pushing bulk telemetry to cheaper tiers.
  • Less manual burden and rework. Transformation and routing rules live once in the pipeline instead of being rebuilt across tools and environments.
  • Stronger governance and compliance. Centralized policies simplify privacy controls, data residency constraints, and retention rules.
  • Fewer blind spots and surprises. Silence detection and telemetry health monitoring surface missing logs, drift, and delivery failures before incidents do.

How a Security Data Pipeline Platform Can Help Your Business?

At a business level, a Security Data Pipeline Platform is about making security operations predictable. When telemetry is governed upstream, leadership gets clearer answers to three questions that usually stay messy in mature environments: what data matters, where it should live, and what it should cost to operate at scale.

One practical impact is budget planning that survives data growth. Instead of treating ingestion as an uncontrollable variable, the pipeline makes volume a managed policy. You can set targets, prove what was reduced, and preserve the context that supports detection and compliance. That predictability turns cost reduction into operational freedom rather than a risky cut.

Another impact is standardization that unlocks reuse. When normalization is done once and applied everywhere, detection content and correlation logic can be reused across environments instead of being rewritten per source or per destination. That reduces the hidden maintenance costs that slow rollouts and drain engineering time.

A third impact is flexibility without lock-in. Intelligent routing and tiering let you align data to purpose, not vendor limitations. High-priority telemetry stays hot for response, broader datasets support hunting in cheaper stores, and long-retention logs can be archived with a clear rehydration path for investigations. The pipeline keeps the data layer stable while destinations evolve.

Finally, pipelines support operational assurance. Many organizations worry more about missing telemetry than noisy telemetry because quiet failures create blind spots that surface during incidents and audits. A pipeline that monitors source health and drift makes gaps visible early and improves confidence in security reporting.

Unlocking More SDPP Value With SOC Prime DetectFlow

Security data pipelines already help you collect, shape, and route telemetry with intent. SOC Prime’s DetectFlow adds an in-stream detection layer that turns your data pipeline into a detection pipeline. It runs Sigma rules on live Kafka streams using Apache Flink, tags, and enriches matching events in-flight, and routes high-priority matches downstream without changing your SIEM ingestion architecture.

Detect Flow, in-stream detection layer for SDPP

This directly targets the detection coverage gap. There are 216 MITRE ATT&CK techniques and 475 sub-techniques, yet the average SOC ships ~40 rules per year, and many SIEMs start to struggle around ~500 custom rules. DetectFlow is built to run tens of thousands of Sigma rules at stream speed with sub-second MTTD versus 15+ minutes common in SIEM-first pipelines. Because it scales with your infrastructure, you avoid vendor caps, keep data in your environment, support air-gapped or cloud-connected deployments, and unlock up to 10× rule capacity on existing infrastructure.

DetectFlow vs Traditional Approach: Benefits for SOC Teams

For more details, reach out to us at sales@socprime.com or kick off your journey at socprime.com/detectflow.


The post What Is a Security Data Pipeline Platform: Key Benefits for Modern SOC appeared first on SOC Prime.

What the Nike Breach Teaches Us About the Microsegmentation Imperative of Integrating with EDR

At 14:37 UTC on January 22, 2026, Nike appeared on WorldLeaks’ Tor-based leak site. The countdown timer showed 48 hours until 1.4 terabytes — 188,347 files — would be dumped onto the dark web for anyone to download. Included in the trove of files are assets from Nike’s research and development (R&D) and product creation […]

The post What the Nike Breach Teaches Us About the Microsegmentation Imperative of Integrating with EDR appeared first on ColorTokens.

The post What the Nike Breach Teaches Us About the Microsegmentation Imperative of Integrating with EDR appeared first on Security Boulevard.

Abrangência do grupo Scattered Spider acende alerta na América Latina, diz especialista

A expansão internacional do grupo de cibercriminosos conhecido como Scattered Spider acendeu um sinal de alerta entre empresas latino-americanas. Especialistas em segurança apontam que, embora não haja registros confirmados de ataques desse grupo no Brasil ou vizinhos até o momento, seu alcance global e métodos sofisticados representam um risco iminente para organizações na região.

Com táticas de engenharia social elaboradas e capacidade de driblar defesas tradicionais, o Scattered Spider tem mirado grandes empresas em diversos países. “A questão não é mais ‘se’ seremos atacados, mas de ‘quando’ e ‘como’, afirma Felipe Guimarães, Chief Information Security Officer da Solo Iron. “As táticas empregadas pelo grupo exploram fragilidades universais, presentes em empresas em todo o mundo – o que inclui as empresas latino-americanas”, pondera o especialista.

Um dos maiores riscos é que os setores visados pelo Scattered Spider no exterior também são pilares econômicos na América Latina. O grupo historicamente focou suas ações em empresas de telecomunicações, terceirização de processos de negócios (BPO) e grandes empresas de tecnologia – indústrias que possuem ampla presença na região. Nos últimos tempos, foi observado um aumento de interesse do grupo pelo setor financeiro global, o que inclui bancos e instituições presentes no Brasil e países vizinhos.

“Isso significa que companhias latino-americanas, seja diretamente ou através de filiais e parceiras, podem entrar na mira à medida que o Scattered Spider amplia seu raio de atuação. Mesmo empresas que não operam internacionalmente devem se precaver, pois os criminosos podem enxergar organizações locais como pontes de entrada para fornecedores ou clientes globais, ou simplesmente como alvos lucrativos por si sós, caso identifiquem falhas de segurança exploráveis”, pontua Guimarães.

Na mira das agências de inteligência

Relatórios do FBI e da Agência de Segurança Cibernética e de Infraestrutura (CISA) dos EUA descrevem o Scattered Spider como “especialista em engenharia social”, empregando diversas técnicas para roubar credenciais e burlar autenticações.

Entre os métodos documentados estão phishing por e-mail e SMS (smishing), ataques de vishing (ligações telefônicas fraudulentas) em que os criminosos se passam por equipe de TI da própria empresa, e até esquemas elaborados de SIM swap – quando convencem operadoras de telefonia a transferir o número de celular de uma vítima para um chip sob controle deles. Essas táticas permitem interceptar códigos de autenticação multifator (MFA) enviados via SMS ou aplicativos, dando aos invasores as chaves para acessar sistemas internos.

Ainda segundo o especialista, o modelo de ataque do Scattered Spider pode inspirar quadrilhas locais. “As táticas de engenharia social eficazes tendem a se espalhar rapidamente nos submundos virtuais. Mesmo que o próprio grupo original não atue diretamente na América Latina, outros agentes maliciosos regionais podem adotar técnicas semelhantes – como push bombing de MFA ou golpes contra centrais de atendimento – ao verem o sucesso obtido lá fora”, explica Guimarães.

Alguns incidentes recentes no cenário latino-americano já envolveram vetores parecidos, como uso de ferramentas legítimas em ataques e exploração de credenciais vazadas, o que reforça a necessidade de vigilância. Em 2024, por exemplo, houve casos de gangues de ransomware operando na região que abusaram de softwares legítimos e brechas em procedimentos internos de empresas, aplicando práticas muito similares ao do Scattered Spider.

Estratégias de mitigação

Diante da crescente ameaça representada por grupos como o Scattered Spider, Guimarães recomenda a adoção de estratégias com foco especial em fortalecer métodos avançados de autenticação multifator (MFA), preferencialmente resistentes a phishing, como chaves físicas de segurança ou soluções baseadas em certificados digitais. Técnicas como MFA com validação numérica e a restrição do uso de SMS para autenticação são essenciais para reduzir o risco de engenharia social e ataques por fadiga de notificações, muito usados pelo grupo.

Além disso, a adoção de uma abordagem mais robusta em relação à gestão de identidades e acessos (IAM) é uma estratégia muito importante na contenção desse tipo de ameaça. “As identidades digitais estão se tornando uma nova superfície de ataque; por isso, é fundamental que as empresas implementem políticas rígidas de gestão de identidades, controle granular de acessos e monitoramento contínuo das atividades dos usuários”, destaca.

“Também é muito importante o controle rigoroso sobre ferramentas de acesso remoto e a implantação de monitoramento avançado. É recomendável que as organizações restrinjam o uso dessas ferramentas por meio de listas autorizadas e adotem sistemas robustos como EDR e DLP para identificar rapidamente atividades suspeitas”, finaliza o especialista.

Insights from CISA’s red team findings and the evolution of EDR

A recent CISA red team assessment of a United States critical infrastructure organization revealed systemic vulnerabilities in modern cybersecurity. Among the most pressing issues was a heavy reliance on endpoint detection and response (EDR) solutions, paired with a lack of network-level protections.

These findings underscore a familiar challenge: Why do organizations place so much trust in EDR alone, and what must change to address its shortcomings?

EDR’s double-edged sword

A cornerstone of cyber resilience strategy, EDR solutions are prized for their ability to monitor endpoints for malicious activity. But as the CISA report demonstrated, this reliance can become a liability when paired with inadequate network defenses. Here’s why:

  1. Tunnel vision on endpoints: EDR excels at identifying threats on individual devices but struggles with network-wide attacks. This leaves gaps when hackers exploit lateral movement or unusual data transfers — activities that often require network-level visibility to detect.
  2. Playing catch-up with threats: Traditional EDR tools depend on recognizing known indicators of compromise (IOCs). Advanced attackers can easily sidestep these tools by using novel techniques or blending in with legitimate activity.
  3. Blind spots in legacy systems: Legacy environments often go unnoticed by EDR, giving attackers free rein. In the CISA case, these systems allowed the red team to persist for months undetected.
  4. Overwhelmed defenders: Even when EDR generates alerts, security teams can become desensitized by a flood of notifications. As seen in the CISA assessment, critical warnings can slip through the cracks simply because defenders are too stretched to respond.

Common EDR pain points

The challenges highlighted in the CISA report mirror broader issues organizations face with EDR:

  • Detection without context: EDR tools often spot anomalies on endpoints but fail to connect the dots across the broader network. This lack of context can leave organizations blind to coordinated attacks.
  • Weak network integration: Without network-layer defenses, EDR struggles to identify malicious activities like unusual traffic patterns or data exfiltration, key tactics in advanced breaches.
  • Fragmented systems: Many organizations operate a patchwork of security tools, leaving critical gaps in coverage and making it harder to correlate data across endpoints, networks and cloud environments.
Explore threat detection and response services

The next evolution of EDR

Recognizing these shortcomings, cybersecurity is rapidly evolving beyond traditional EDR. Here’s how:

  1. Extended detection and response (XDR): XDR takes EDR to the next level by integrating endpoint, network and cloud data into a single platform. This broader scope allows organizations to see the full attack picture and respond more effectively.
  2. AI-driven insights: Cutting-edge EDR solutions now harness machine learning to detect subtle behavioral anomalies. By identifying deviations from normal activity, these tools catch threats even when no IOCs exist.
  3. Zero trust security: Zero trust architectures take endpoint defense a step further by ensuring no device or user is trusted by default. This integration of endpoint, identity and network security reduces dependence on EDR alone.
  4. Network visibility: Modern EDR tools are incorporating network traffic analysis to close the gaps identified in the CISA report. Monitoring traffic for anomalies, such as unusual data flows or external connections, bolsters defenses.
  5. Cloud-native solutions: As businesses embrace hybrid and cloud environments, EDR is evolving to provide seamless coverage across on-premises and cloud systems, addressing vulnerabilities in these critical areas.

Why do gaps persist?

Even with these advancements, many organizations struggle to fully address EDR’s limitations:

  • Resource strains: Small security teams often lack the bandwidth or expertise to implement and manage advanced solutions like XDR.
  • Budget constraints: Upgrading to integrated platforms or modernizing legacy systems can be costly.
  • Legacy challenges: Outdated environments remain vulnerable, acting as weak points that attackers can exploit.
  • Leadership missteps: As the CISA report pointed out, organizations sometimes deprioritize known vulnerabilities, leaving critical gaps unaddressed.

Building a more resilient future

The CISA red team findings are a wake-up call: Endpoint protection alone is no longer enough. To outsmart today’s sophisticated adversaries, organizations must adopt a layered defense strategy that integrates endpoint, network and cloud security. Solutions like XDR, zero trust principles and advanced behavioral analysis offer a path forward — but they require strategic investments and cultural shifts.

The post Insights from CISA’s red team findings and the evolution of EDR appeared first on Security Intelligence.

❌