Thirty-one days, 438 incidents, one attack every 100 minutes. This infographic distills October 2026 into a single scroll. Cyber Crime was the loudest motive, while nearly half of all attacks left their motivation unknown. Malware led the arsenal, exploited public-facing applications opened the most doors, and Information & Communication took the brunt of targeting.
October 2026 closed with 438 recorded cyber incidents. Cyber Crime drove 44.1% of them, while nearly half of all motivations remained undetermined. Malware led the named attack techniques at 15.7%, ahead of Vulnerability Exploitation and Account Takeover. Exploiting public-facing applications was again the top initial access vector, and Information & Communication was the most targeted sector. The report breaks down motivations, attack vectors, initial access, sectors and geography.
Personal agents are the intermediary between humans and the Internet, turning a person’s instructions into requests and actions on websites. A customer might ask a personal agent to compare products across your site, find support articles, or complete a purchase. To a site owner, all three interactions show up as automated traffic — and without a clear view of which agents are visiting and what they are doing, it can be difficult to know whether that traffic is helping your business or creating risk. Blocking agents altogether can feel like the safest choice, but it can mean losing customers. Better visibility into agent activity allows you to decide what access makes sense for your site.
Today, we’re launching new analytics to help you understand how personal agents access your site on behalf of humans, along with more granular access policies to put those decisions into practice. Together, they let you welcome agents on your own terms, and in ways that support your business.
See how agents access your site
Knowing which agent is behind a request turns unexplained automated traffic into traffic you can act on with confidence. Cloudflare maintains the largest verified bot directory in the world, and we are now bringing that intelligence into your traffic details. In Security Analytics, the Bot Analysis chart now shows Personal Assistants as a new category, next to Verified Bot, Likely Human, Likely Automated, and Automated. Security teams can select it to see only personal agent traffic over time.
In Top statistics, a new Personal Assistants widget lists which agents are visiting your site and how many requests each one sends. Filter on one agent and every other widget updates to show only its traffic details: the paths it requests, the status codes it receives, and the networks it comes from. At a glance, you can see whether an agent is logging in, reading your product pages, reaching your checkout, or hitting errors on pages it cannot use.
For sites that protect user accounts with Account Abuse Protection (currently in early access), site owners and fraud teams are able to see which user each agent represents. The population overview page shows which personal agents are active across your users and how many accounts use them, so you can determine whether agent traffic is a meaningful part of your business. Every login and sign-up event now shows whether a personal agent made the request, and which one. Fraud teams can filter accounts by AI assistant events or number of AI assistants.
Additionally, each user's account overview shows the agents acting for that account. A fraud analyst investigating an unusual login can tell whether it came from an agent the customer has relied on for weeks, or from an agent that appeared for the first time today and needs a closer look. If it looks like an attacker is using an agent on an account, fraud analysts can mitigate that account directly, with a WAF rule on its Hashed User ID, without blocking the agent for everyone else who relies on it.
Together, these views give you a clearer basis for deciding which personal agents to welcome, limit, or block.
Set access policies that reflect your preferences
Weintroduced AI bot policies this summer so site owners could make separate access control choices for AI bots used for Search, Training, and Agent behaviors. Now we’re expanding the existing Agents policy to include granular control options for supported personal agents. To reflect this broader scope, we’re renaming the setting AI Crawler and Agent access policies.
In Security Settings, you can set an overall Agents policy, then choose a different policy for each supported personal agent: Allow (do not block), Block on pages with ads, or Block. For example, you can set the overall Agents policy to Block on pages with ads, then choose Allow (do not block) for a supported personal agent you want to welcome. Your existing Search and Training policies stay as they are.
You can also make these choices when you add a new zone to Cloudflare. During onboarding, we ask whether you monetize pages with ads and then tailor the recommended policies to your answer. You can always revisit your access controls later in Security Settings.
The right policy depends on your site. One publisher may allow a supported personal agent throughout its site so readers can find its articles, while another may block that same agent on pages where ads support the content. Both publishers are choosing the access control that works for their business.
Agent identity is only part of the story
The analytics and policies we’re launching today give site owners visibility into personal agent activity and control over their access. Our next goal is to help site owners preserve the context of their relationships with users when personal agents act as intermediaries. A site may recognize the agent making a request but lack information it would otherwise have about the user: whether they are an existing customer, what they authorized the agent to do, whether they have a subscription, or which protections should apply.
Reaching that goal will require privacy-aware ways to (1) carry user context through an agent, (2) help sites assess reputation, and (3) establish clear accountability when something goes wrong. We’ll be sharing more as we work with agent operators and others across the ecosystem, so site owners can choose whether to grant agents greater access while continuing to build relationships with their users.
Make the choice for your site
That person asking a personal agent to compare products, find support, or complete a purchase is still a customer trying to reach your business. Review how personal agents are accessing your site, then visit Security Settings → AI Crawler and Agent access policies to set the terms that work for your site.
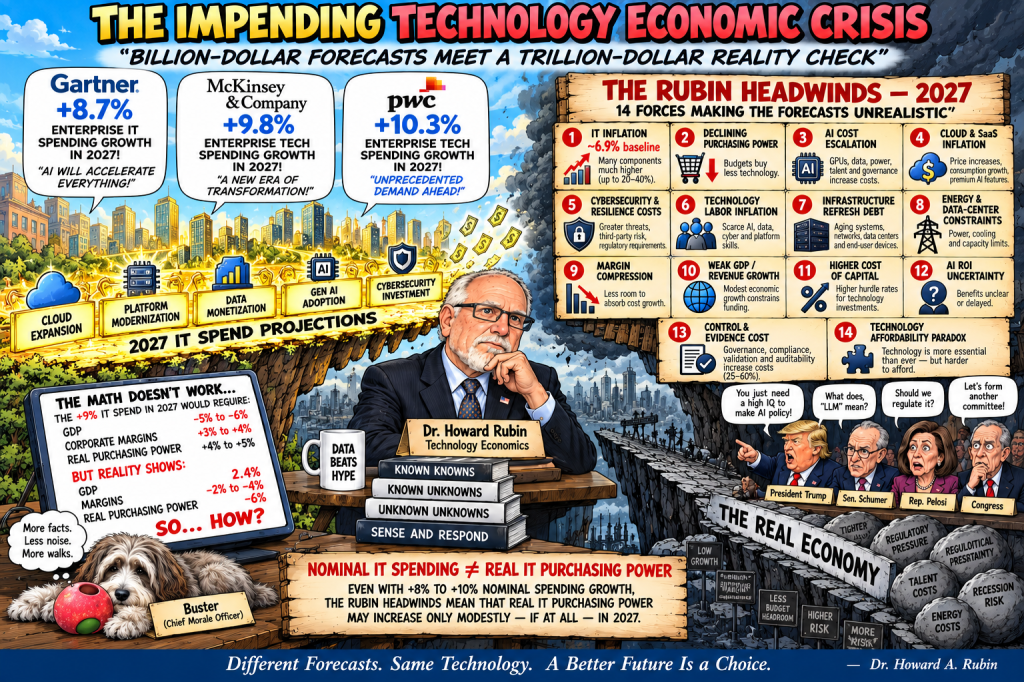
There is a fundamental problem hiding behind today’s technology forecasts: the technology industry is projecting spending growth at rates that many of its customers cannot economically sustain.
Gartner’s July 2026 forecast calls for worldwide IT spending to increase 14.2% in 2026 to $6.37 trillion. Within that number, software is projected to rise 15.5%, Infrastructure-as-a-Service 29.3%, and data-center systems an extraordinary 62.5%. Gartner itself acknowledges that technology budgets are being strained by inflation, supply shortages, hardware and memory costs, and AI investment.
The AI projections are even more dramatic. Gartner’s September forecast puts 2026 worldwide AI spending at $2.7 trillion—up 49.5% in a single year. McKinsey has separately estimated that generative AI alone could drive $175–$250 billion of software spending by 2027, adding two to six percentage points to software-sector growth.
These are extraordinary numbers. But they expose a fundamental flaw in the way the technology market is being viewed: The forecasts measure what the technology industry expects to sell—not necessarily what its customers can afford to buy.
That distinction is critical.
The forecasts may describe what technology suppliers want to sell, what hyperscalers intend to build, and what analysts believe enterprises will demand. They do not demonstrate that the typical enterprise has the economic capacity to increase its technology budget at anything approaching those rates.
Dr. Howard A. Rubin
That is the collision illustrated in this cartoon. Most companies cannot indefinitely grow technology spending at 10%, 15%, 20%, 30% or even 50% when their revenues, operating margins and the economies in which they operate are growing at only a fraction of those rates.
And the affordability problem is actually worse than the headline spending forecasts suggest.
Enterprises simultaneously face the economic headwinds: IT inflation; AI premiums; rising compute, server and memory costs; cybersecurity; energy and datacenter requirements; technical debt; scarce technology talent; software and cloud price escalation; regulatory and control costs; and the continuing expense of maintaining yesterday’s technology while financing tomorrow’s.
The result is what I call the Technology Affordability Gap: Technology demand + technology inflation + AI investment + infrastructure requirements are growing faster than the economic capacity of many enterprises to pay for them.
This produces an extraordinary paradox. Every technology forecast can appear individually plausible from the supplier’s side while their collective implications become economically implausible from the customer’s side.
A hyperscaler can forecast enormous cloud growth. An AI company can forecast enormous AI adoption. A software company can forecast higher subscription revenue. A semiconductor company can forecast explosive demand for AI infrastructure. An analyst can add all of those expectations together.
But ultimately there is only one customer balance sheet paying the bills.
Enterprises will have to slow spending, eliminate legacy costs, consolidate vendors, renegotiate contracts, defer lower-value projects, substitute AI and automation for labor, radically improve technology productivity, and demand demonstrable economic returns from AI and other technology investments. Otherwise, technology spending will increasingly have to be financed by taking money away from other parts of the enterprise— or by sacrificing margins.
That is the impending Technology Economic Crisis.
It is not a crisis caused by a shortage of technology. It is potentially a crisis caused by more technology ambition, more technology supply and more technology spending expectations than the underlying economy can afford.
The question for 2027 and beyond, therefore, isn’t simply: “How much technology will companies want?”
It is: “How much technology can they actually afford?”
I’ve gotten nearly 2,000 campaign fundraising texts that were meant for someone else. I tried to find out why—and uncovered a labyrinth of politicians, data brokers, and shady tactics.
Information released by Distributed Denial of Secrets is the third such government data disclosure in the last month
Data identifying more than 41,000 employees and contractors for the US Department of Homeland Security (DHS) was released on Wednesday in an unprecedented leak that reveals how the agency is organized. The records, which were made public by the transparency non-profit Distributed Denial of Secrets, reference operation names, surveillance programs and information on undercover initiatives.
The DHS did not immediately return a message seeking comment.
Microsoft explains why deleting Windows 11 Prefetch files degrades application startup performance while highlighting their crucial digital forensics role.
Jess Asato’s public campaigning for victims of online abuse put her in the crosshairs of Grok’s deepfake scandal. Then the UK member of parliament became a victim of the abuse herself.
An executive IT dashboard can stay green for a year while the risks it is supposed to surface keep growing. Availability above target every month. Service levels met. Patch compliance climbing quarter over quarter. Every number accurate, and every one trusted by the executive team.
When trouble finally arrives, it skips amber entirely. It comes as an outage, an audit finding or a security incident, and the first question in the room is why the dashboard said everything was fine.
In my work with technology leaders and executive teams, I have learned that a dashboard can be technically accurate and still leave leadership dangerously misinformed. Usually nobody fudged anything. The numbers were built to summarize, and a summary is very good at hiding the one thing an executive most needs to see. Three metrics produce most of that false comfort at the executive level. I would not put any of them in front of a CEO or a board as a headline number.
Three green numbers I would take off the executive dashboard
Monthly availability is the classic. A 99.9 percent month still allows about 43 minutes of downtime, and the percentage says nothing about when those minutes fell. Forty minutes at 3 a.m. on a Sunday and forty minutes during month-end close produce the same number. So do one long outage and a dozen short ones that each forced the order desk to restart its work. CIO.com made a version of this case years ago, arguing that uptime means little until it is tied to business impact. Business leaders notice the gap. When the official figure does not match what their teams lived through, the dashboard loses the room, and nobody tells the CIO.
Service-level attainment is the second. A service desk can hit its resolution targets month after month while the same problems keep coming back. A recurring sync failure gets fixed in twenty minutes, closed inside the target and counted as a success. It happens again the following week and gets counted as another success. The metric rewards fast closure, so the organization gets very good at fast closure, and the underlying fault never draws enough attention to be fixed. What builds underneath is a growing list of known problems held together by workarounds. Each one is a small daily cost to the business and a much larger risk the day the person who knows the workaround leaves.
Patch compliance is the third, and the most dangerous, because it expresses security posture as a percentage of a device count. A fleet that is 96 percent patched sounds well defended. The question the percentage cannot answer is which 4 percent. The unpatched remainder is rarely random. It is the legacy system nobody is allowed to reboot, the vendor-managed appliance the team cannot touch, the server behind a process considered too important to risk. Those are often the assets an attacker would pick first. The headline number improves every quarter as the easy devices get patched, while the exposure that matters sits unchanged on an exceptions list nobody above the security team reads.
Why averages flatter the people who report them
Each of these metrics averages across a large population where the risk is concentrated in a small corner. The thousands of healthy devices, the hundreds of quiet hours and the routine tickets all pull the number toward green. The handful of things that could actually hurt the company barely move it.
Executive dashboards drift toward this kind of measure for understandable reasons. Percentages are stable, they trend nicely and they compare cleanly against a target. They also protect the team producing them, which is the part few people say out loud. A metric that is green almost every month spares everyone a hard conversation. Over a few years, without anyone deciding it, the dashboard selects for numbers that do exactly that. One question exposes it quickly: when did the executive dashboard last show a red month? If nobody can remember, or nobody can say what it would take to produce one, the dashboard has stopped measuring the organization and started reassuring it.
The cost lands when something breaks. A CIO who reported green for eleven straight months and then has to explain a major incident is answering two questions at once: what went wrong and why the reporting missed it. The second question is the one executives remember, and it colors how they read every report that follows. After that, a green month is no longer taken at face value.
I hold every executive metric to one test. If a number cannot embarrass me, it does not belong on the dashboard.
What I would put in front of executives instead
The replacements are less flattering and more useful. There are three I would choose.
Disruption minutes on the processes that matter. It starts with an agreement with business leaders, made in advance, on a short list of processes their teams cannot run without and the windows when those processes matter most: order entry during business hours, payroll in the days before a run, financial systems at close. Then the dashboard reports minutes of disruption to those processes during those windows, and every incident behind the number is listed by name. A quiet month looks quiet. A bad Tuesday during close shows up as exactly what it was, and the business leaders in the room recognize it because they lived it.
Repeat incidents. Of everything that broke this month, how much had broken before? I would trade every resolution rate on the dashboard for this one number. A low repeat rate means problems are being fixed at the root. A rising one means the organization is living on workarounds, and it shows up months before the workarounds start to fail in ways that customers notice.
The age of the worst exposure. For security, the measure I want to see is the oldest unremediated critical vulnerability on systems that face the internet or hold sensitive data, along with the number of standing exceptions and the name of the executive who approved each one. The age moves only when the hard cases get fixed, which is the point. An exception with an executive’s name on it is far more likely to get a decision: fix it or own the risk. An exception that belongs to nobody can sit indefinitely.
Each replacement shares three properties. Its red threshold is agreed before the reporting period begins, so nobody negotiates it after the fact. It points at a specific process or system, so a red result tells an executive where to look. And it is uncomfortable enough that the team would rather fix the underlying issue than explain the number again next month.
The old percentages still have a home. They stay on the operations team’s internal dashboards, where they help run the shop day to day and where a team lead can see a trend early. The executive view gets the measures that can turn red.
None of this requires new tooling. Most IT organizations already capture the incident history, the vulnerability data and the process calendar these measures depend on. What it requires is a decision about what the executive team is entitled to see, and the willingness to show a red month before something forces it.
The first report built this way will almost certainly show red somewhere, and that is the reason to build it. A red month is uncomfortable for a meeting or two. It also sharpens the questions, turns the conversation to the actual condition of the systems the company runs on and ends the CIO’s role as the person who said everything was fine. A dashboard that has been green for a year might be telling the truth. From the top, there is no way to know, and that is reason enough to change what goes on it.
Quest Diagnostics has confirmed that an unauthorized party accessed a system healthcare providers use to order laboratory tests and view results, affecting personal information and patient records.
Quest is a major US laboratory testing company whose services help healthcare professionals diagnose and monitor medical conditions. Those services range from routine laboratory testing to specialized testing in areas such as cancer, infectious diseases, and neurology.
What happened and what was stolen?
The company learned of unauthorized access to its Quanum Lab Services Manager, or LSM, on October 21. The compromised platform lets healthcare professionals order tests, access results, review historical trends, and order supplies. Quest paused access to the platform and began investigating. Quest says its core business operations remain up and running.
An investigation is ongoing. Quest has not yet published a count of affected patients or a complete list of the information accessed. It says it will notify affected patients, healthcare providers, and health plans.
The company said:
“personal information and patient records were affected.”
It confirms that health information and personally identifiable information were involved, but has not specified whether these included Social Security numbers, insurance identifiers, payment information, particular test results, or account passwords.
What patients can do now
Quest says it will send notification letters to affected patients once its investigation is complete. Those letters will describe available resources, including credit and identity monitoring. If you receive one, read it carefully and follow the instructions. You can also check the FAQs posted in Quest’s breach notice for updates.
Someone’s got their eye on your personal information. Make sure it’s us.
A breach does not automatically mean someone has misused your information, but you can take these precautions while you wait for more details:
Verify unexpected messages independently. Don’t let a message about the breach rush you into clicking a link, sharing sensitive information, or making a payment. Go to Quest’s official website yourself or use contact details you already trust.
Review medical bills and insurance statements. Look for appointments, tests, prescriptions, or services you did not receive. The Federal Trade Commission (FTC) identifies unfamiliar medical bills and unexpected items on an Explanation of Benefits statement, which explains how your insurer processed a claim, as warning signs of medical identity theft. Report discrepancies to your healthcare provider and your insurer.
Review your credit reports. Look for unfamiliar accounts or debts and dispute errors. Free reports are available through AnnualCreditReport.com.
Act if you find signs of identity theft. Visit IdentityTheft.gov for a recovery plan. If someone has received care in your name, ask the providers involved for copies of your medical records and request corrections in writing.
Medical identity theft is not just a financial problem; it can also affect your care. Someone using your identity to obtain treatment or submit insurance claims could introduce incorrect information into your health records. Checking medical statements and reporting anything unfamiliar can help you catch that misuse.
Let’s face it, an incognito window can only do so much.
Breaches, dark web trading, credit fraud. Malwarebytes Identity Theft Protection monitors for all of it, alerts you fast, and comes with identity theft insurance.
According to a quartet of Accenture intellectual heavyweights, what CIOs need now to account for and control AI costs is tokenomics, sweet tokenomics.
The idea of linking AI spend to business outcomes may be a noble one, but “Tokenomics” only pretends to do so, unless you think tallying costs and measuring business outcomes are one and the same thing.
But before we get to Tokenomics we need to set the stage.
Start with Function Point Analysis (FPA), a venerable and mostly forgotten discipline, which should say something about its efficacy.
The folly of cost metrics you can’t understand
Back in the day, IT leaders worried that boards of directors worried that business executives worried about the cost of information technology and how to manage it.
IBM introduced Function Point Analysis in 1979 to solve this issue by breaking a software application into chunks — function points. Analysts could then sum these function points to compare the application’s overall complexity — and therefore its cost and risks — with that of any other piece of software.
When presented with the number of function points a proposed software project would require, your average, hopelessly naïve business leader asked IT to point to a few of the project’s function points, expecting mocked-up screenshots, sample reports, and so on.
Sadly, IT had to decline because, the design analysts would explain, a function point is (as Google’s AI Overview explains) “an abstract, synthetic unit of measurement rather than a physical object or a single piece of code.”
The Function Point Analysis value proposition, then, was that business leaders could manage IT costs and risks better by relying on cost metrics they couldn’t understand.
Function points for the AI era
Fast-forward to today, and the equivalent function-point cost metrics for AI are tokens — the chunks of text that a large language model reads, processes, and generates. Which, in case you missed the briefing, supposedly makes tokenomics a way to manage the costs and risks of AI.
As the aforementioned Accenture gurus “explain” (scare quotes intended): “Enterprise AI is creating a new cost of doing business: tokens. As consumption scales, token economics is becoming a material risk and opportunity, drawing increasing attention across the C-suite and the board.”
Which raises the question: Where are our tokenomics pundits finding C-suite and board members who give even an infinitesimal damn about tokens? They’re probably the ones who still pay attention to function points, too.
A short lesson in Brickonomics
But before we delve deeper into Tokenomics, capital T, we need to understand building maintenance and the critical role Brickonomics plays in it.
It’s like this: Brick walls are made of bricks. So if a brick wall needs attention, a building management project estimator should need to understand the costs and risks associated with managing a standard brick in the crumbling wall they’re supposed to fix. Multiply the standard management cost of a standard brick (a brickon?) by the number of bricks in the wall, and voilà! Building management knows …
Well, it knows less than it would have if had it instead invested in a conventional tuckpointing analysis. Among the missing pieces: In tuckpointing analysis, what usually needs and gets attention is the mortar between the bricks, not the bricks themselves.
Putting it all together — because you will have to
Now we’re ready for Tokenomics, and its conjecture that dividing an LLM into tokens and assigning a cost to each of those tokens will prove more useful than dividing software into function points or a wall into individually managed bricks.
The next questionable aspect of Tokenomics is that it depends on the proposition that all AI implementations are built on large language models or similar architectures.
To be fair, Tokenomics doesn’t have to be limited to analyzing LLMs. It can be adapted to any collection of thingies that’s composed of chunks that can be parameterized.
But that really isn’t good enough, is it? Because given the current pace of AI innovation, assuming that anything about it is stable, especially that its future core architecture will be tokenizable, is a shaky assumption at best.
It’s a mortar versus bricks challenge.
Then there are those pesky function points. Just because AI is involved in an implementation, that doesn’t mean software isn’t also involved. Which would seem to suggest that Tokenomics will have to integrate Function Point Analysis into its methods and practices as well.
Imagine you’re the one who has to explain this mess to those boards and business leaders who are, supposedly, clamoring for it. Because, as CIO, you will be.
Chargebacks and culture
We haven’t even gotten to the other big risk of Tokenomics: that it focuses decision-makers on AI’s costs, with only token attention — no pun intended — paid to its benefits.
Deep down inside, Tokenomics’ value depends on its use for chargebacks and showbacks. The logic for imposing these is superficially appealing — it makes business owners take responsibility for the AI spend driven by their consumption.
Those CIOs who dove into the chargeback rabbit hole discovered just how futile chargebacks can be. That’s because of a time-honored practice updated to the digital age: arguing about the bill.
Because that’s all a chargeback is: a bill. It’s a statement of how much money will change hands so that someone who has provided a good or service is reimbursed for the value they’ve created.
By the numbers: (1) a chargeback is a bill; (2) the point of Tokenomics is to support chargebacks; and (3) no business leader will be able to understand the bill they’re supposed to pay given Tokenomics impenetrable vocabulary and construction.
But what about showbacks, then? Letting business leaders understand the costs they’re driving would seem harmless and potentially useful.
And in fact showbacks can be harmless and useful, so long as they’re applied in the right business culture. That’s a culture in which managers consider themselves to be leaders of the whole company, basing their AI utilization decisions just as they base their other decisions — on the extent to which they benefit the whole company.
With a culture like this, IT can limit its application of tokenomics, little t, to its technical architecture practices. This way, the CIO can inform business managers of AI’s costs just as the CIO informs business managers of the other costs of running IT.
Where, the business manager might ask, did these cost numbers come from?
“You have two choices,” the CIO might reply. “You can trust me, or I can explain it to you.”
The current US administration is an obstacle, but public demand for protection will ultimately prevail
Organisations around the world scrambled on Thursday to fix critical flaws in PHP, the software that powers much of the web. The vulnerabilities could allow attackers to take control of affected servers. Some websites were taken offline as a precaution while fixes were installed. The paradox is that while AI helped researchers uncover the flaw, it also threatens to accelerate the ability to exploit it. Amazon said that it had detected an attempt before the public disclosure of the PHP flaws.
What the episode highlights is AI’s central role in security – and not always for the right reasons. OpenAI’s models have also been responsible for two alarming hacks this year – a security breach of an Australian health department website and a raid by a swarm of AI bots on Hugging Face, an AI services platform. Citing those incidents, the AI minister, Kanishka Narayan, warned that a similar cyber-attack on the UK is “likely, if not inevitable”.
Purpose and Scope This report summarizes the quantity of new ransomware samples collected, the number of compromised systems, and statistics on targeted businesses during the month of September 2026, as well as major Korean & global ransomware issues. The analysis is based on data collected through ATIP (AhnLab Threat Intelligence Platform) and AhnLab Smart Defense, […]
Today, we are expanding our web application firewall (WAF) by adding two new capabilities: full transaction detections and response rules. Full transaction detections evaluate each HTTP request alongside its response to identify evidence of exploitation. It helps answer both "Does this request look malicious?" and "What happened when the application handled it?" Response rules can then block the origin’s response before it reaches the requester.
These are valuable protections because the latest frontier models are uncovering vulnerabilities buried deep in widely used software, giving defenders clarity on what to fix — and attackers new paths to exploit. The recent php2shell vulnerability shows the stakes: a flaw in a common software component can put applications across the Internet at risk. AI agents scanning for vulnerabilities can be extremely persistent, adapting payloads using feedback, and chaining vulnerabilities, credentials, and permissions. An application's response can reveal whether an attempt worked and give an attacker information that helps them go deeper.
Inspecting incoming requests remains essential for stopping recognizable attacks before they reach an application. But some threats become clear only when the request is considered alongside what the origin returns. A suspicious input followed by a response exposing sensitive information tells a different story from the same input followed by a rejection or an error.
With these new capabilities, customers can use Cloudflare-managed protections or build their own policies combining request and response properties. This extends our always-on application security framework, with detection results available in Security Analytics to support investigation. Our first managed protections using this capability address the recently disclosed php2shell vulnerability.
And the best part? We are making these new capabilities generally available to all Cloudflare customers, including Free plans.
Request inspection is not enough
Cloudflare WAF protects websites and APIs with managed rules, custom rules, and rate limiting. Managed rules provide protection for known attack techniques and vulnerabilities while custom rules let teams create their own policies using parameters such as an IP address, URL path, headers, and request body. These controls operate at the request level to stop exploits or unwanted traffic from reaching the origin.
For many threats, this is the right place to act. However, treating every suspicious request as a confirmed exploit creates a difficult choice. Broad request signatures can catch more potential attacks, but they can also show “false positives”, such as matching legitimate traffic — which then breaks the applications. Deploying only rules that do not trigger false positives reduces that risk, but can leave more room for more ambiguous traffic to reach the server.
The response provides the missing evidence. Cloudflare can now correlate it with the request that produced it, so detections can account for the outcome of the entire HTTP transaction.
As an illustrative example, consider an application that lets users download files. An attacker manipulates the file parameter to request a private configuration file outside the permitted directory:
GET /download?file=../../config/database.ini
Request inspection can recognize this path traversal attempt and block it before it reaches the application. The request alone, however, cannot establish whether the application would expose the file. It might reject the request, ignore the traversal, or return an error. If the request reaches the origin, a response like this provides additional evidence:
200 OK
Content-Type: text/plain
[database]
username=app_service
password=EXAMPLE_SECRET
Full transaction detection provides a missing piece: it can correlate the attempted file access with response content characteristic of a private configuration file. Configuration-like text can legitimately appear in documentation or example downloads; combining it with a traversal attempt provides stronger evidence of sensitive data exposure than either signal alone. A response rule can then replace the origin response with a Cloudflare WAF block page and HTTP 403 before it reaches the requester, effectively blocking the exploit by preventing sensitive information from reaching the attacker.
Detection and mitigation are separate by design
Full transaction detection extends the always-on detection framework we introduced earlier this year. Detections analyze traffic and attach metadata to the request and response, rules then decide what to do with those results.
Separating those jobs gives customers visibility before they design a policy. Security teams can inspect detections in their own traffic, understand which endpoints and signatures are involved, and choose the response that fits their application. Similar to the approach for the request-based Attack Signature Detection, the outcome of the detections are stored in fields that can be accessed in the response custom rules or used in managed detections to block traffic.
Mirroring the request detection fields, the following new fields are added to our platform:
Field
Description
cf.waf.signature.response.confidence
Confidence values associated with matching signatures
cf.waf.signature.response.categories
Categories associated with matching signatures
cf.waf.signature.response.ref
Signature reference IDs, up to 10
The first full transaction detections focus on exploit confirmation for high profile vulnerability. It correlates suspicious input with response signals that indicate an exploit may have succeeded.
We will expand coverage over time by supporting other use cases, including detecting data exposure and exfiltration signals. This is important for the Internet beyond any one application: defenses can distinguish probing from evidence of impact, while detection of exposed data and services can reach customers that do not have a dedicated security team tuning every WAF rule.
Create rules on the response
Detecting evidence of exploitation is most useful if you can act on it in real time. Response custom rules turn full transaction detections into inline protection by blocking a matching origin response before it reaches the requester, although it cannot undo actions already performed at the origin.
Security teams can now combine request and response properties with detection results to decide which responses to block. When a blocking rule matches, Cloudflare replaces the origin response with a WAF block page or a custom response.
Response phase controls are available in the Cloudflare dashboard at the bottom of the Security > Security Rules page, with both managed protections and custom rules.
We have released both managed and custom rules to all plans, including Free plans. Over time, we will follow the same approach we use for request detections, where managed detections for free plans focus on high-profile vulnerabilities, while paying customers get a richer catalog of detections.
Managed detections
All customers get the protection of the full array of transaction detections through the Cloudflare Managed Response Firewall Default ruleset, which is designed for a simple one-click deploy and simplified configurability. When a signature matches, the managed detection will block the response and return a standard WAF block page.
You can edit the Cloudflare Managed Response Firewall Default scope to run detections only on a portion of their applications, for example by excluding or restricting the detection to a specific path. Paying customers can use detection fields in custom response rules to create more tailored policies.
Custom rules
Custom response rules are designed to give customers full control of the rule logic. A useful rule can stop an administration interface from being exposed when an authentication gateway has not marked the request as internal. For example:
http.request.uri.path starts_with "/admin" and not http.request.headers["x-internal-user"][0] eq "true" and http.response.code eq 200 and http.response.headers["content-type"][0] contains "text/html"
This blocks only when an unauthenticated request targets `/admin` and the origin actually returns a successful HTML administration page. It does not block ordinary authentication failures, redirects, or non-administration traffic.
All customers can create up to three custom response rules supporting Log and Block actions. The fields and functions available in response to custom rules mirrors what your plan gives you access to in request custom rules already. Creating rules on the response body is not yet available.
Following the Attack Signature Detection approach, paying customers also have access to the outcome of attack detections through the cf.waf.signature.response.* fields listed above. These fields can be combined with other parameters (such as a hostname, URL path, source IP, request header) to enable protection on a single path, or limit the policy to application-specific context. We are currently rolling out the response fields to all our accounts. If you don’t have access to them yet, please contact your account team.
Investigating matching requests
When a managed or custom response rule logs or blocks a transaction, the event is available in Security Events. This means responders can trace any detection back to the full context of the request and the specific rule that took action.
At the moment, both request-only rules and full-transaction rules are shown together in the same analytics page. In Security Events, the events generated by response rules are part of the Managed Rules or Custom Rules service. You can filter events belonging to a specific rule ID in the relative rule list section.
Get started today
Full transaction detection is generally available for all zones proxying traffic through Cloudflare. To verify that you’re protected, go to Security > Security Rules in the Cloudflare dashboard. If you want to customize your policy, start by reviewing full transaction detections in Security Analytics, then create the response phase policy that fits your application.
A Akamai detectou e investigou uma intrusão em múltiplas etapas direcionada à infraestrutura de supply chain na América Latina, identificando atividades suspeitas que sugeriram tentativas de estabelecer acesso remoto, mapear o ambiente interno e expandir o acesso além do sistema inicialmente comprometido. Ao cruzar sinais entre workload, processo, rede e ameaça inteligente, o ExAR ajudou […]

 Entrar